Copyright
©The Author(s) 2023.
World J Psychiatry. May 19, 2023; 13(5): 203-214
Published online May 19, 2023. doi: 10.5498/wjp.v13.i5.203
Published online May 19, 2023. doi: 10.5498/wjp.v13.i5.203
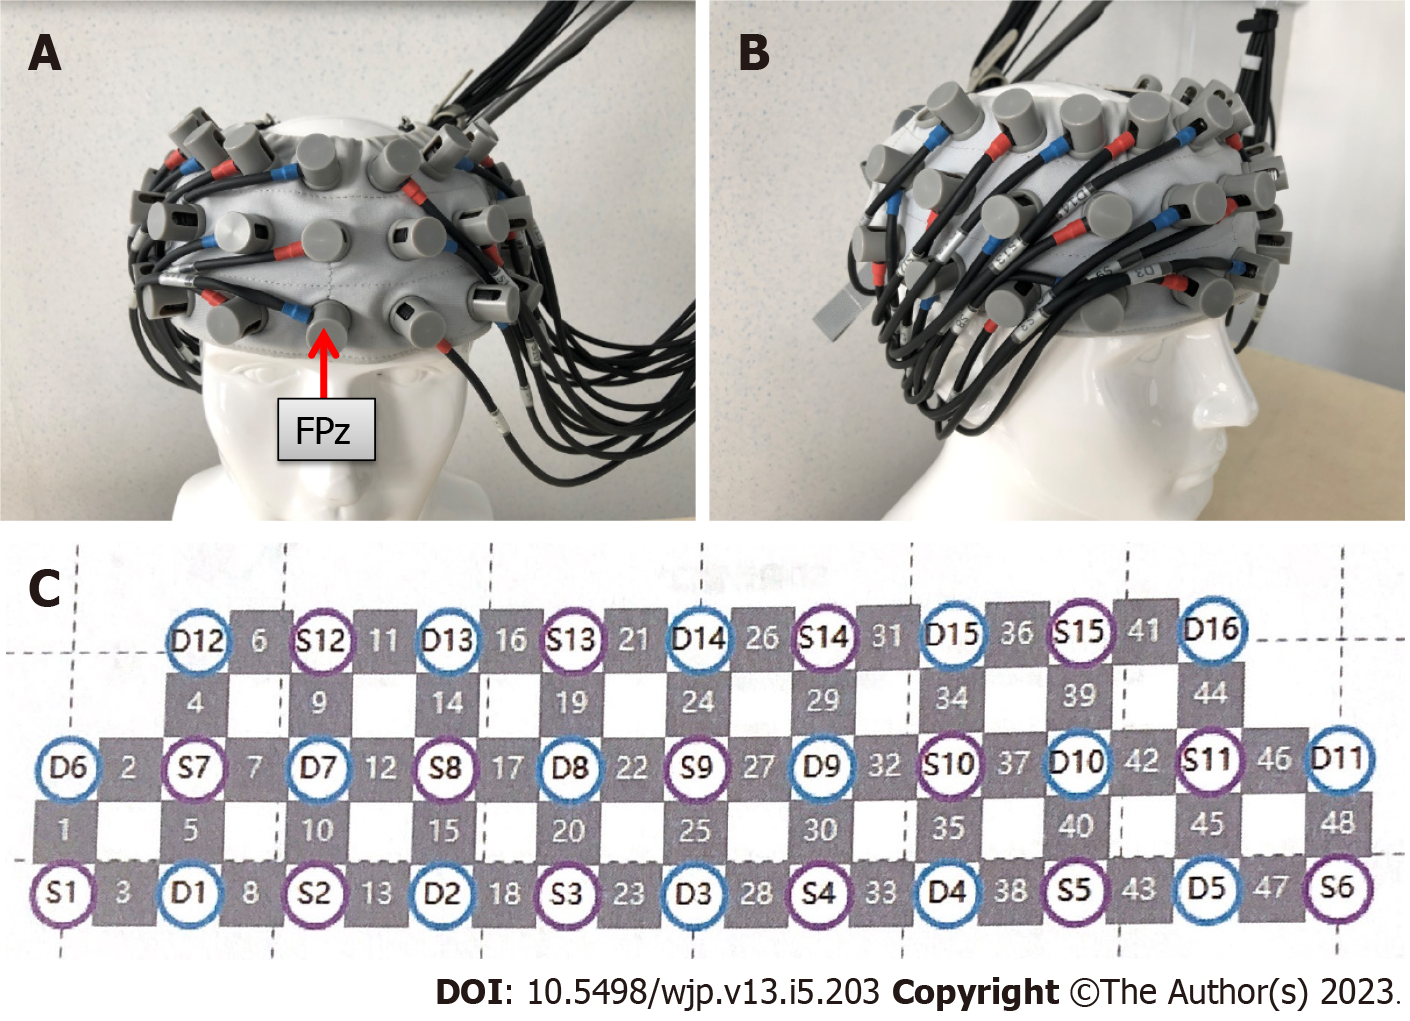
Figure 1 Diagrammatic sketch of localization of the functional near-infrared spectroscopy probe set over left and right frontotemporal cortex.
A: Anterior view; B: Lateral view; C: Probe arrangement. Blue circle: Detectors; Purple circle: Light source.
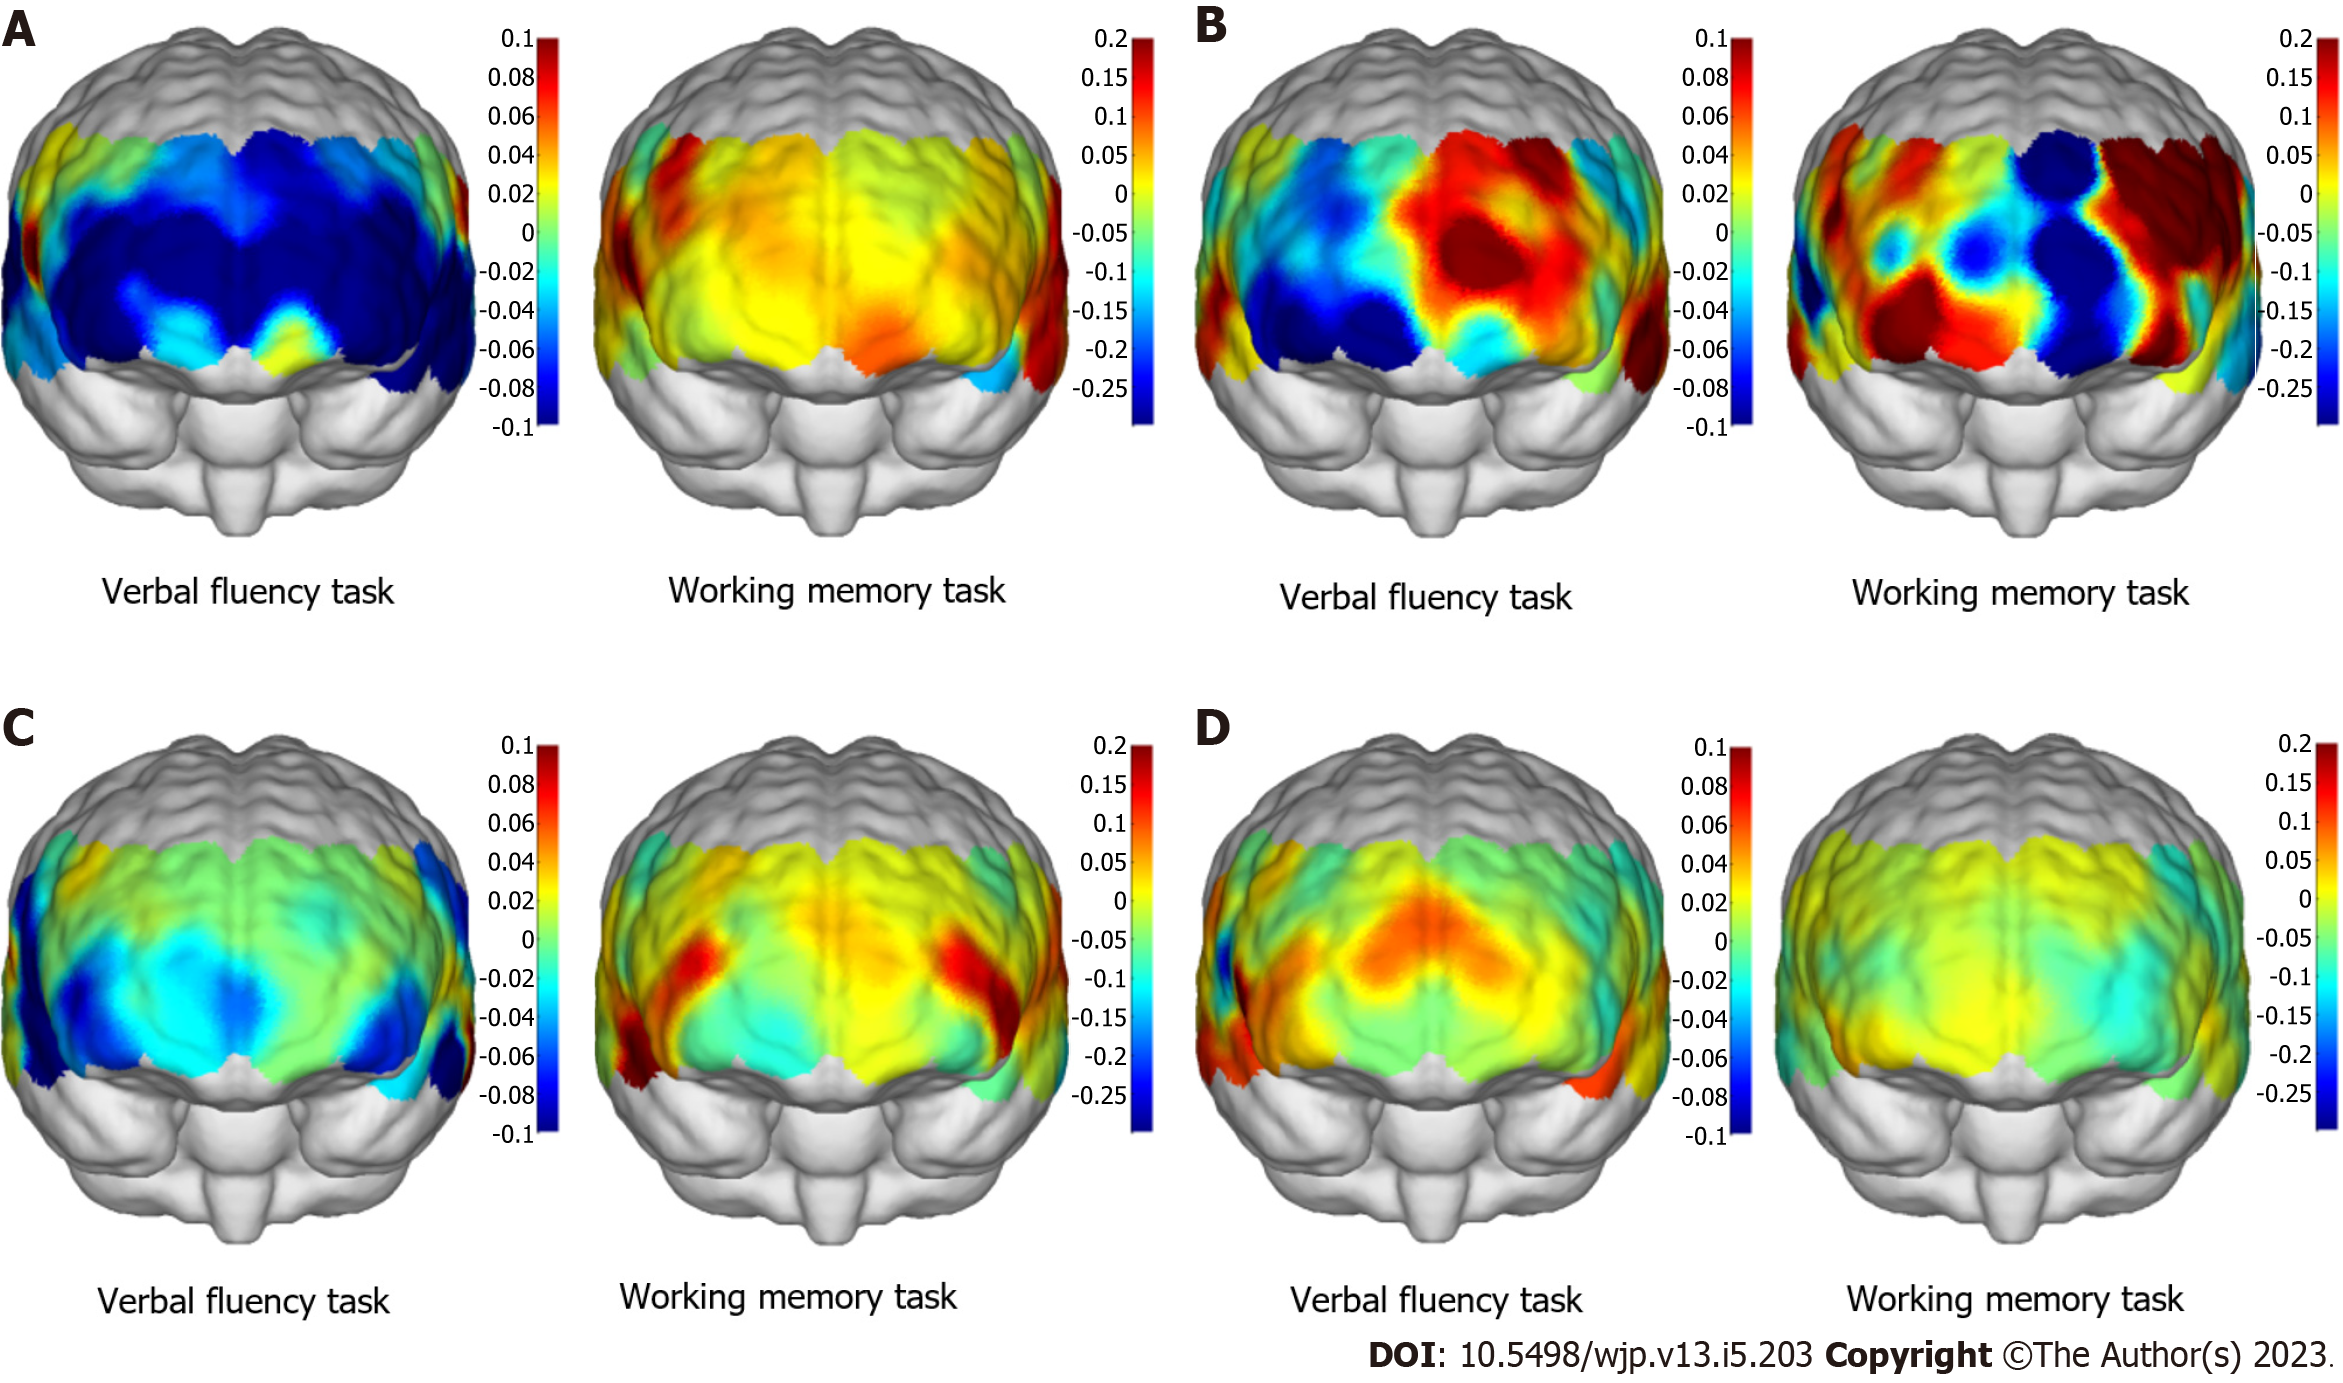
Figure 2 Comparison of functional near-infrared spectroscopy patterns and task performances during the verbal fluency task (left) and the working memory task (right) between four types of dementia patients.
A: Frontotemporal lobe dementia; B: Lewy body dementia; C: Parkinson’s disease dementia; D; Alzheimer’s disease. Red indicates higher activation, while blue indicates lower activation.
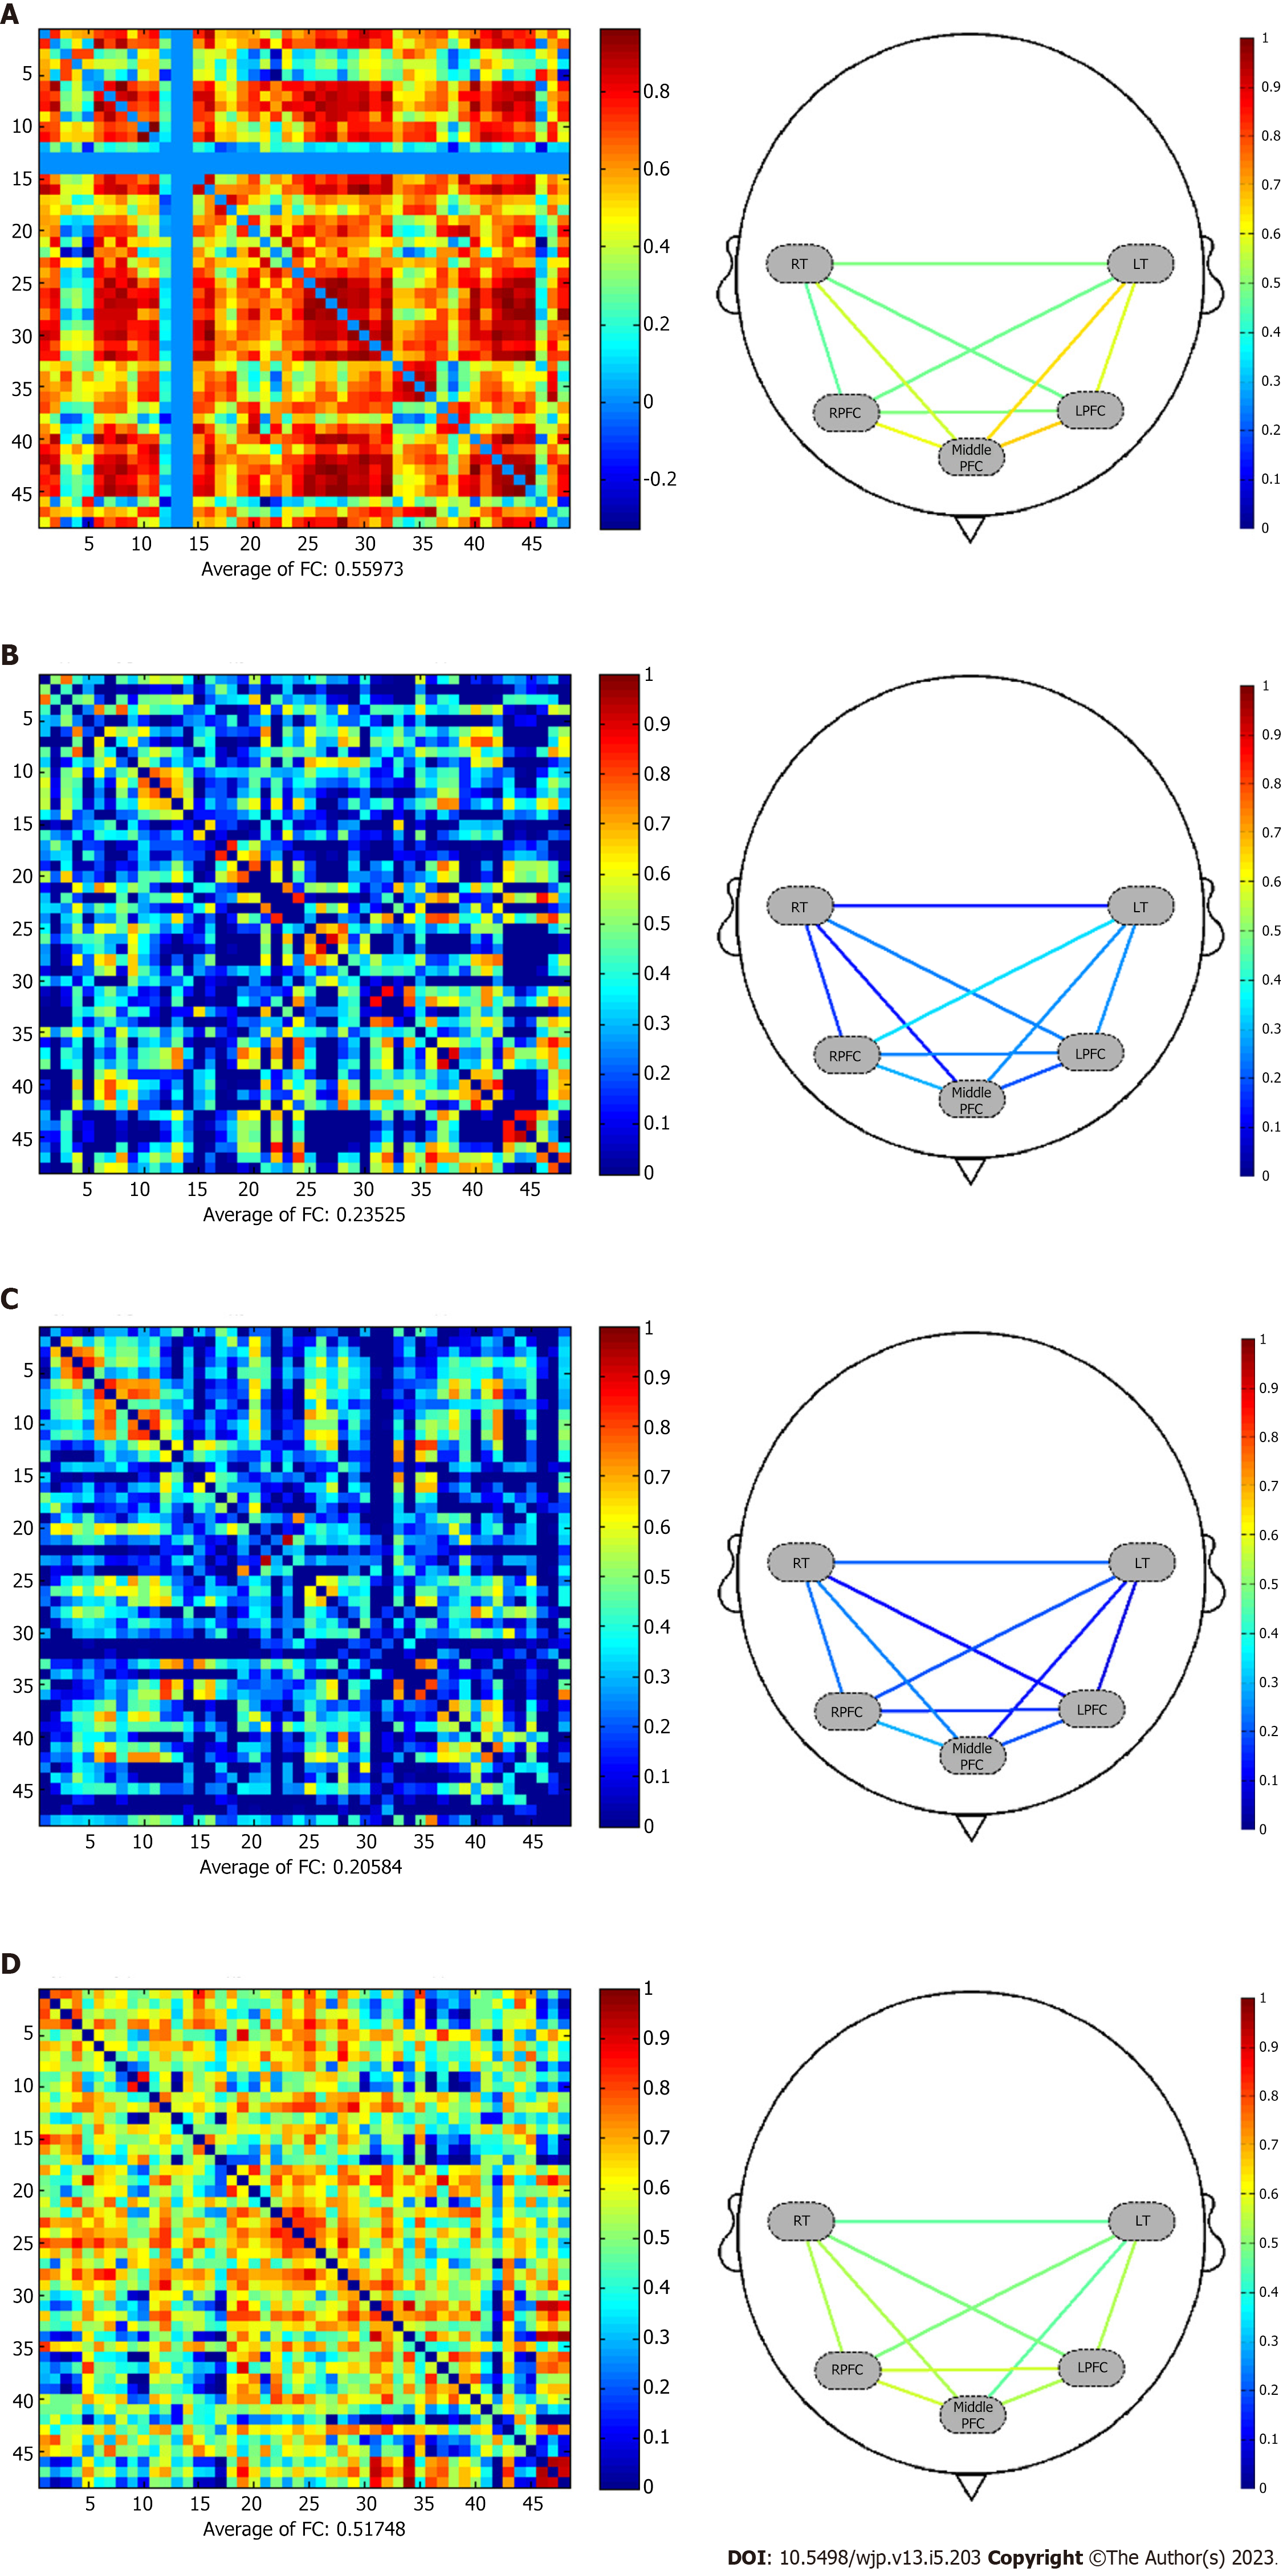
Figure 3 Resting state functional connections were calculated by conducting Pearson’s correlation analysis between the time series of every pair of measurement channels.
A: Frontotemporal lobe dementia; B: Lewy body dementia; C: Parkinson’s disease dementia; D: Alzheimer’s disease. Red indicates higher activation, while blue indicates lower activation.
- Citation: Mei X, Zou CJ, Hu J, Liu XL, Zheng CY, Zhou DS. Functional near-infrared spectroscopy in elderly patients with four types of dementia. World J Psychiatry 2023; 13(5): 203-214
- URL: https://www.wjgnet.com/2220-3206/full/v13/i5/203.htm
- DOI: https://dx.doi.org/10.5498/wjp.v13.i5.203


