Copyright
©The Author(s) 2021.
World J Psychiatr. Aug 19, 2021; 11(8): 491-506
Published online Aug 19, 2021. doi: 10.5498/wjp.v11.i8.491
Published online Aug 19, 2021. doi: 10.5498/wjp.v11.i8.491
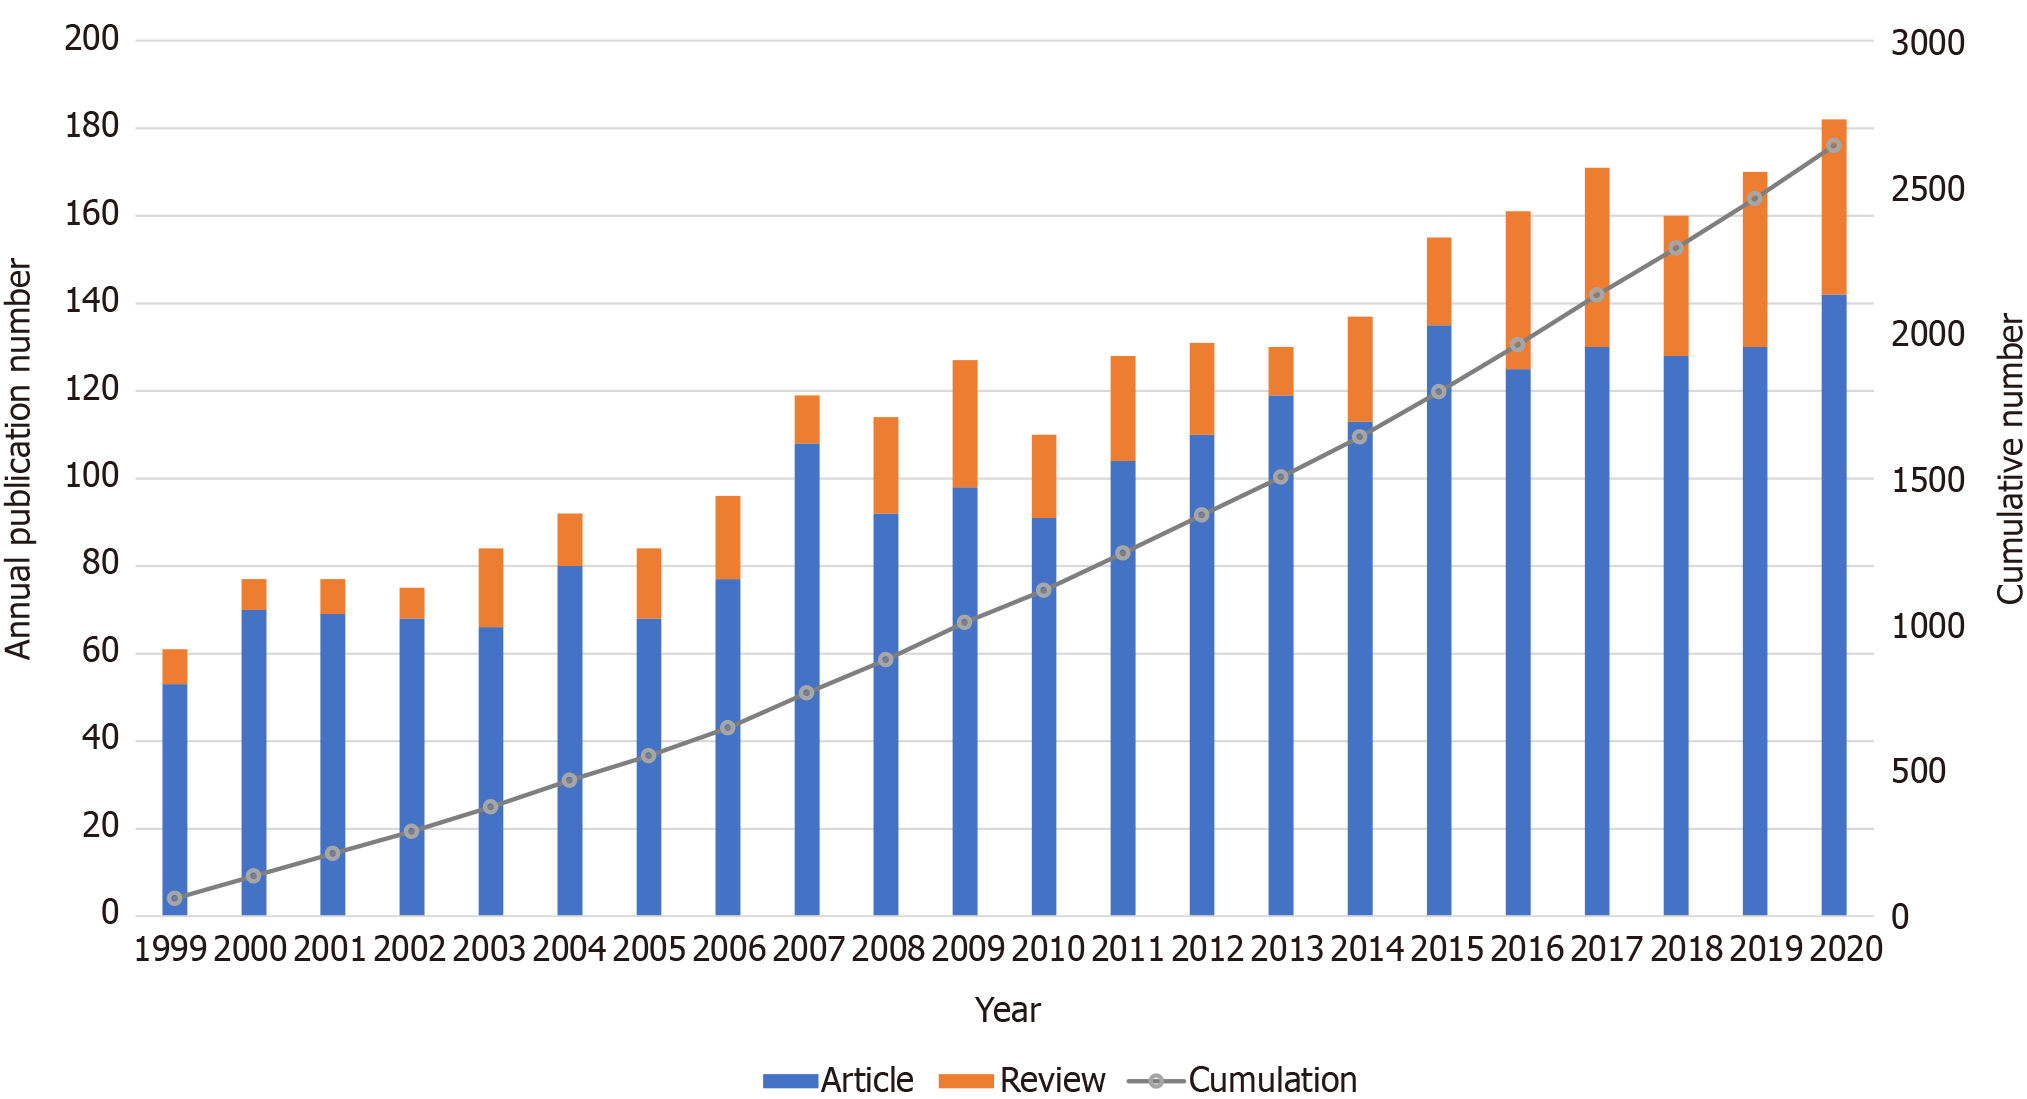
Figure 1 Publication output performance during 1999-2020.
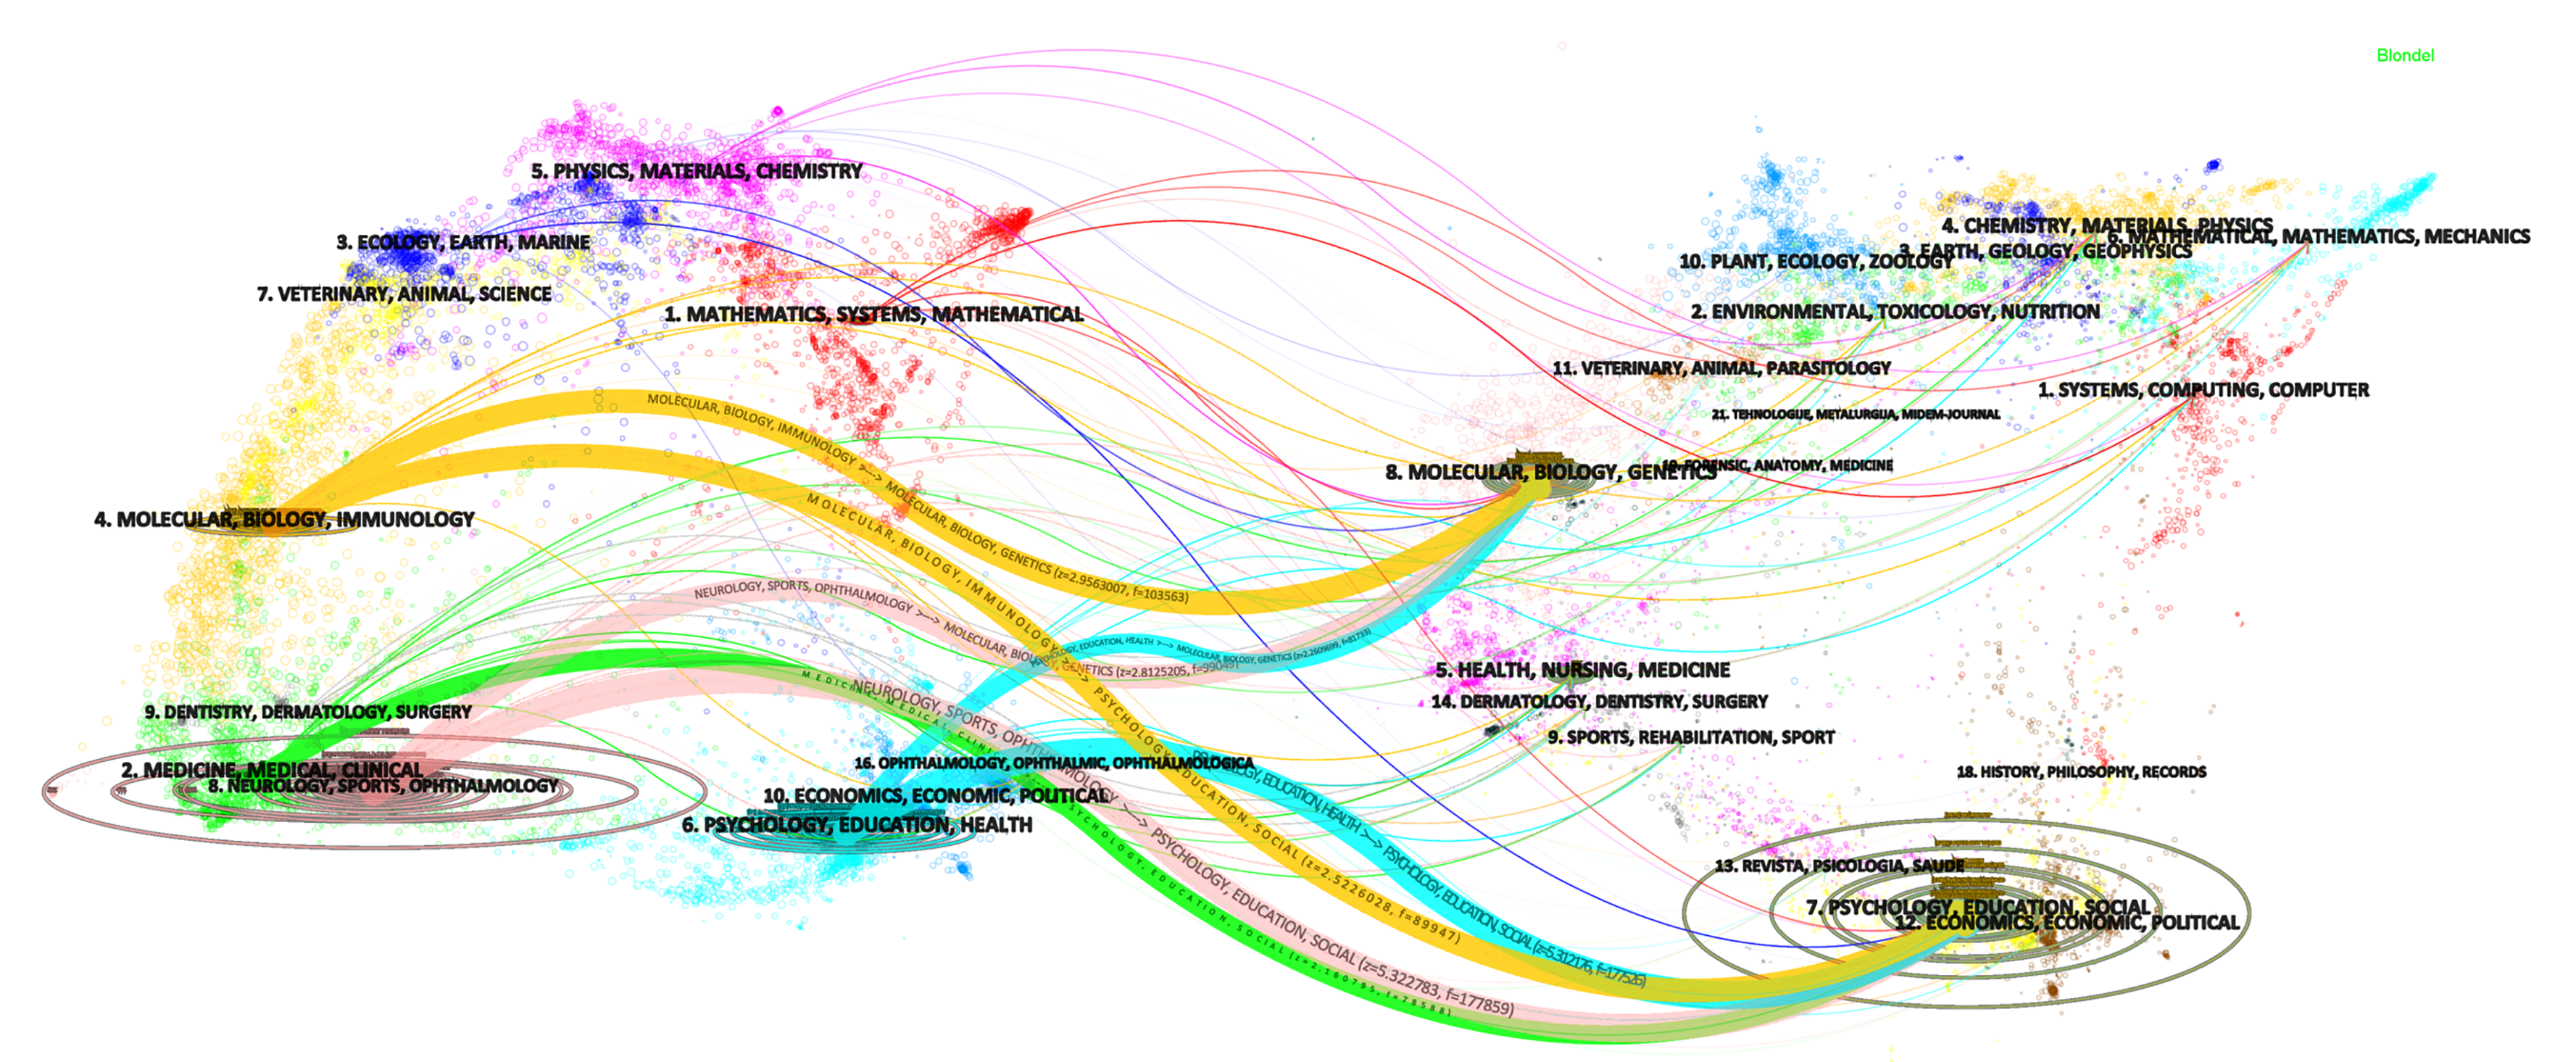
Figure 2 Dual-map overlay for final document storage.
The nature of each region is labeled by the journal of the corresponding region. The colored curve represents the reference path from the citing base map on the left to the cited base map on the right. The number of articles and authors published in journals determines the size of the ellipse in the graph.
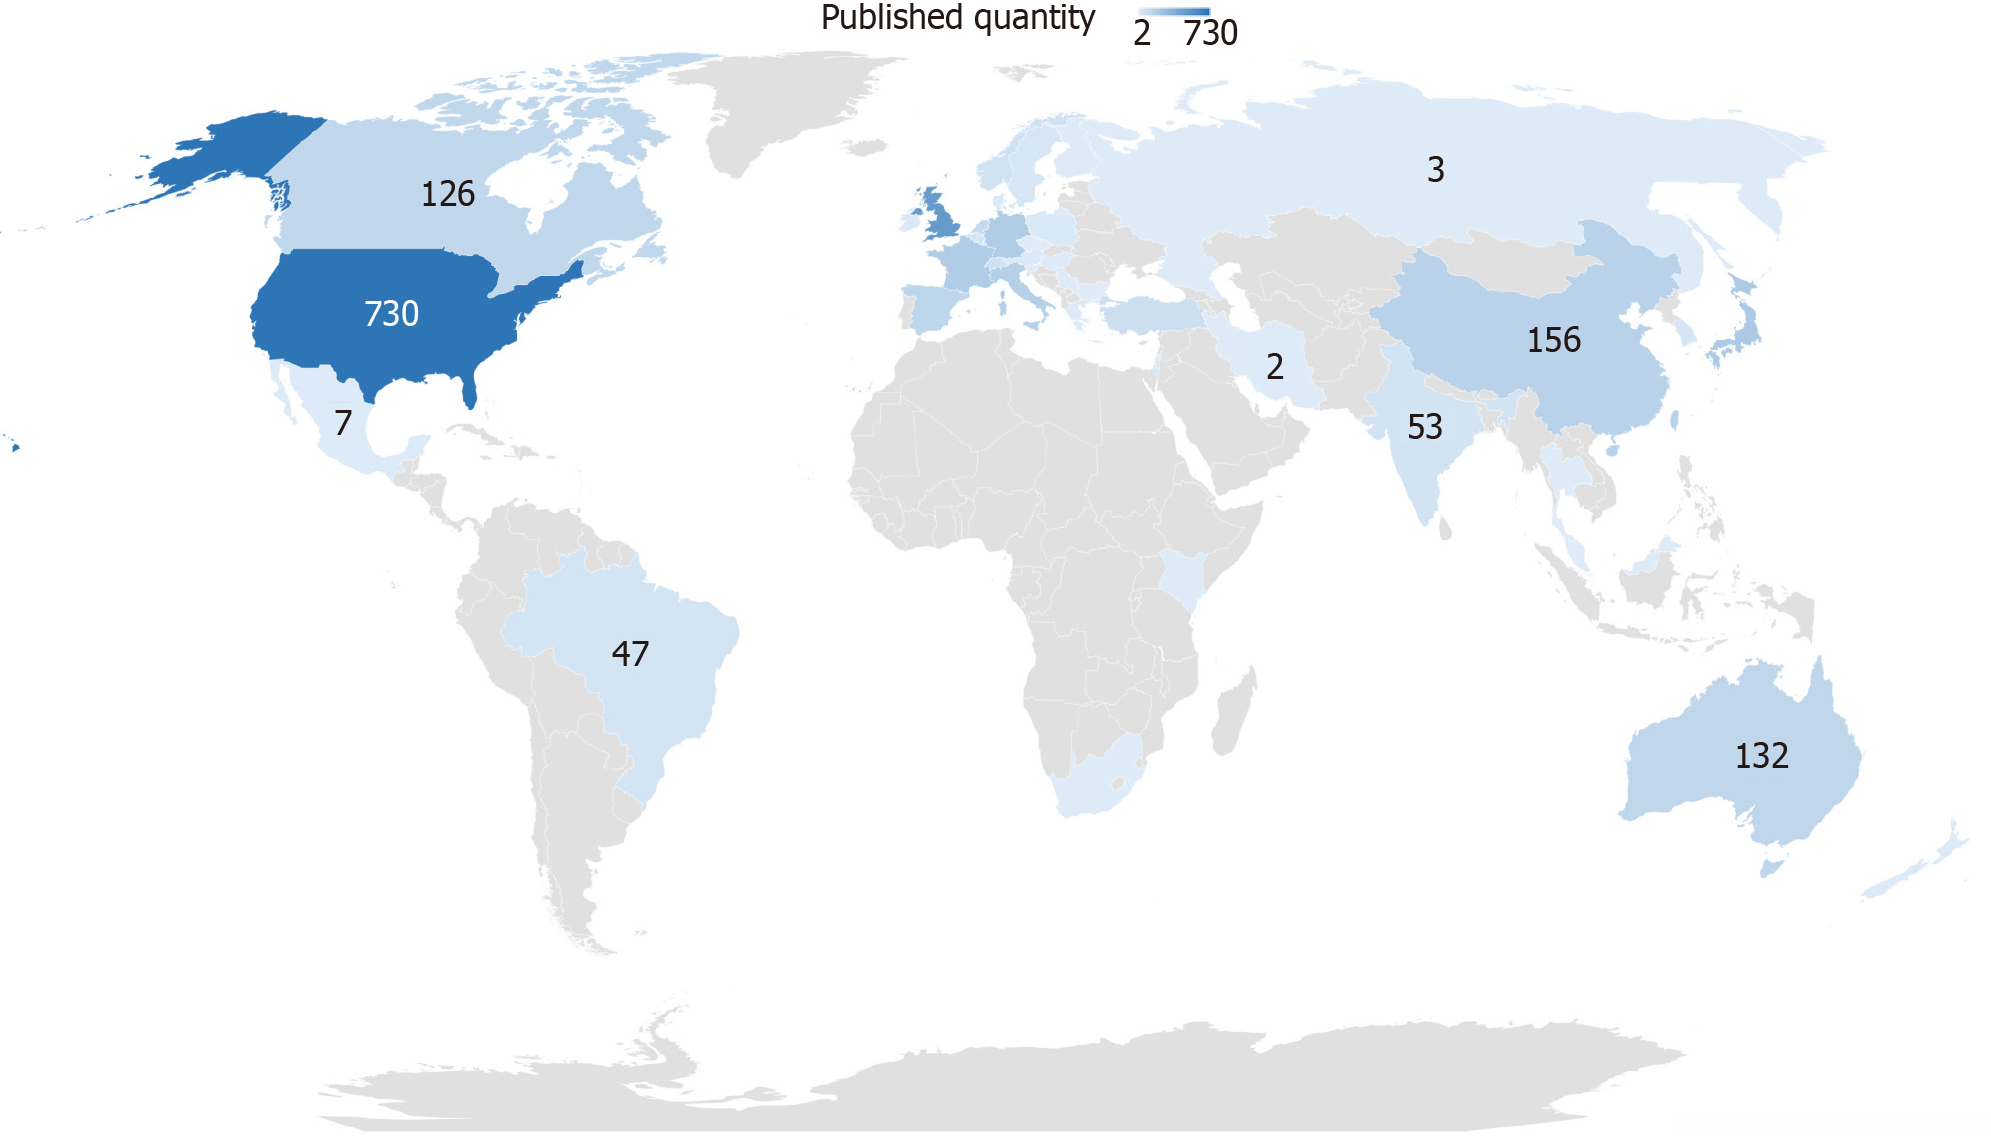
Figure 3 Geographic distribution of the countries.
The figures represent the corresponding country’s total published quantity on visual hallucination between 1999 and 2020. The larger the published quantity, the deeper the color.
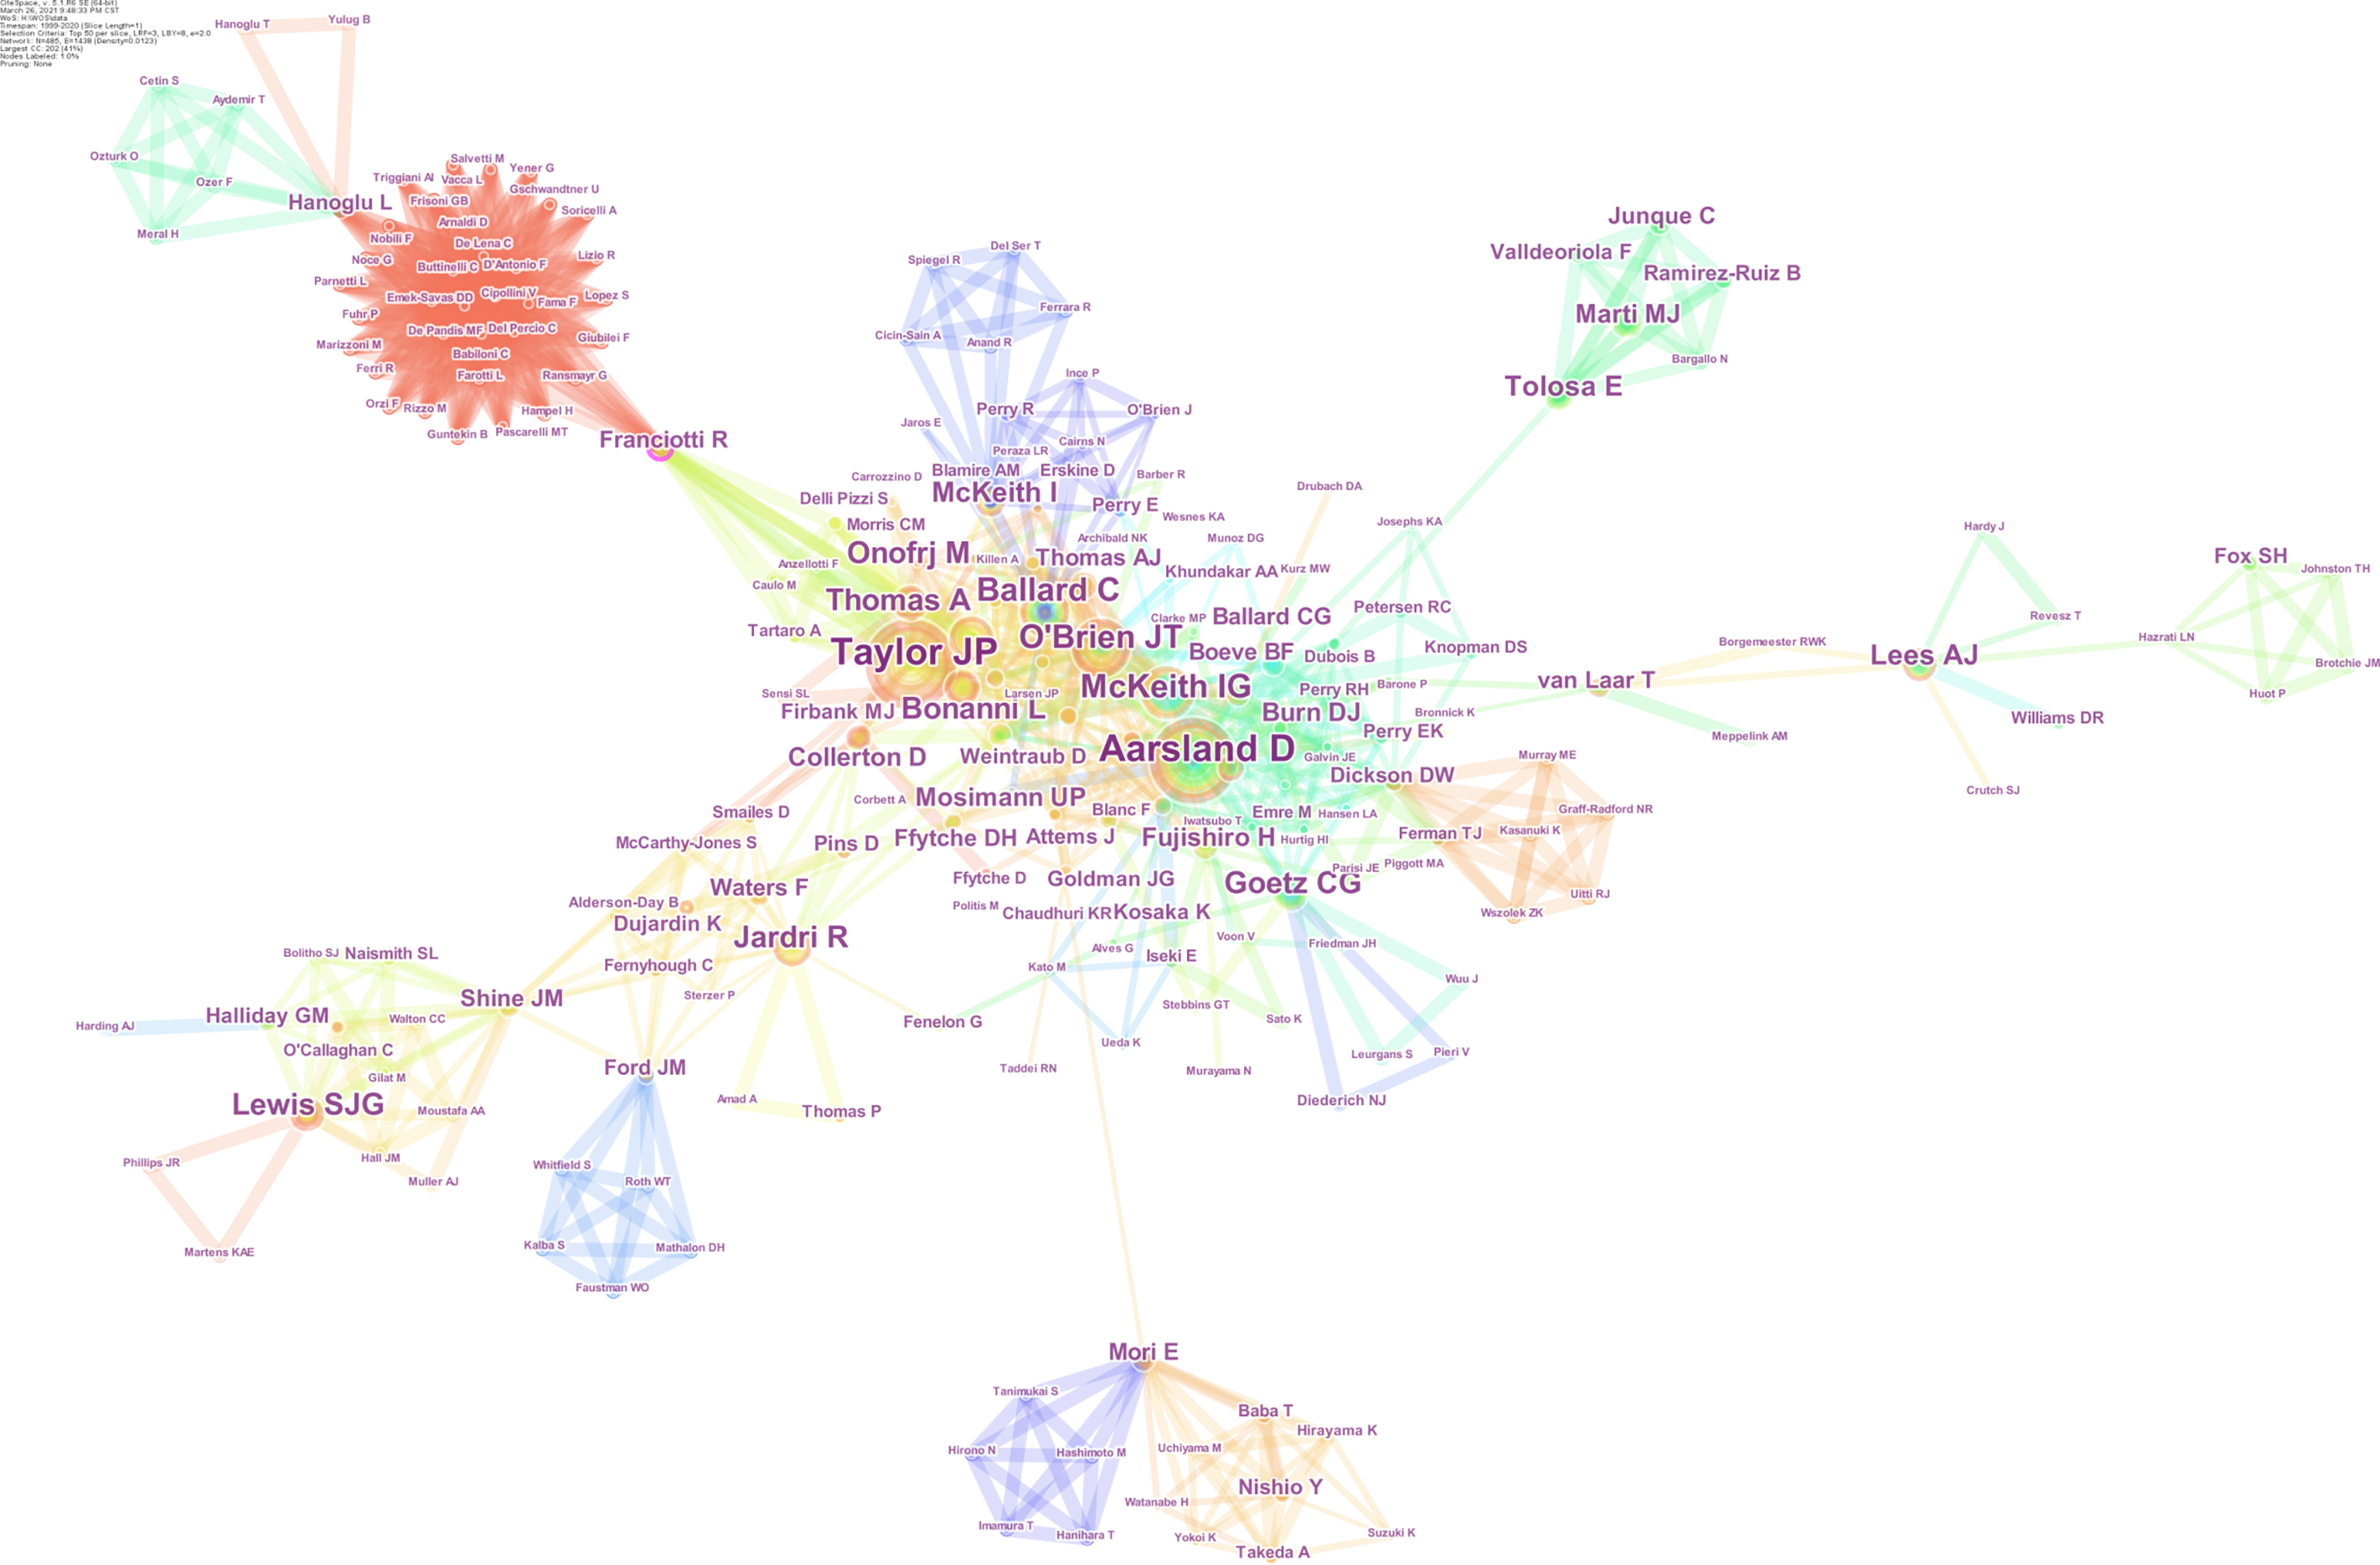
Figure 4 Map of active authors in the visual hallucination field.
The font size of each author’s name represents the article counts of each author. Different colors inside the circle represent different time intervals. The collaborative intensity between authors can be seen from the thickness of the connecting line.
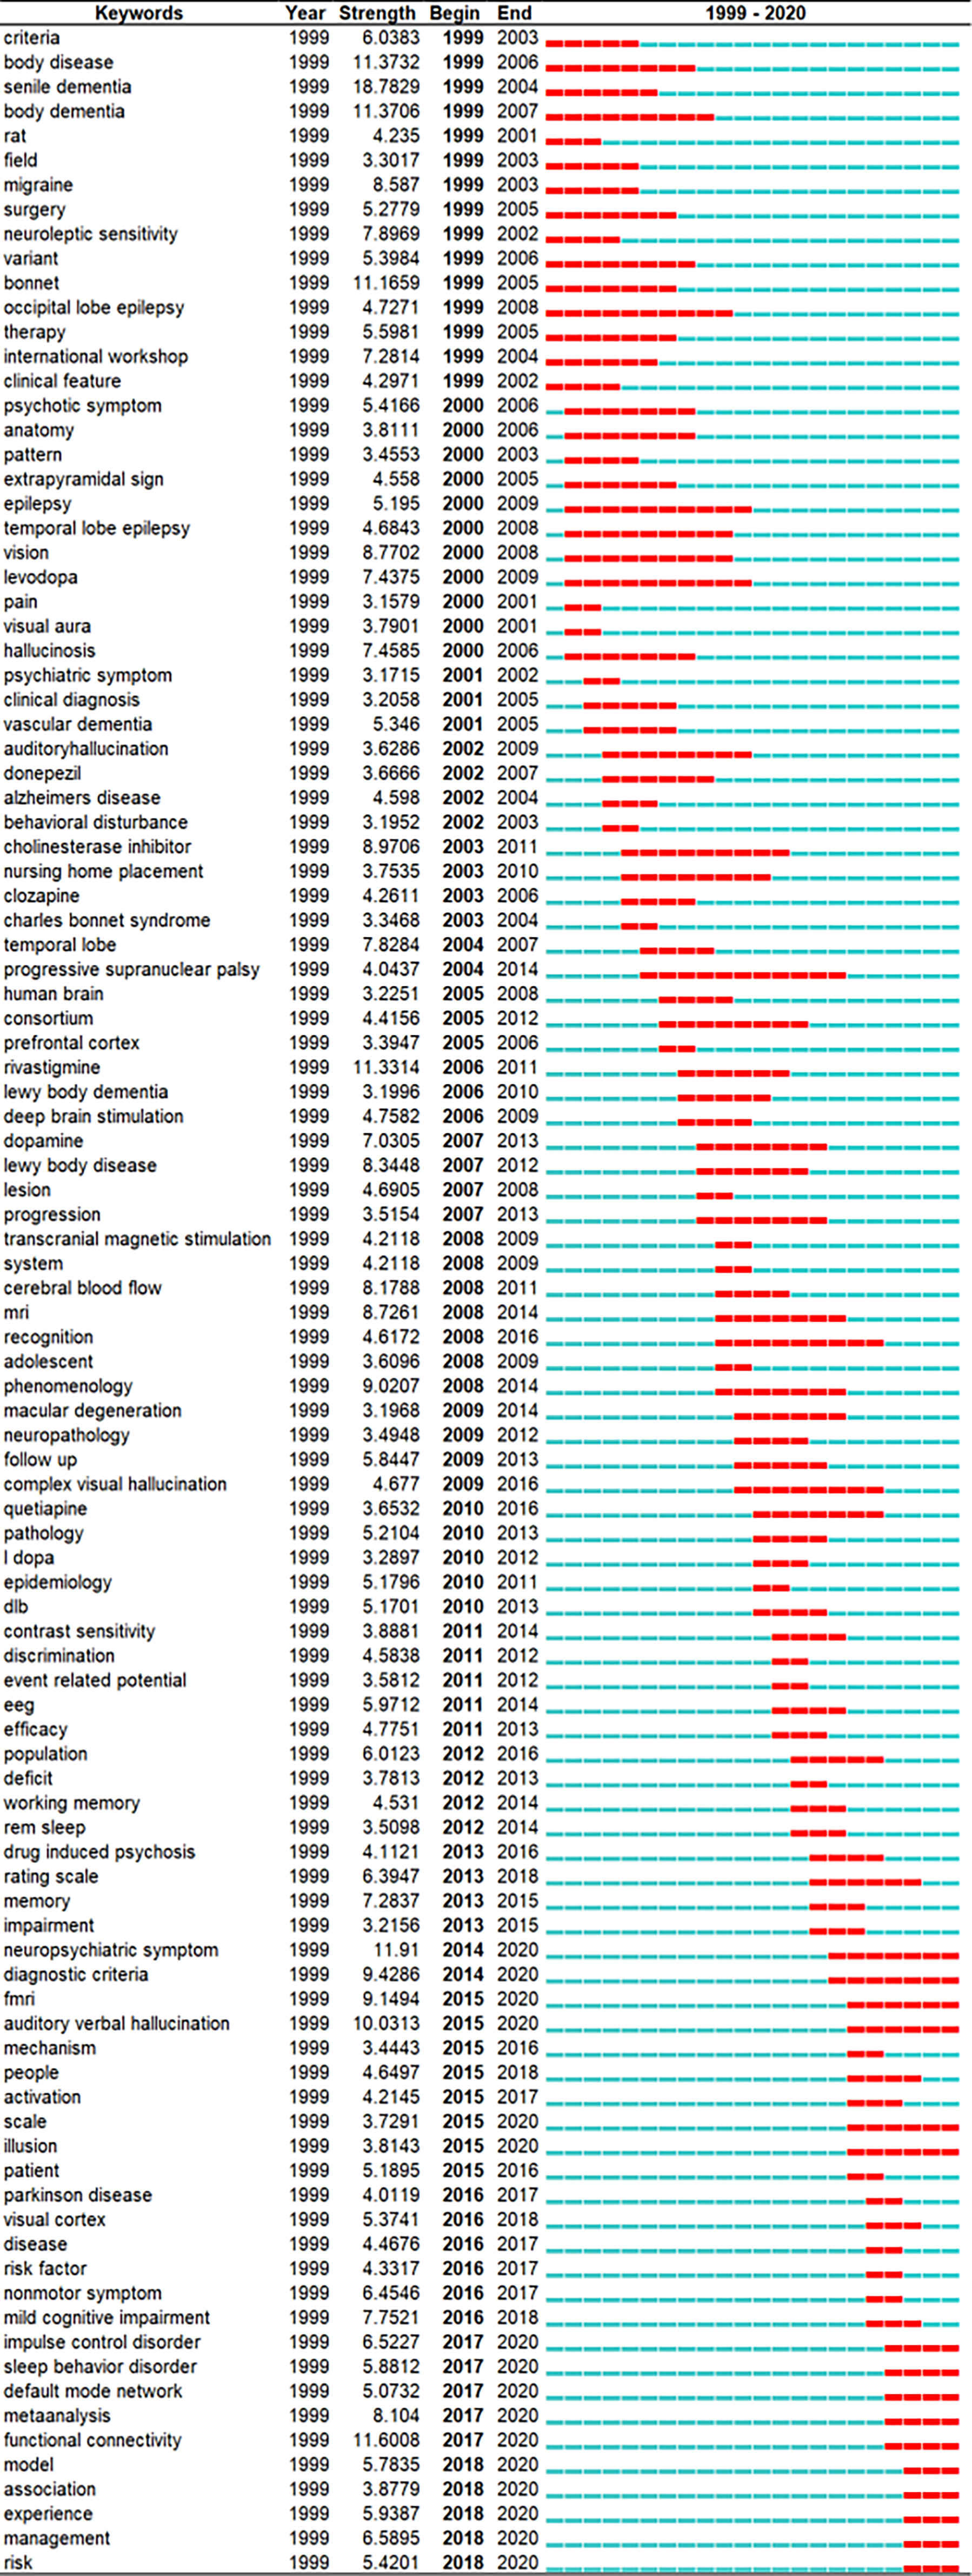
Figure 5 The top 104 burst keywords.
The blue line represents the timeline from 1999 to 2020, while the red line stands for the years when a keyword has burst.
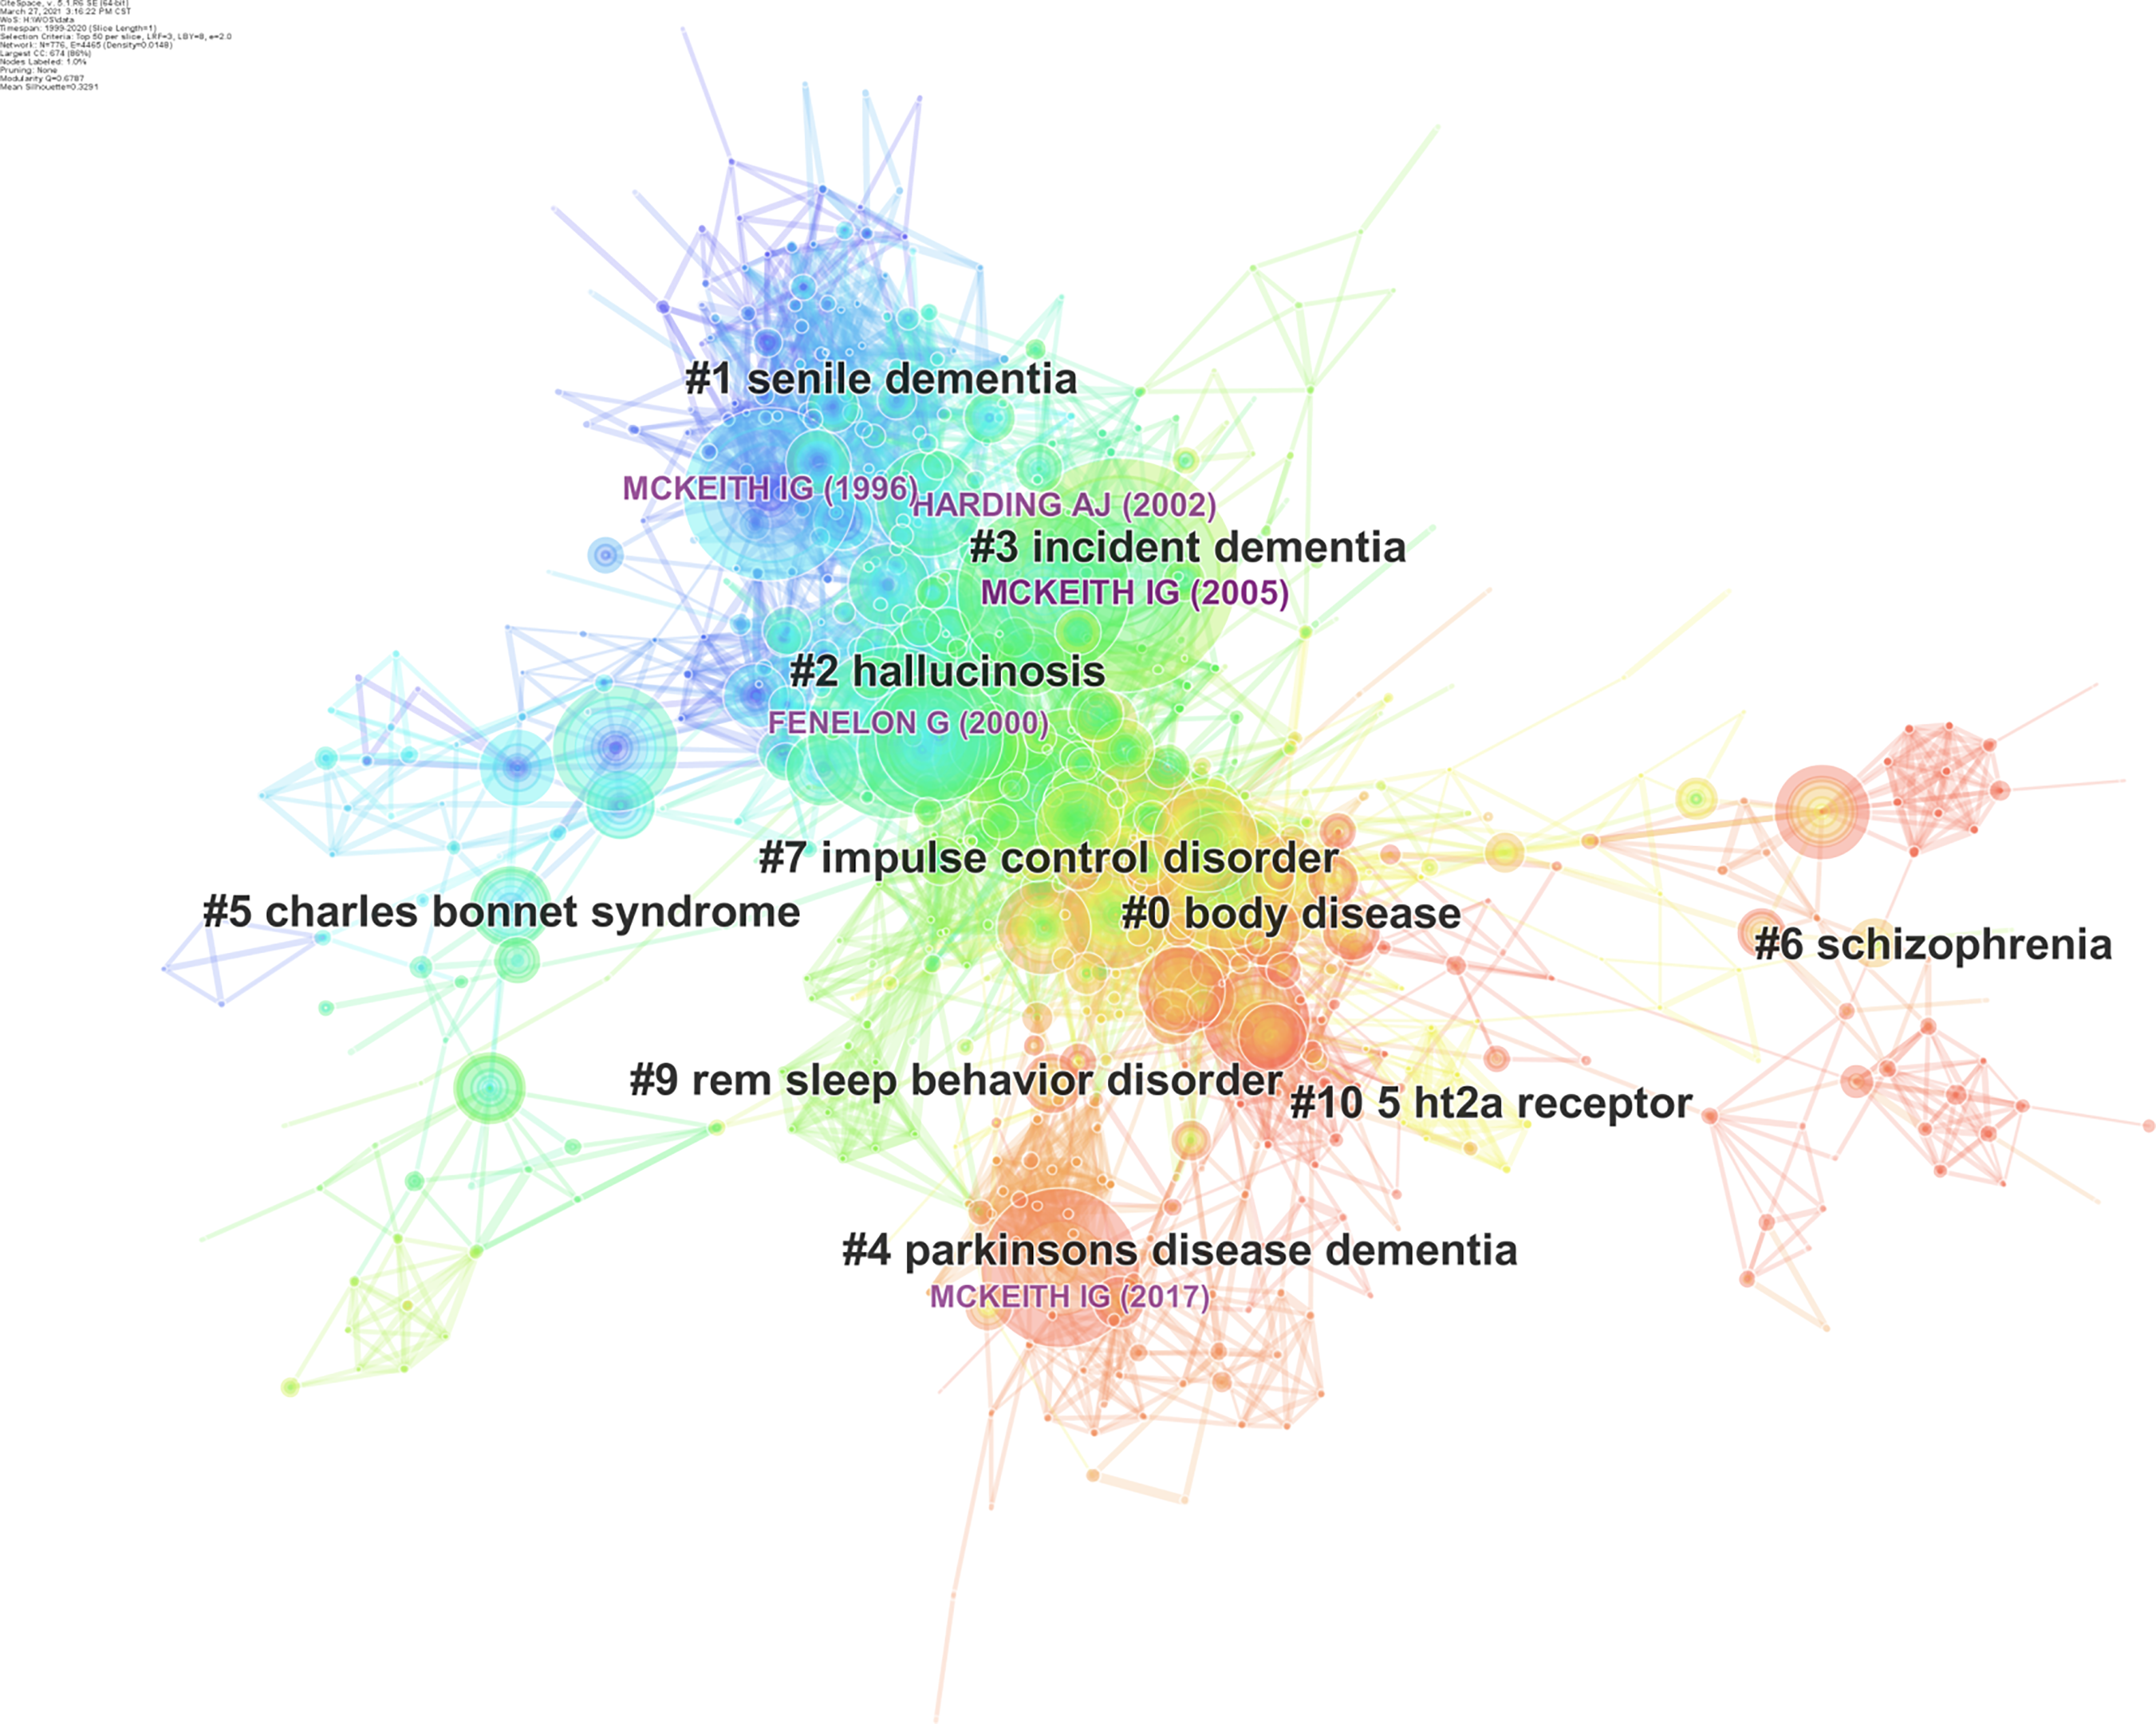
Figure 6 A network of 776 co-cited references representing citation patterns of top 50 articles per year between 1999 and 2020.
The overall structure can be divided into three major parts: the upper left part of the network is essentially in blue, which represent the co-citation between 1999 and 2005. The central part of the network is mainly in green and yellow, which indicates the relationship is probably constructed in the middle 7 yr from 2006 to 2012. The bottom right part is predominantly in red and connections were formed credibly in the most recent 8 yr, that is 2013-2020.
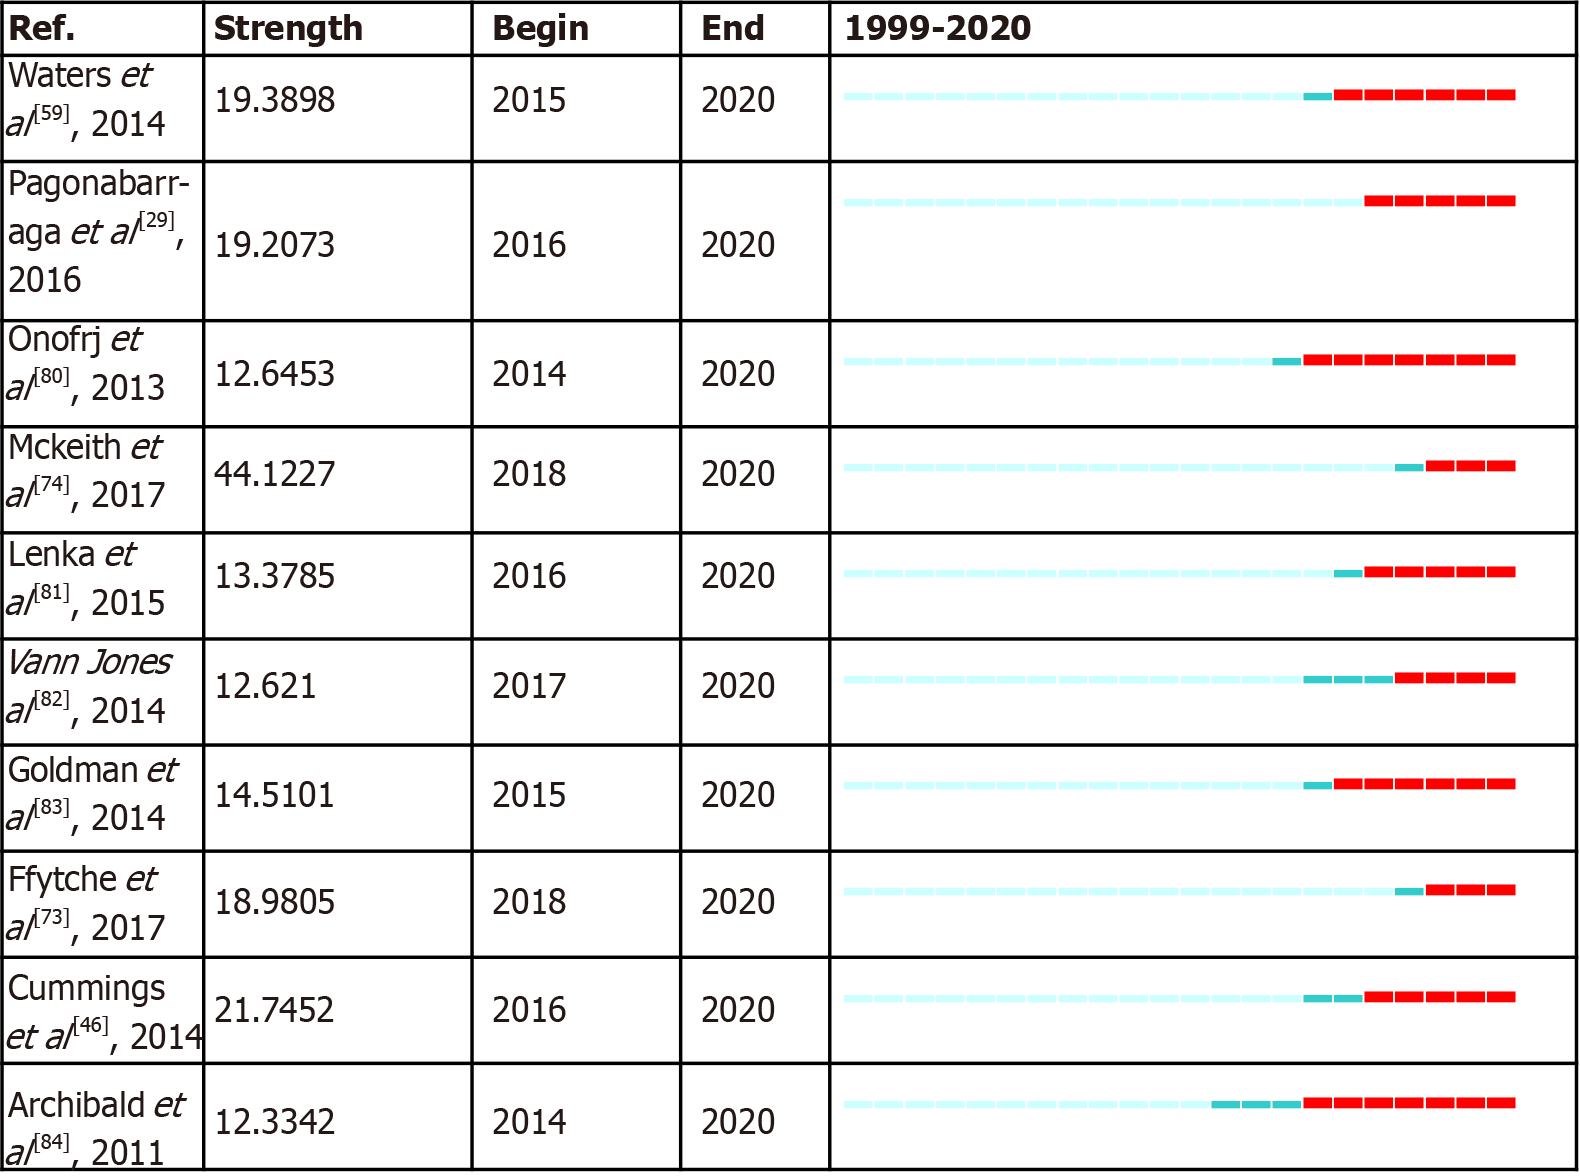
Figure 7 The top 10 references that retained citation burst until 2020.
- Citation: Zhong M, Wu Z, Jiang X, Shen B, Zhu J, Zhang L. Knowledge domain and emerging trends in visual hallucination research: A scientometric analysis. World J Psychiatr 2021; 11(8): 491-506
- URL: https://www.wjgnet.com/2220-3206/full/v11/i8/491.htm
- DOI: https://dx.doi.org/10.5498/wjp.v11.i8.491


