©The Author(s) 2021.
World J Crit Care Med. Sep 9, 2021; 10(5): 290-300
Published online Sep 9, 2021. doi: 10.5492/wjccm.v10.i5.290
Published online Sep 9, 2021. doi: 10.5492/wjccm.v10.i5.290
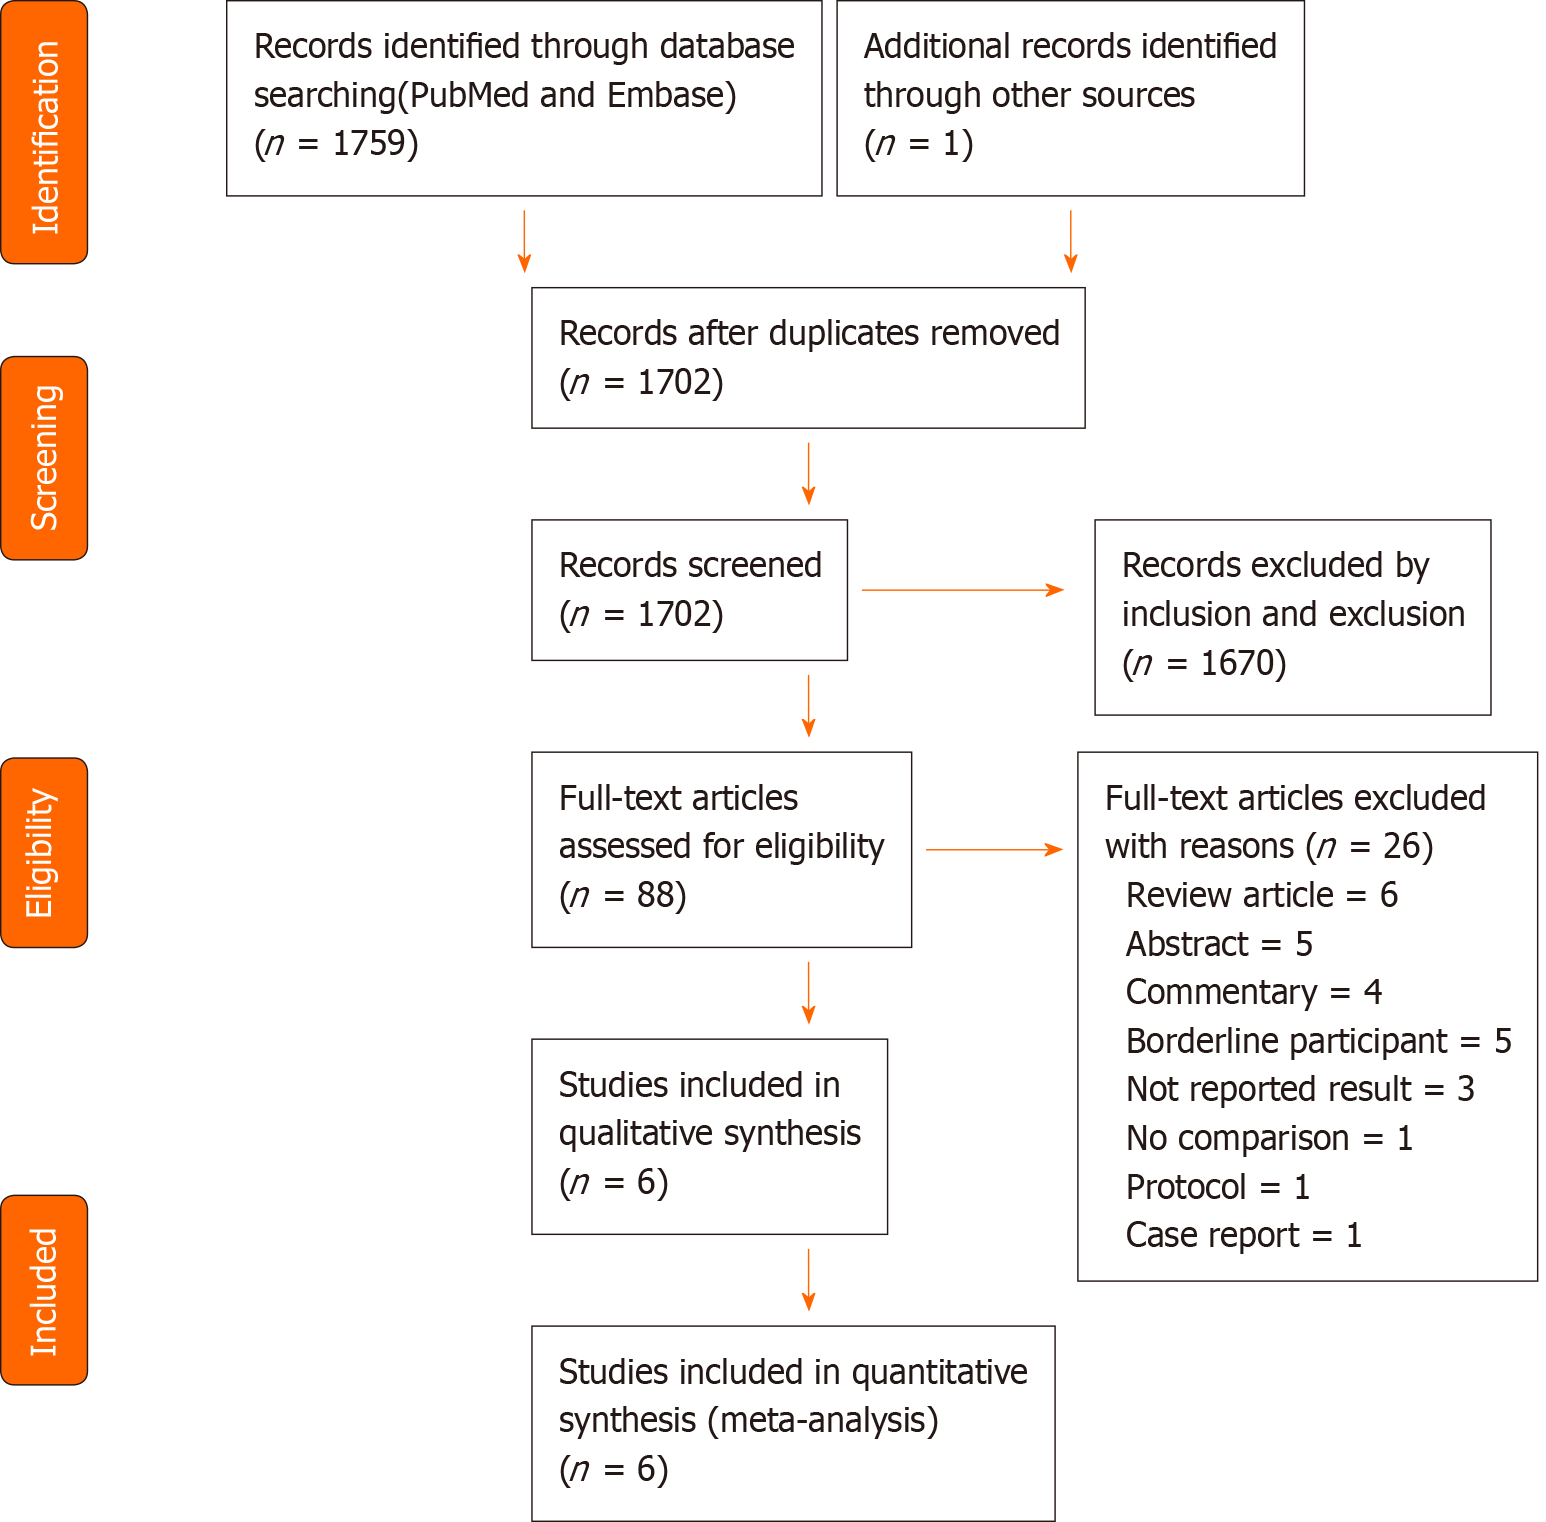
Figure 1 PRISMA flow chart of study selection.
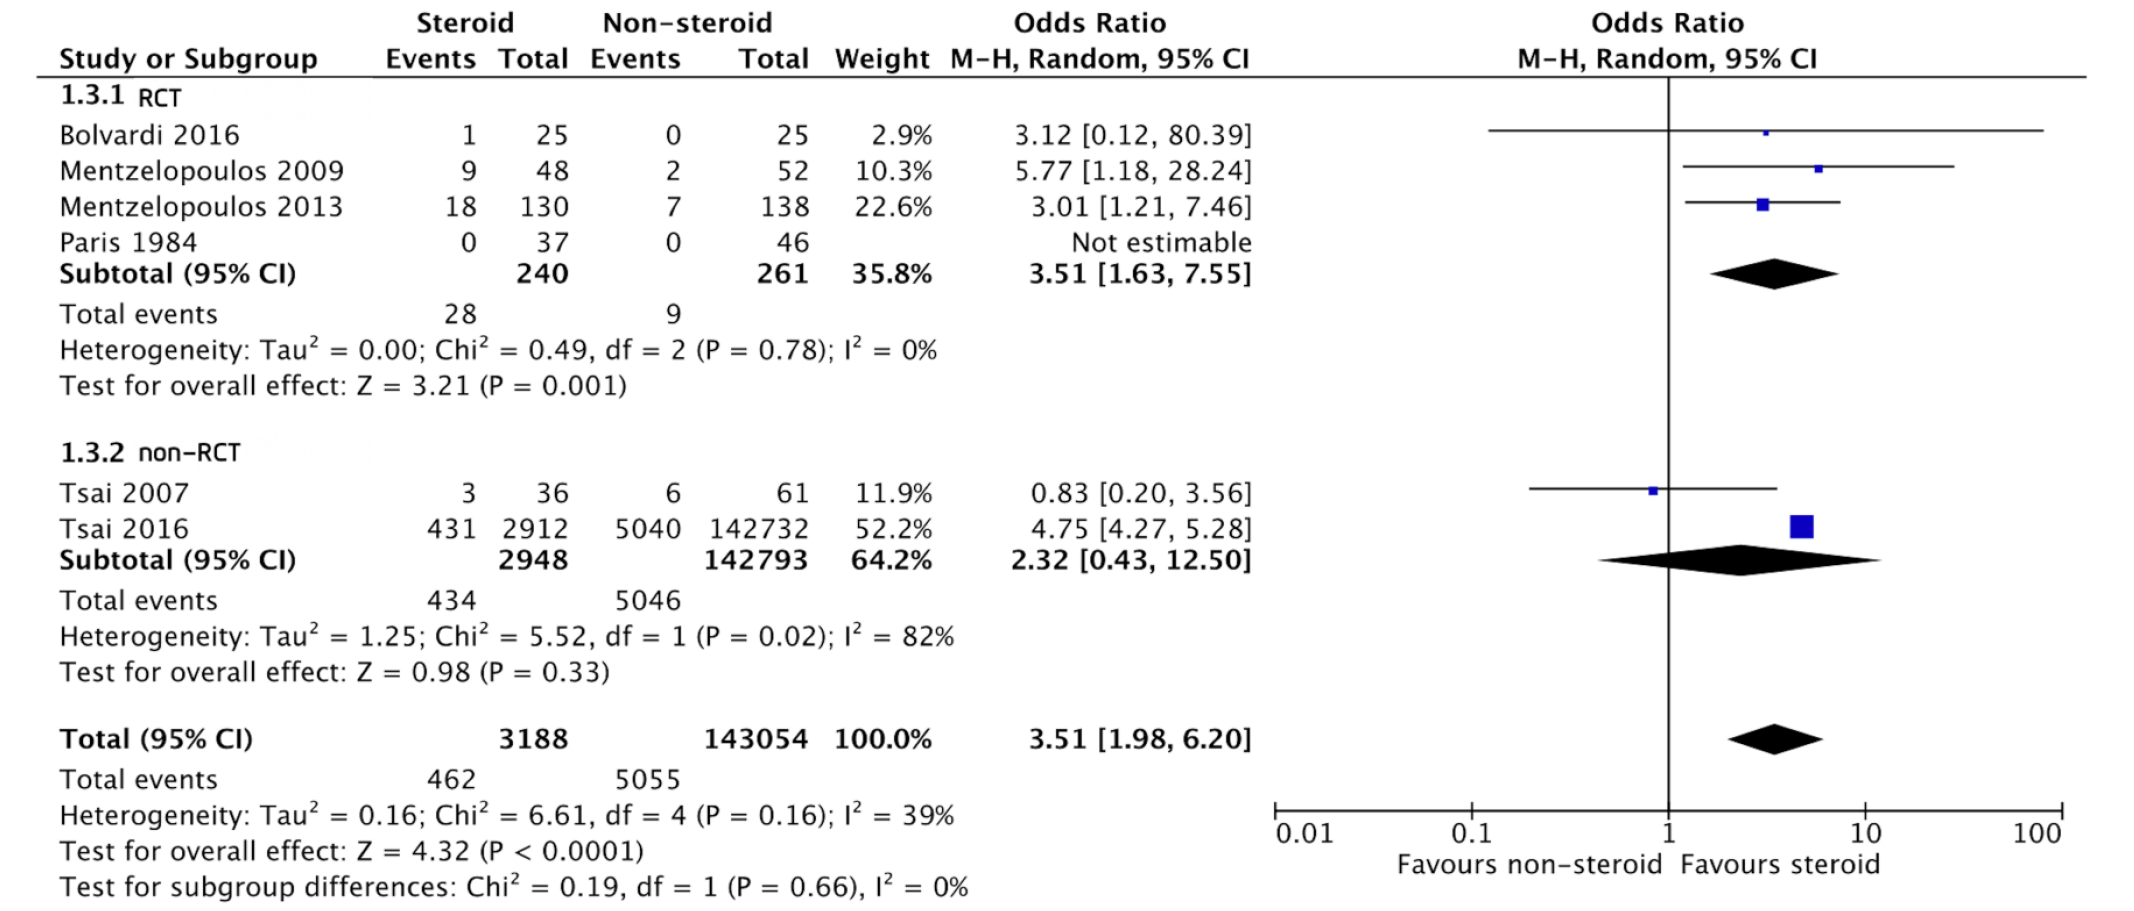
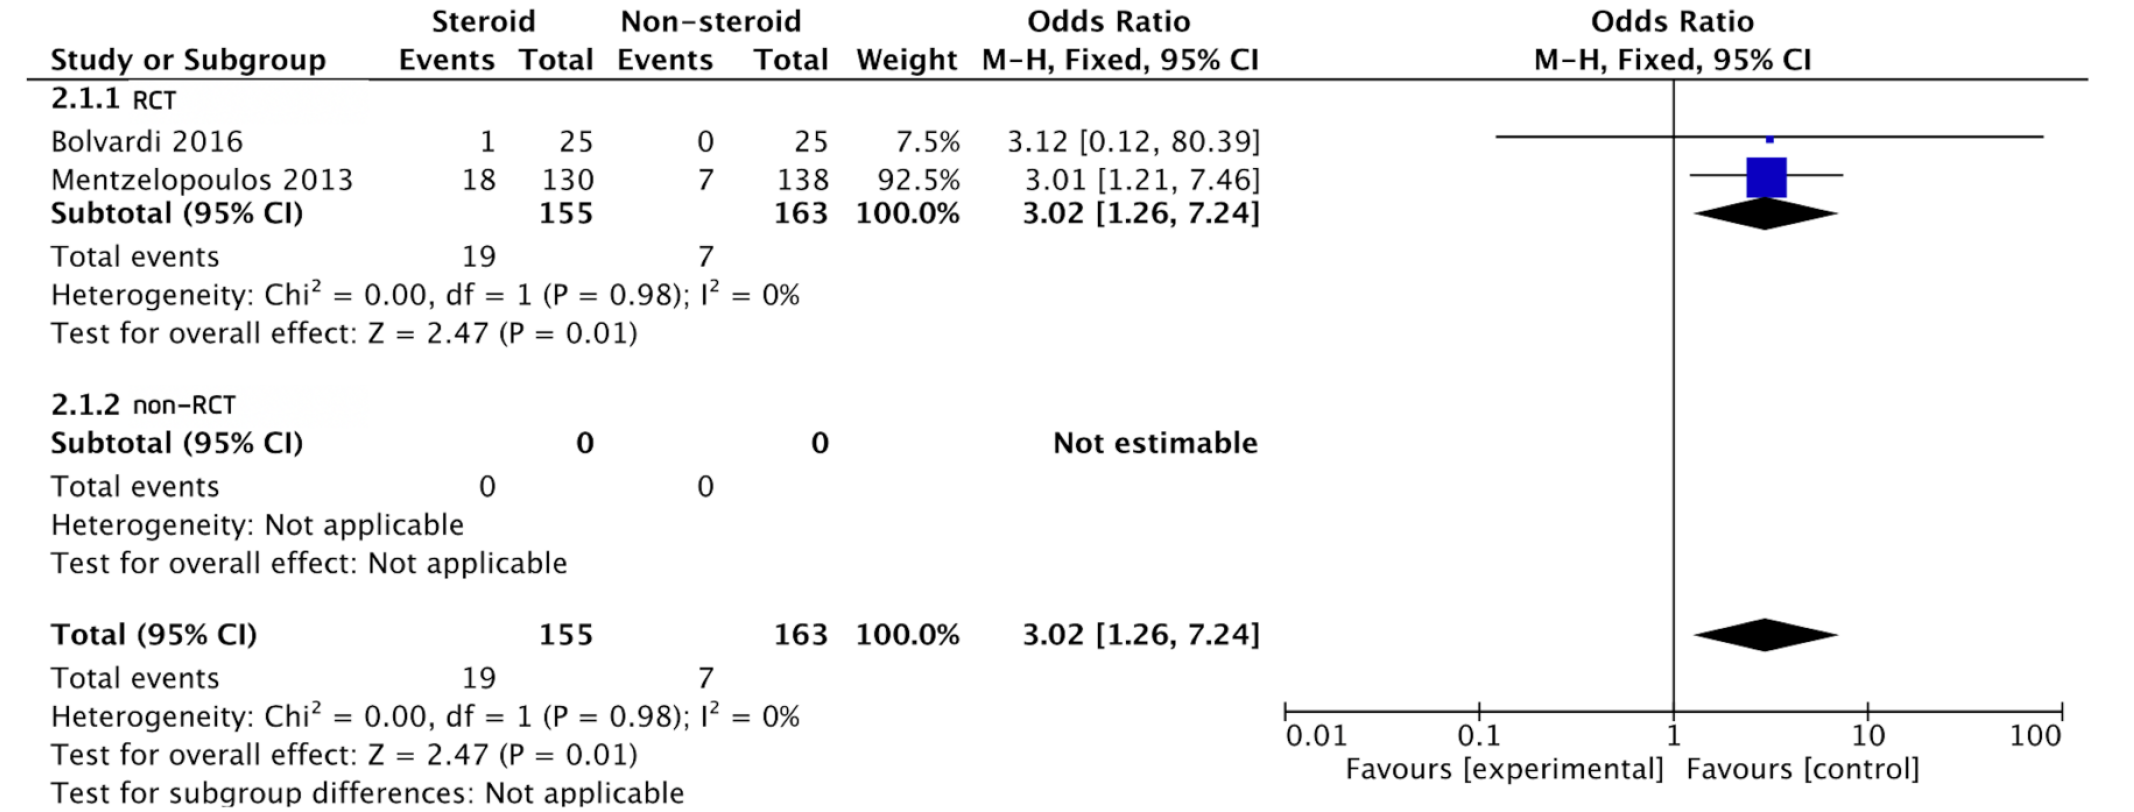
Figure 2 Forest plot comparing the odds ratios of survival at hospital discharge.
RCT: Randomized-controlled trial; CI: Confidence interval.
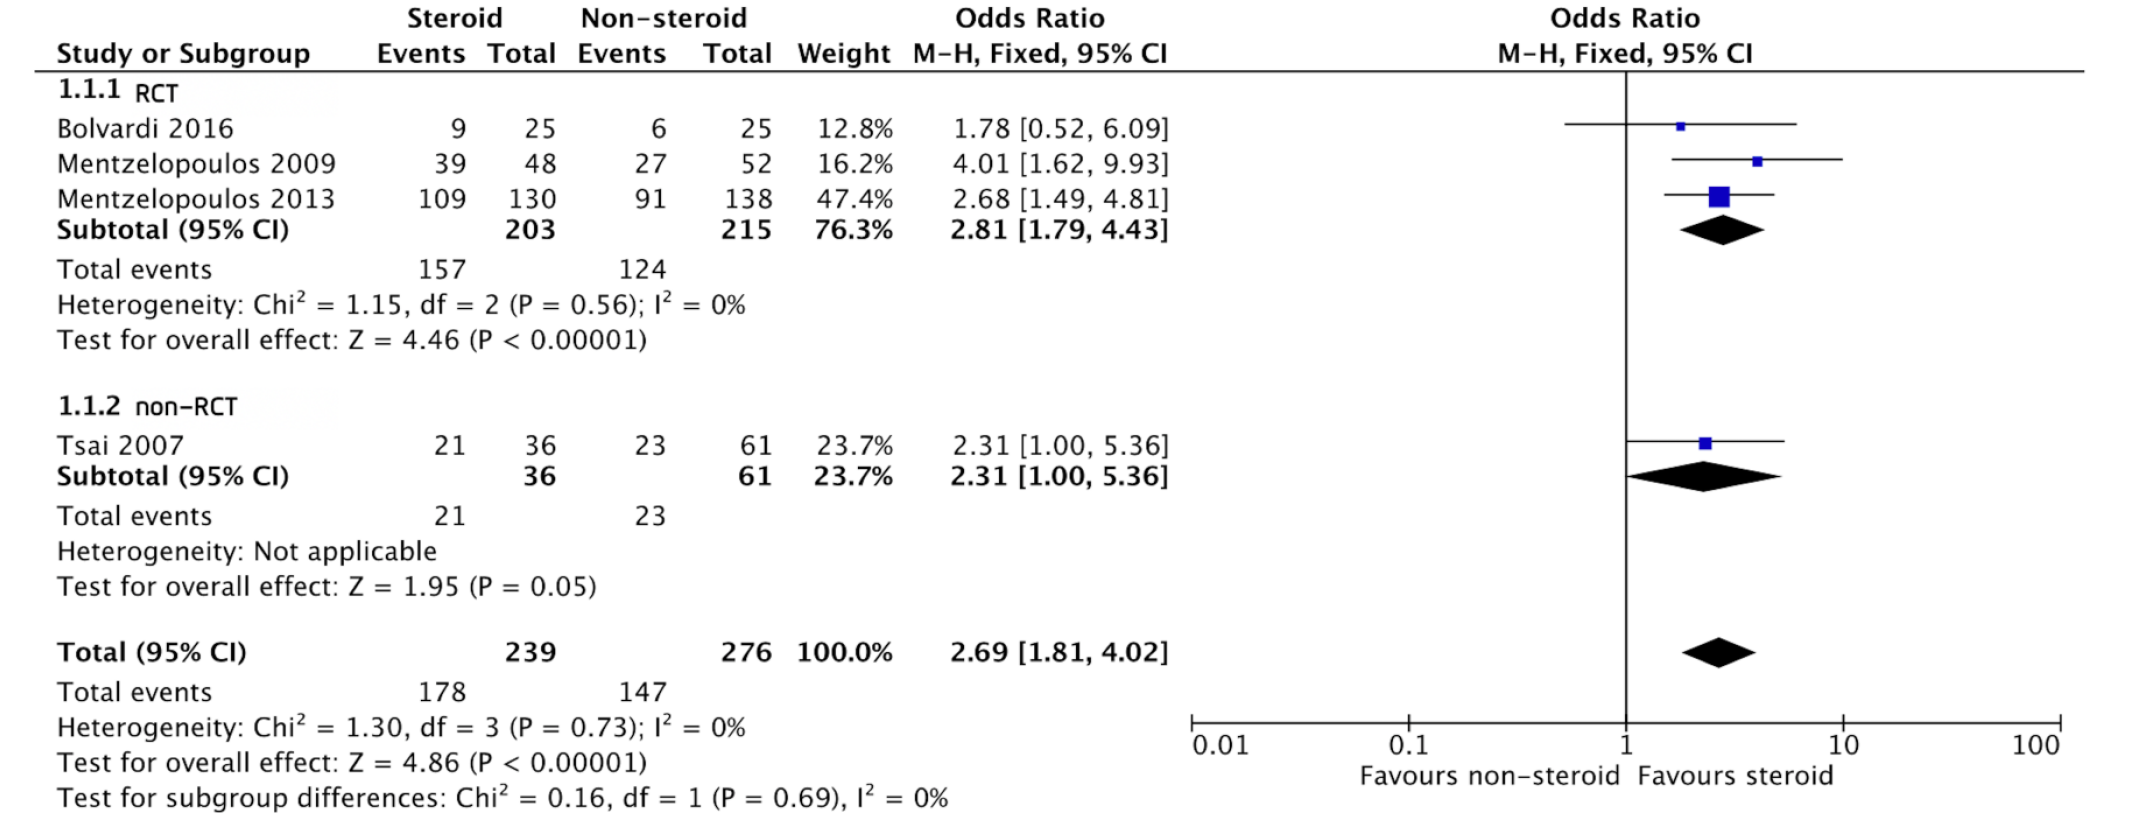
Figure 3 Forest plot comparing the odds ratios of the sustained return of spontaneous circulation.
RCT: Randomized-controlled trial; CI: Confidence interval.
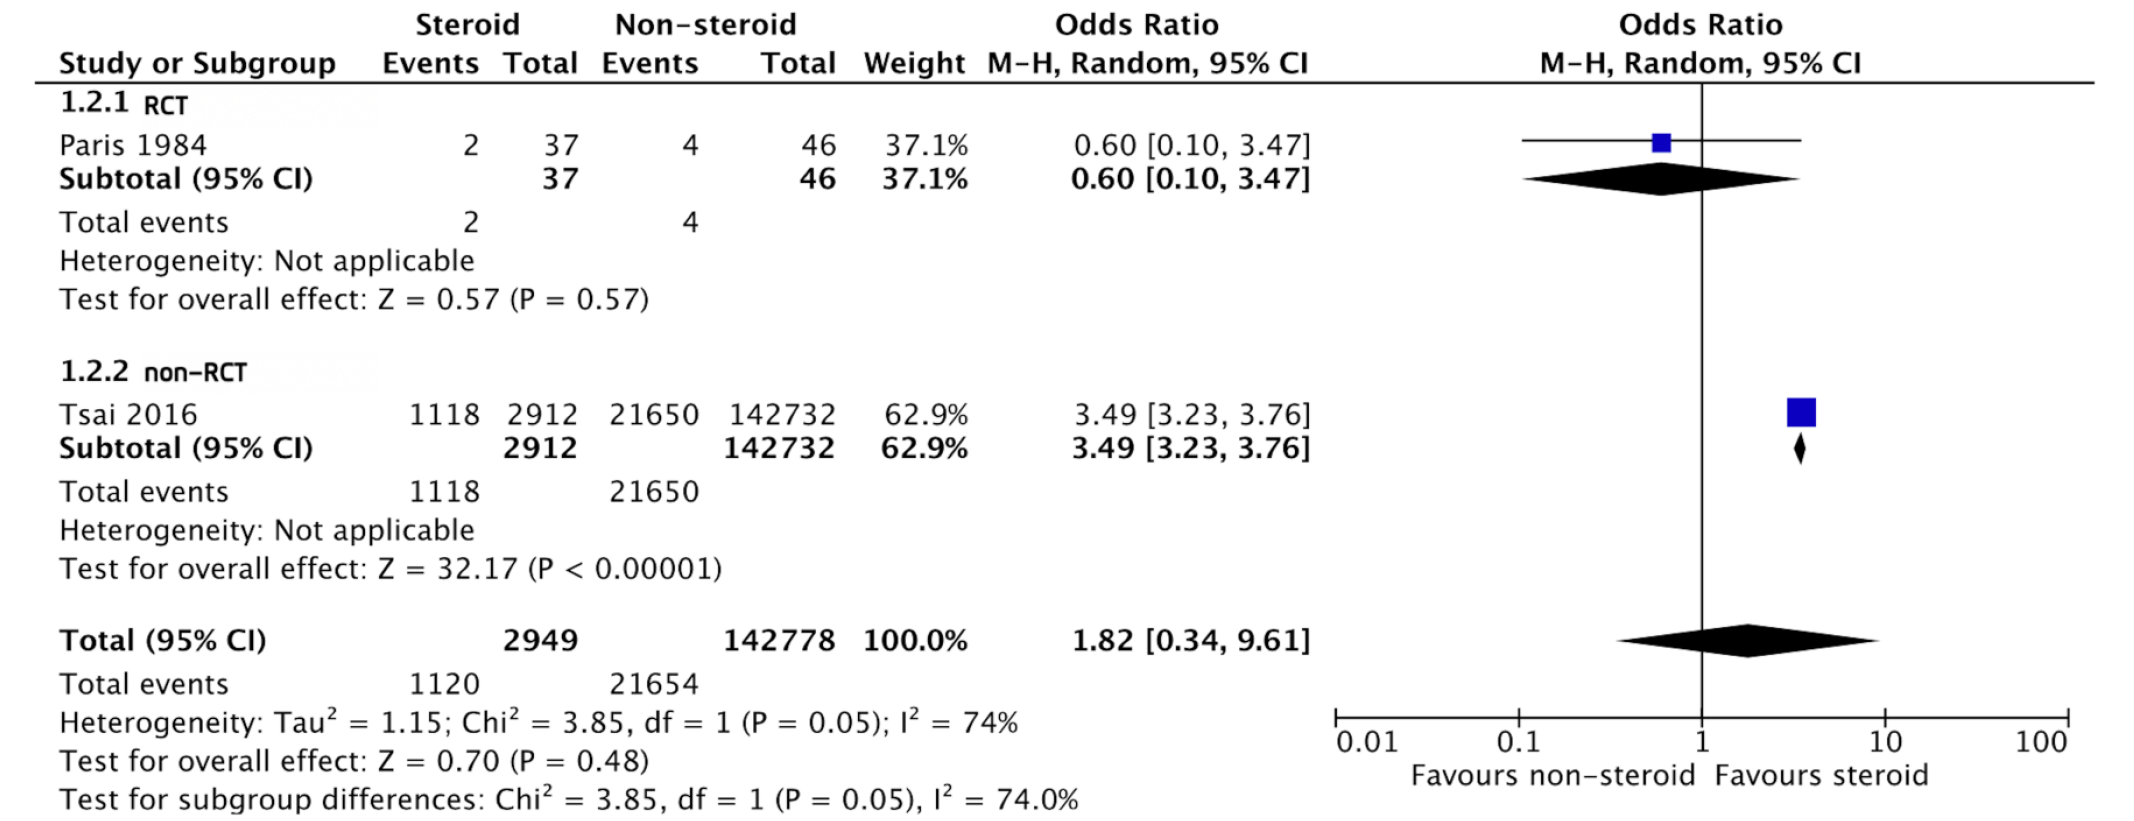
Figure 4 Forest plot comparing the odds ratios of survival at hospital admission.
RCT: Randomized-controlled trial; CI: Confidence interval.
Figure 5 Forest plot comparing the odds ratios of favorable neurological outcome at hospital discharge.
RCT: Randomized-controlled trial; CI: Confidence interval.
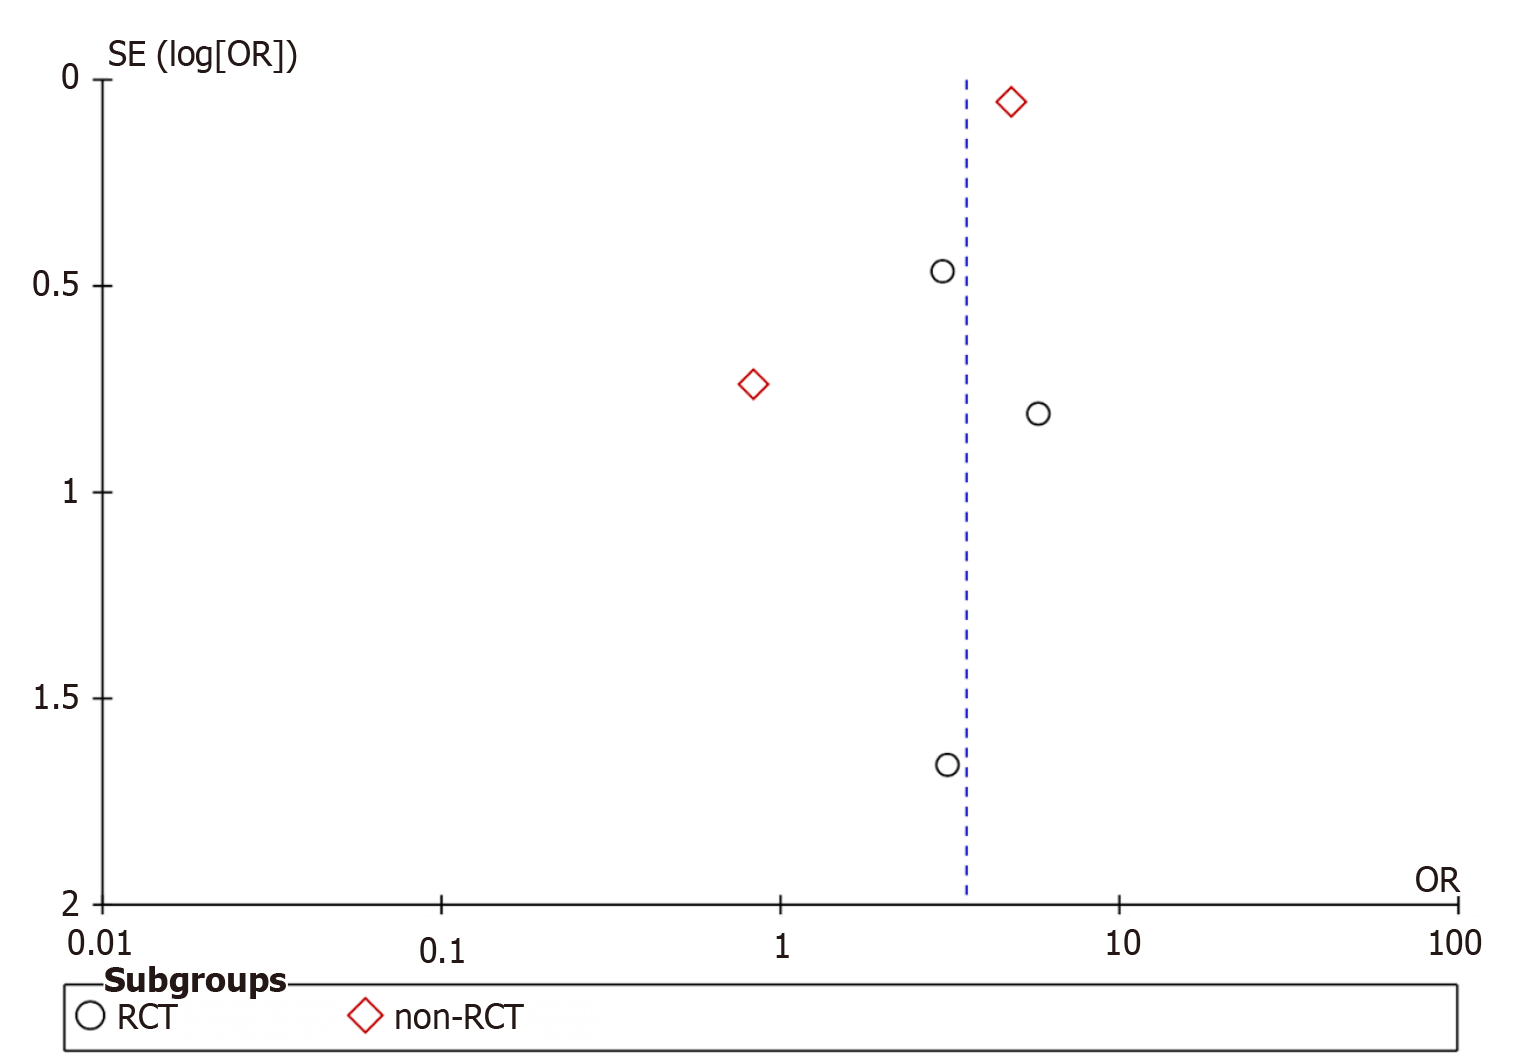
Figure 6 Funnel plot of steroid administration and survival at hospital discharge.
OR: Odds ratio; RCT: Randomized-controlled trial.
- Citation: Wongtanasarasin W, Krintratun S. Clinical benefits of corticosteroid administration during adult cardiopulmonary resuscitation: A systemic review and meta-analysis. World J Crit Care Med 2021; 10(5): 290-300
- URL: https://www.wjgnet.com/2220-3141/full/v10/i5/290.htm
- DOI: https://dx.doi.org/10.5492/wjccm.v10.i5.290


