
















Copyright: ©Author(s) 2026.
World J Clin Pediatr. Sep 9, 2026; 15(3): 121926
Published online Sep 9, 2026. doi: 10.5409/wjcp.v15.i3.121926
Published online Sep 9, 2026. doi: 10.5409/wjcp.v15.i3.121926
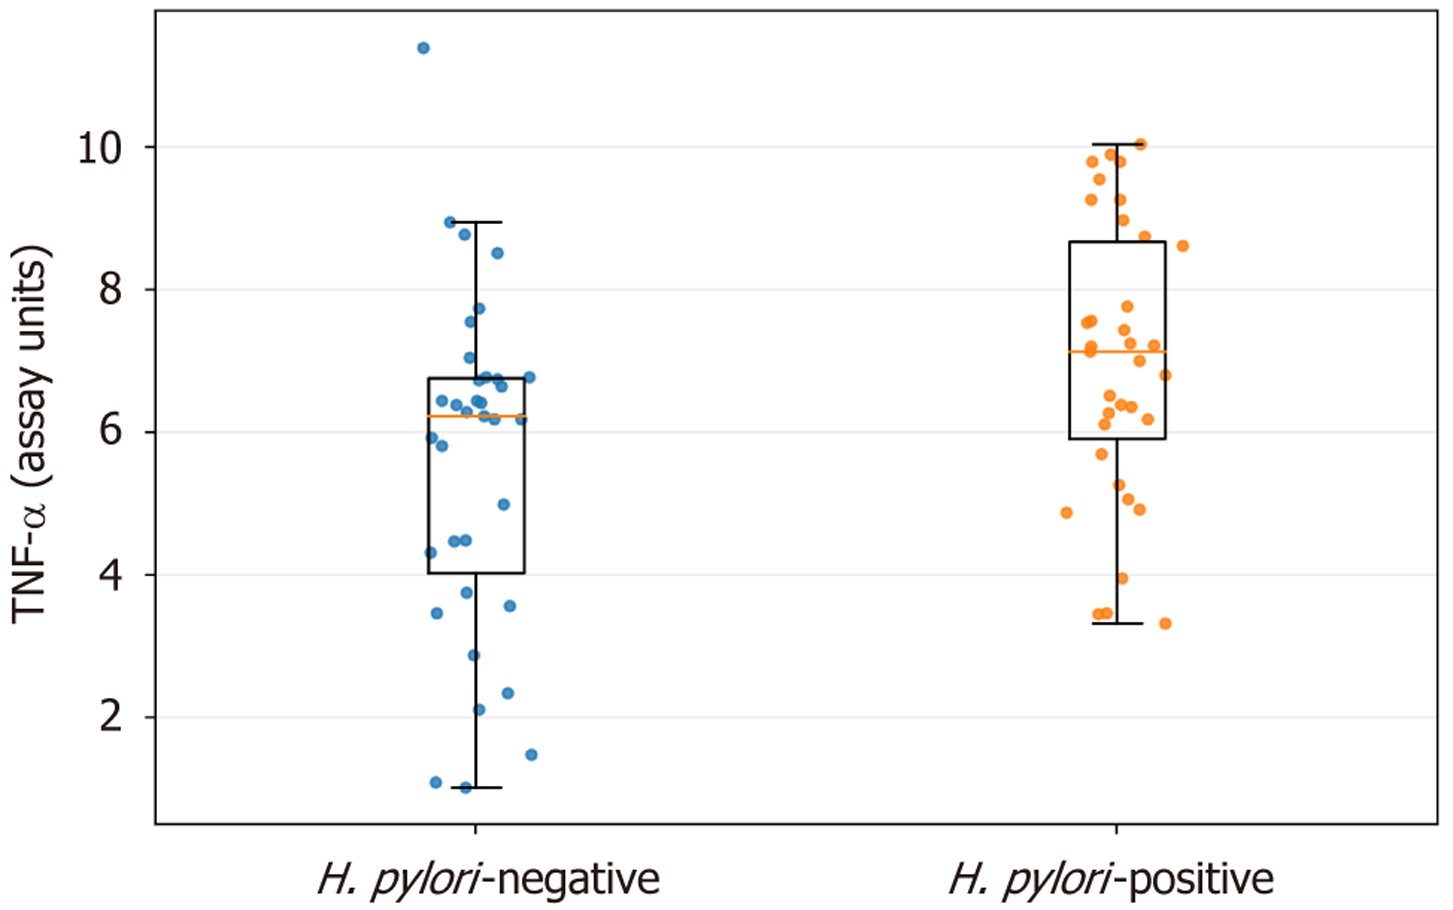
Figure 1 Serum tumor necrosis factor-alpha levels by Helicobacter pylori infection status among obese children with a metabolic syndrome phenotype.
Box plots depict the median (center line), interquartile range (box), and whiskers (1.5 × interquartile range), with individual participant values overlaid. Tumor necrosis factor-alpha levels were significantly higher in the Helicobacter pylori (H. pylori)-positive group compared with the H. pylori-negative group (Mann-Whitney U test, P = 0.011). H. pylori: Helicobacter pylori; TNF-α: Tumor necrosis factor-alpha.
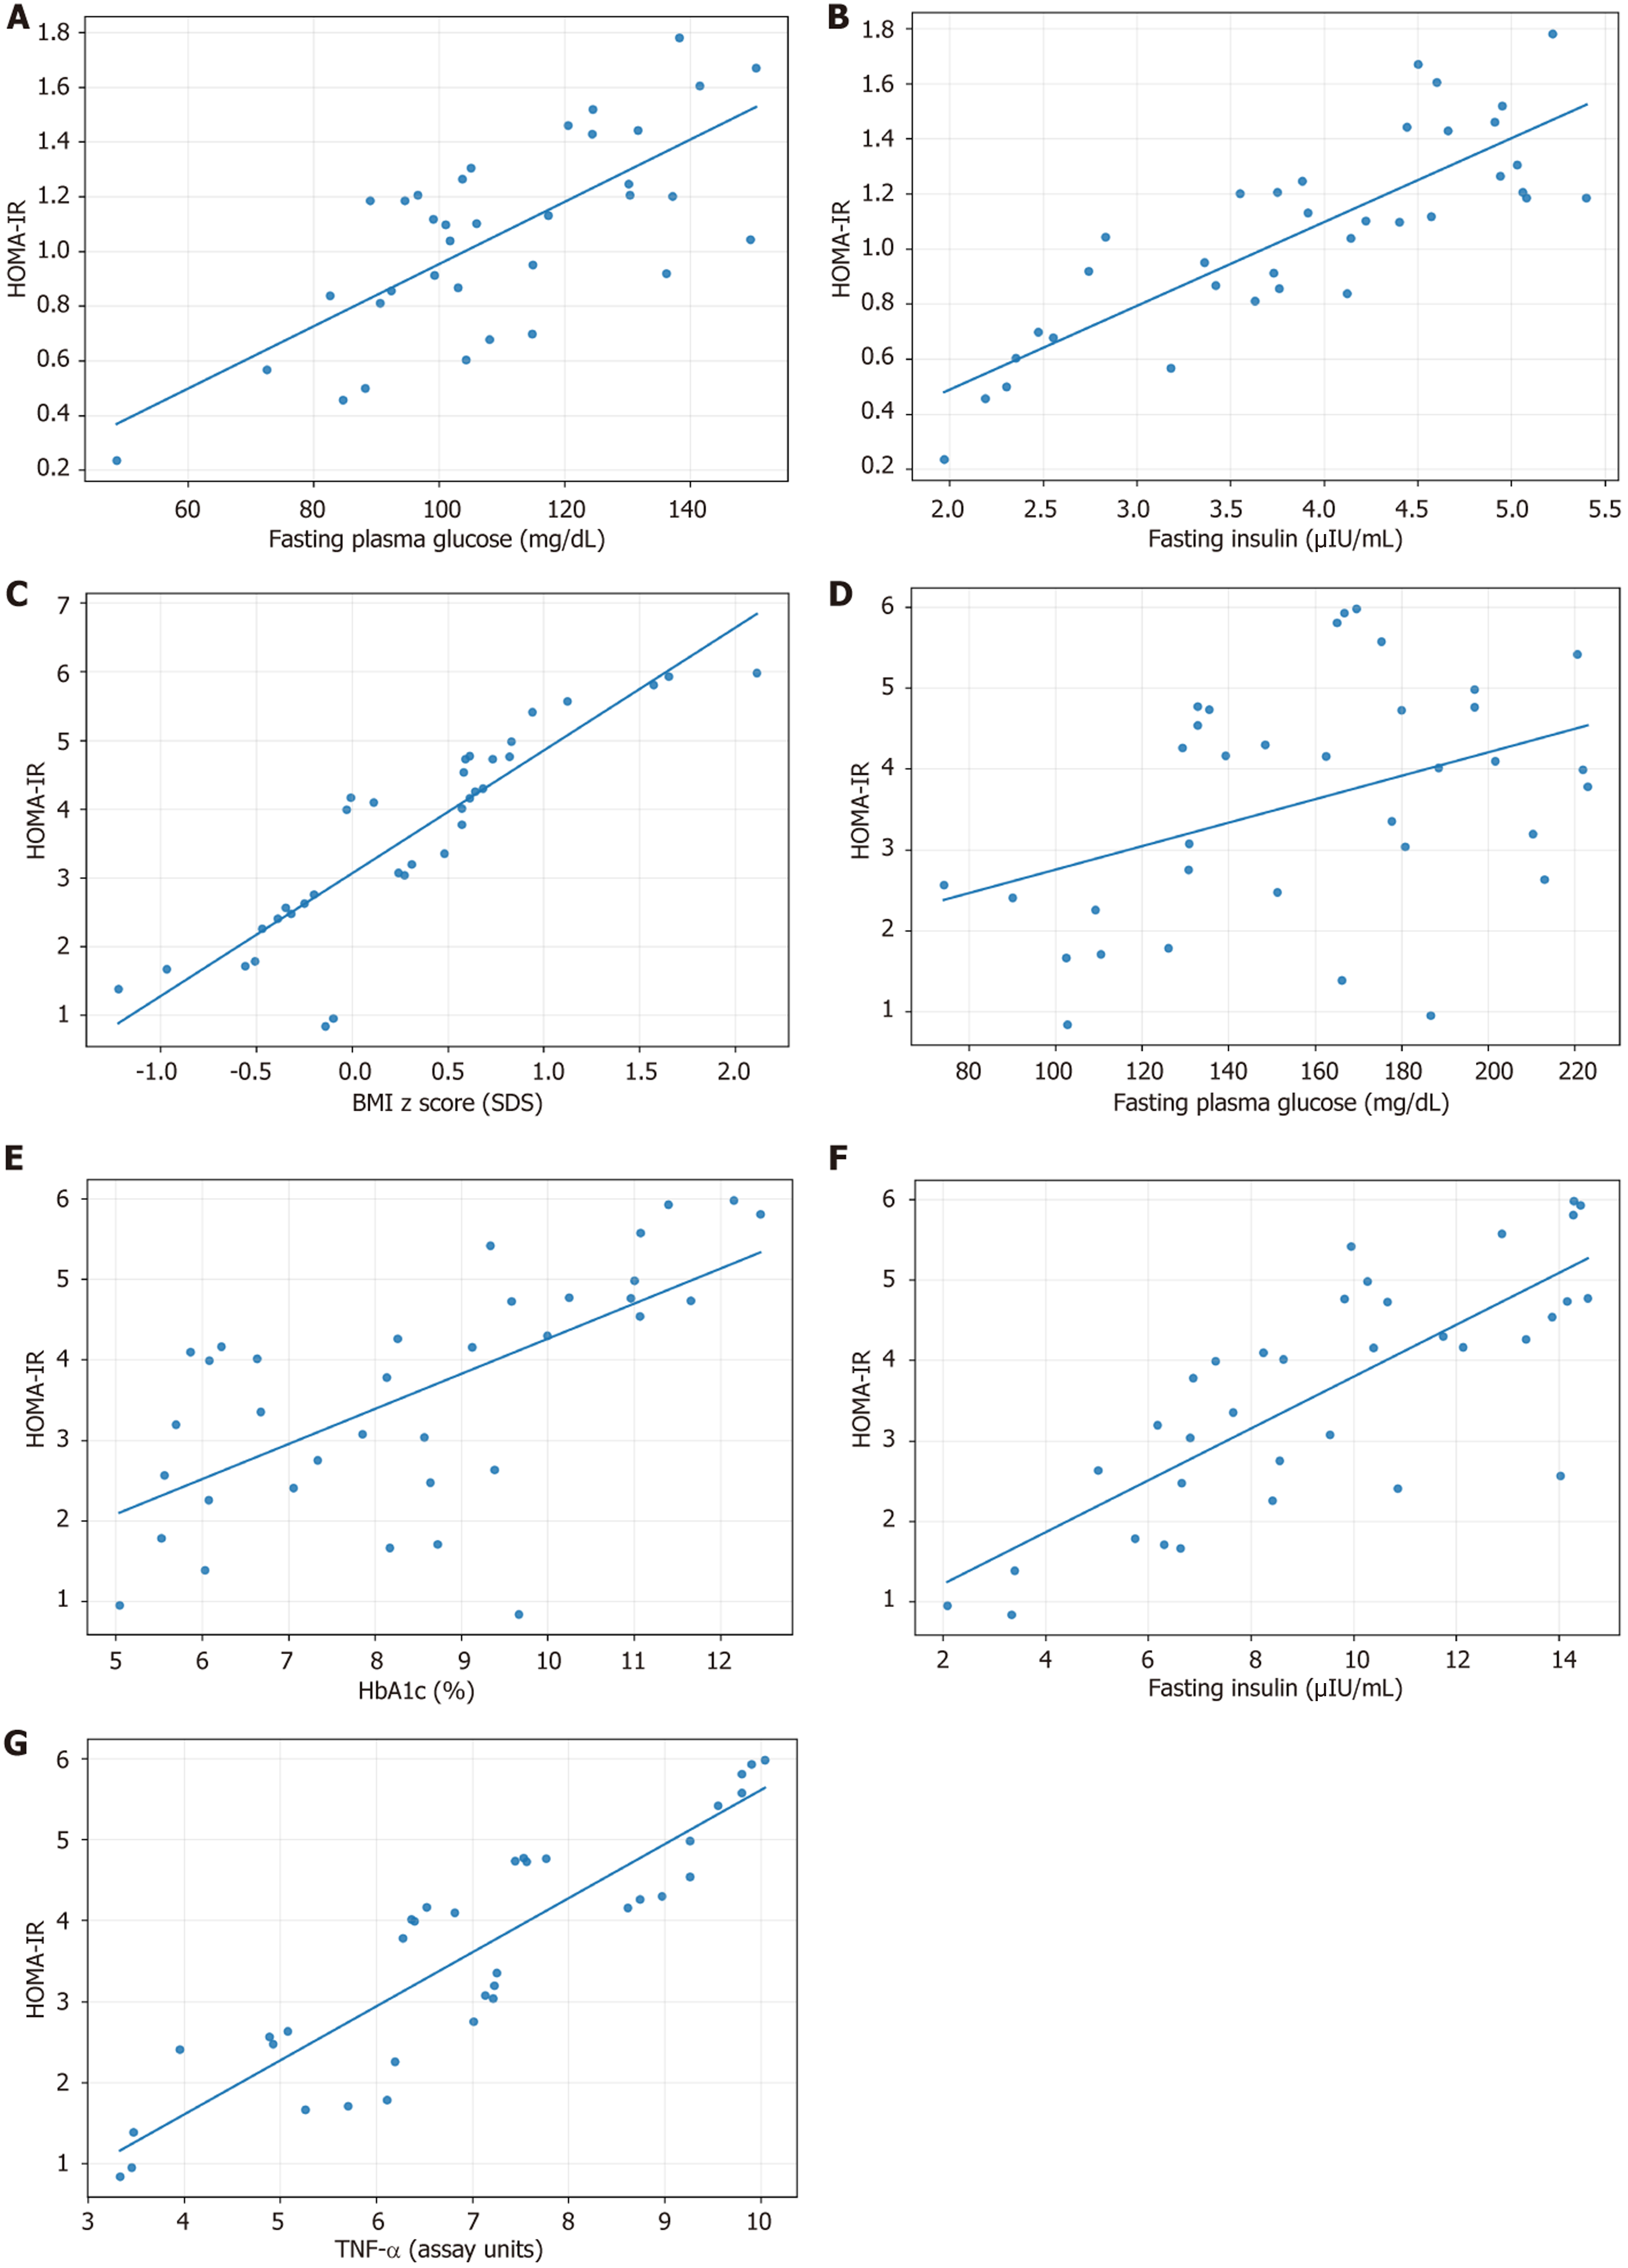
Figure 2 Scatter diagram.
A: Association between homeostasis model assessment of insulin resistance and fasting plasma glucose in the Helicobacter pylori(H. pylori) -negative group. A strong positive correlation was observed (Pearson r = 0.716, P < 0.001); B: Association between homeostasis model assessment of insulin resistance (HOMA-IR) and fasting insulin in the H. pylori-negative group. A strong positive correlation was observed (Pearson r = 0.833, P < 0.001); C: Association between HOMA-IR and standardized body mass index (BMI) value in the H. pylori-positive group. Scatter plot with fitted linear regression line showing a strong positive correlation between HOMA-IR and standardized BMI value (Pearson r = 0.889, P < 0.001); D: Association between HOMA-IR and fasting plasma glucose in the H. pylori-positive group. A moderate positive correlation was observed (Pearson r = 0.401, P = 0.017); E: Association between HOMA-IR and glycated hemoglobin (HbA1c) in the H. pylori-positive group. HOMA-IR correlated positively with HbA1c (Pearson r = 0.653, P < 0.001); F: Association between HOMA-IR and fasting insulin in the H. pylori-positive group. A strong positive correlation was observed (Pearson r = 0.788, P < 0.001); G: Association between HOMA-IR and tumor necrosis factor-alpha in the H. pylori-positive group. A strong positive correlation was observed (Pearson r = 0.896, P < 0.001). H. pylori: Helicobacter pylori; HOMA-IR: Homeostasis model assessment of insulin resistance; BMI: Body mass index; HbA1c: Glycated hemoglobin.
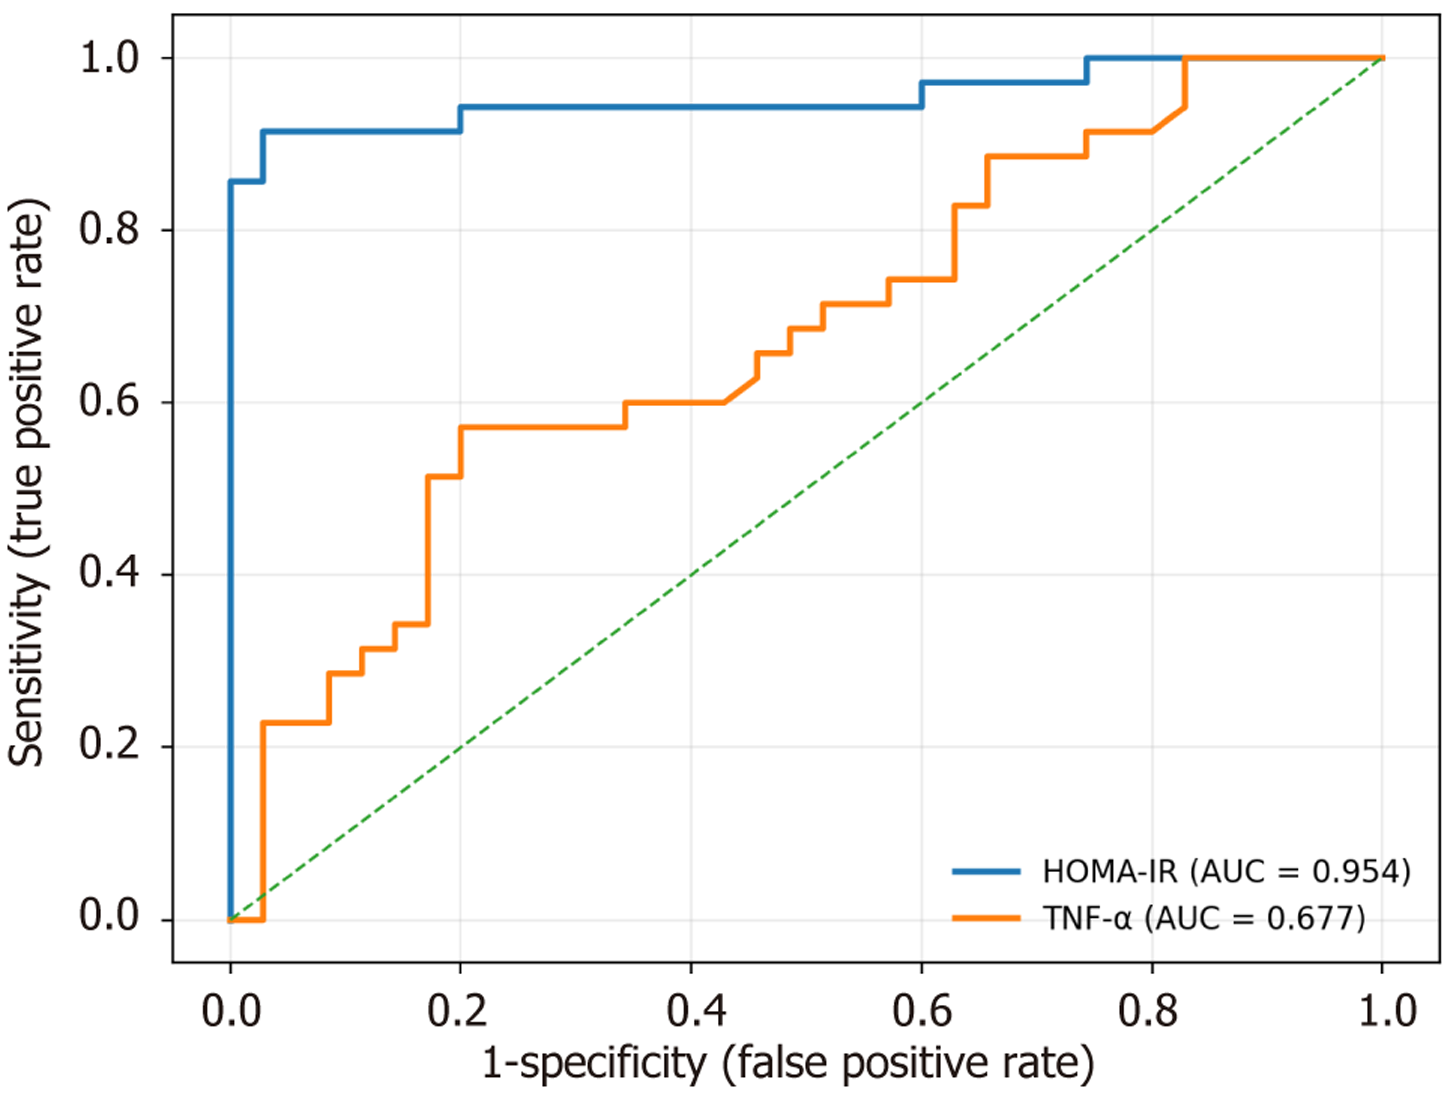
Figure 3 Receiver operating characteristic curves of homeostasis model assessment of insulin resistance and tumor necrosis factor-alpha for discrimination of Helicobacter pylori infection.
Homeostasis model assessment of insulin resistance demonstrated excellent discrimination [area under the curve (AUC) = 0.954], while tumor necrosis factor-alpha showed moderate discrimination (AUC = 0.677). The diagonal dashed line represents non-discrimination. HOMA-IR: Homeostasis model assessment of insulin resistance; AUC: Area under the curve; TNF-α: Tumor necrosis factor-alpha.
- Citation: Ibrahim Elbakry NM, Hemeda MS, Mostafa Mohamed Ahmed A, Adel Zaky H, Gamil AN, Arafat Abd Elmoaty AE, M Khafagi M, Mohamed Alkabeer A, Abd Elaziz Alsaid A, A Elhagary A, Mohammed Aboassy W, Nabil Gamil Mohammed A. Association of Helicobacter pylori infection with insulin resistance, tumor necrosis factor-alpha, and dyslipidemia in obese children with metabolic syndrome. World J Clin Pediatr 2026; 15(3): 121926
- URL: https://www.wjgnet.com/2219-2808/full/v15/i3/121926.htm
- DOI: https://dx.doi.org/10.5409/wjcp.v15.i3.121926