
















Copyright: ©Author(s) 2026.
World J Clin Pediatr. Sep 9, 2026; 15(3): 119386
Published online Sep 9, 2026. doi: 10.5409/wjcp.119386
Published online Sep 9, 2026. doi: 10.5409/wjcp.119386
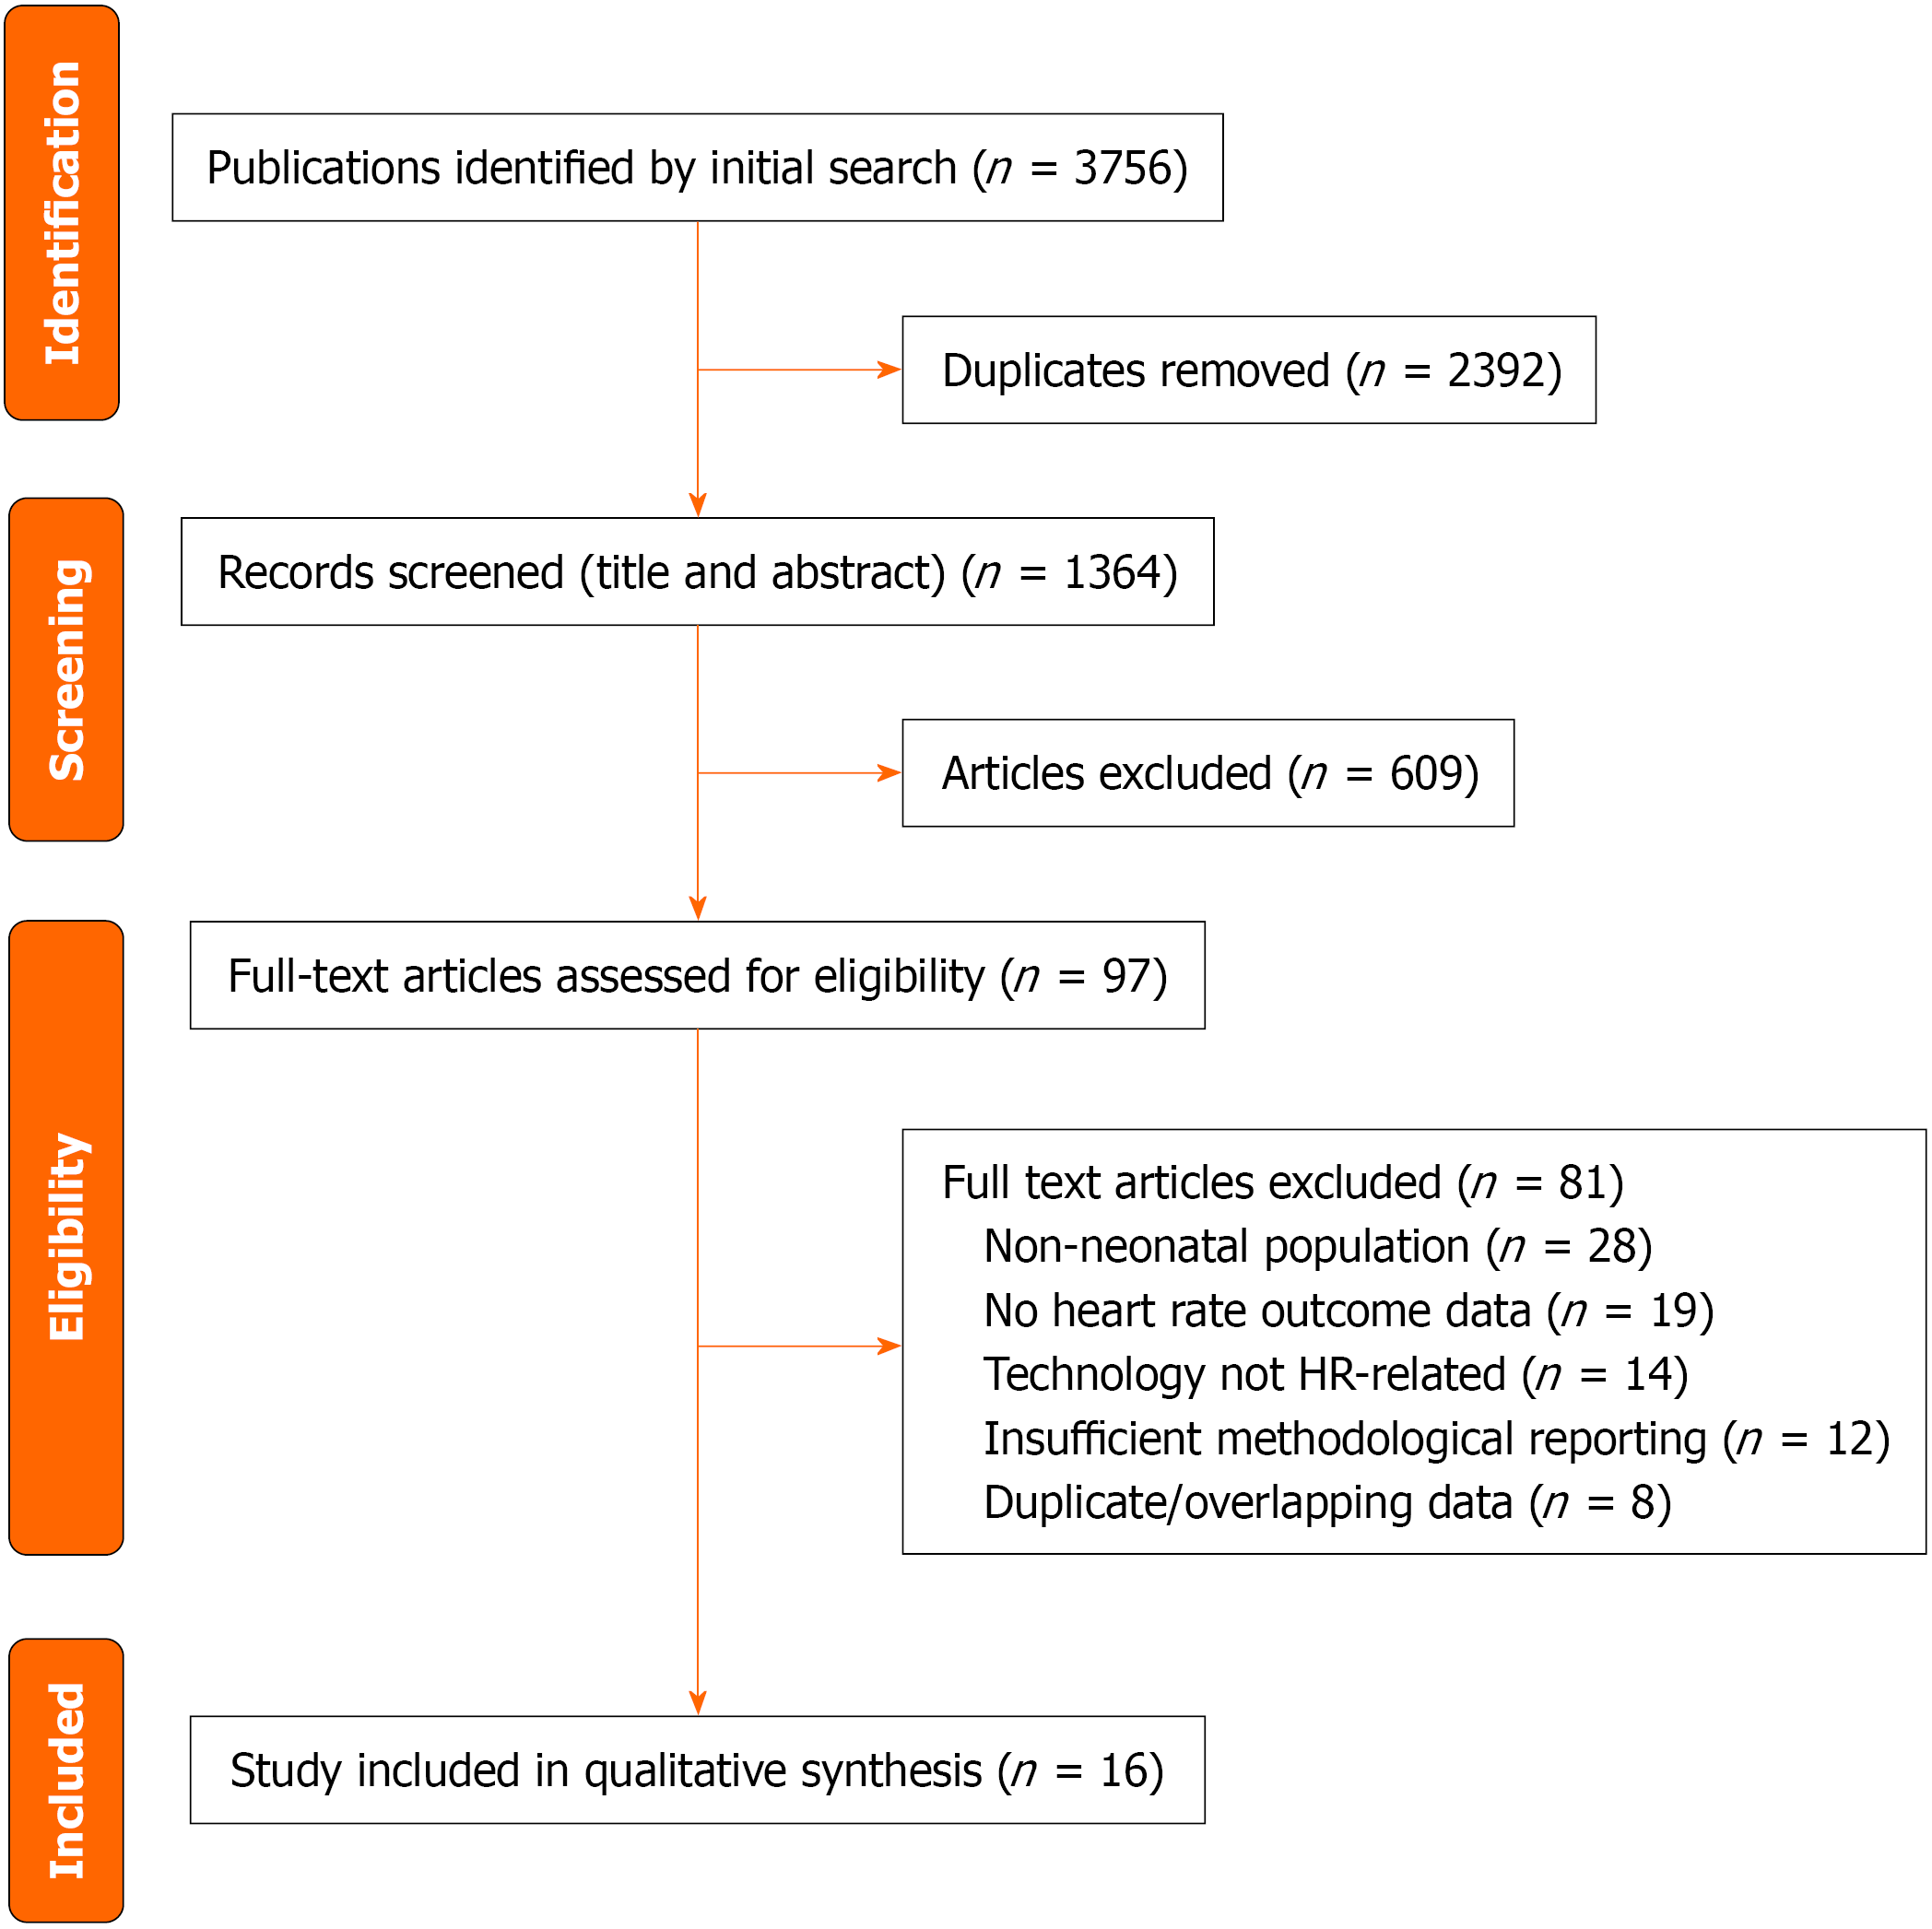
Figure 1 PRISMA flow diagram illustrating the study selection process for the systematic review.
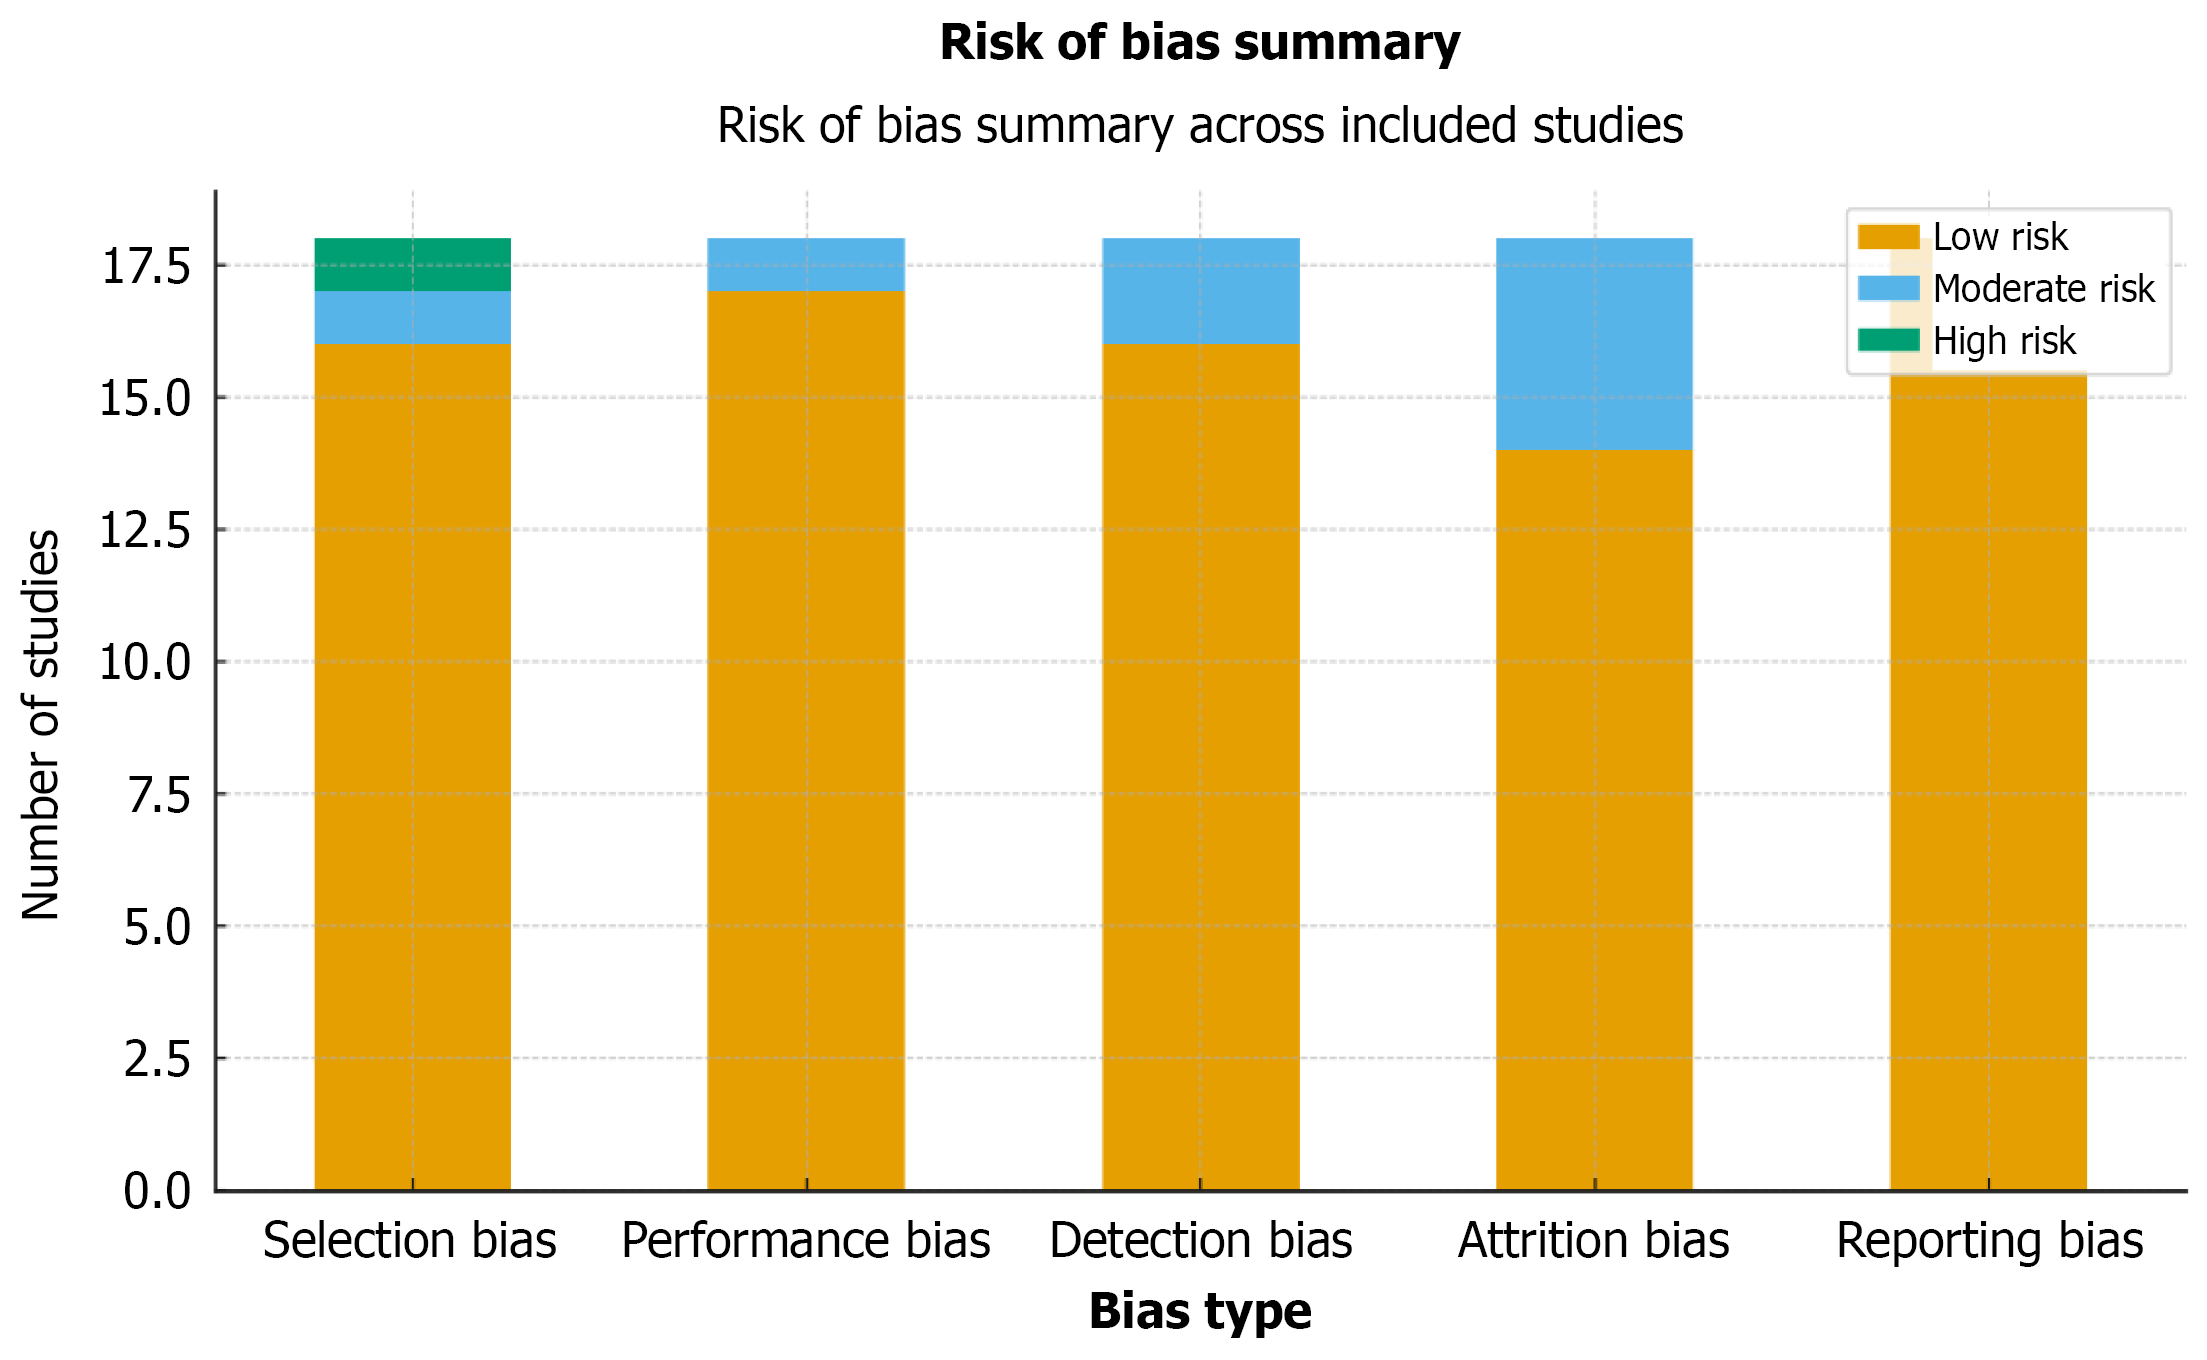
Figure 2 Risk of bias summary.
Domains evaluated included selection, performance, detection, attrition, and reporting bias. Orange, blue and green bars represent low, moderate, and high risk of bias, respectively.
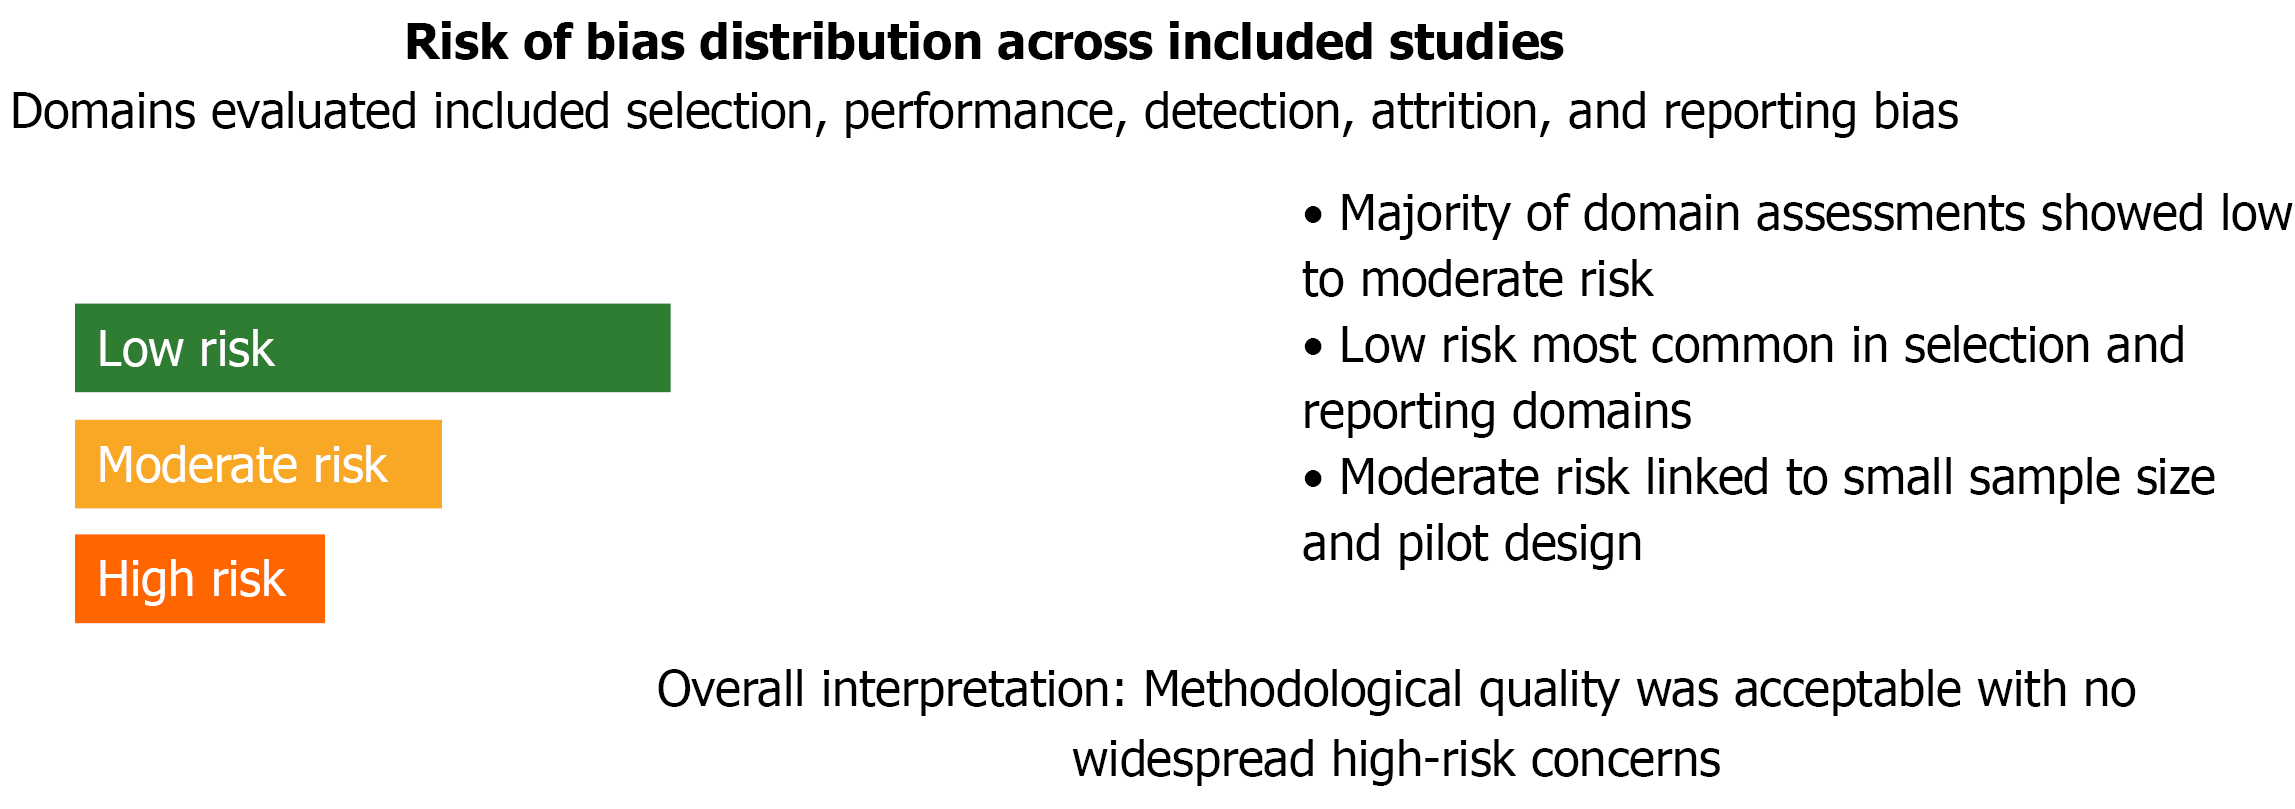
Figure 3 Intended figure showing the classification of neonatal heart-rate monitoring technologies.
- Citation: Soni P, Yadav MK, Kumar S, Bansal BK. Artificial intelligence-based neonatal heart rate monitoring technologies: Systematic review. World J Clin Pediatr 2026; 15(3): 119386
- URL: https://www.wjgnet.com/2219-2808/full/v15/i3/119386.htm
- DOI: https://dx.doi.org/10.5409/wjcp.119386