Copyright
©The Author(s) 2025.
World J Clin Pediatr. Dec 9, 2025; 14(4): 109022
Published online Dec 9, 2025. doi: 10.5409/wjcp.v14.i4.109022
Published online Dec 9, 2025. doi: 10.5409/wjcp.v14.i4.109022
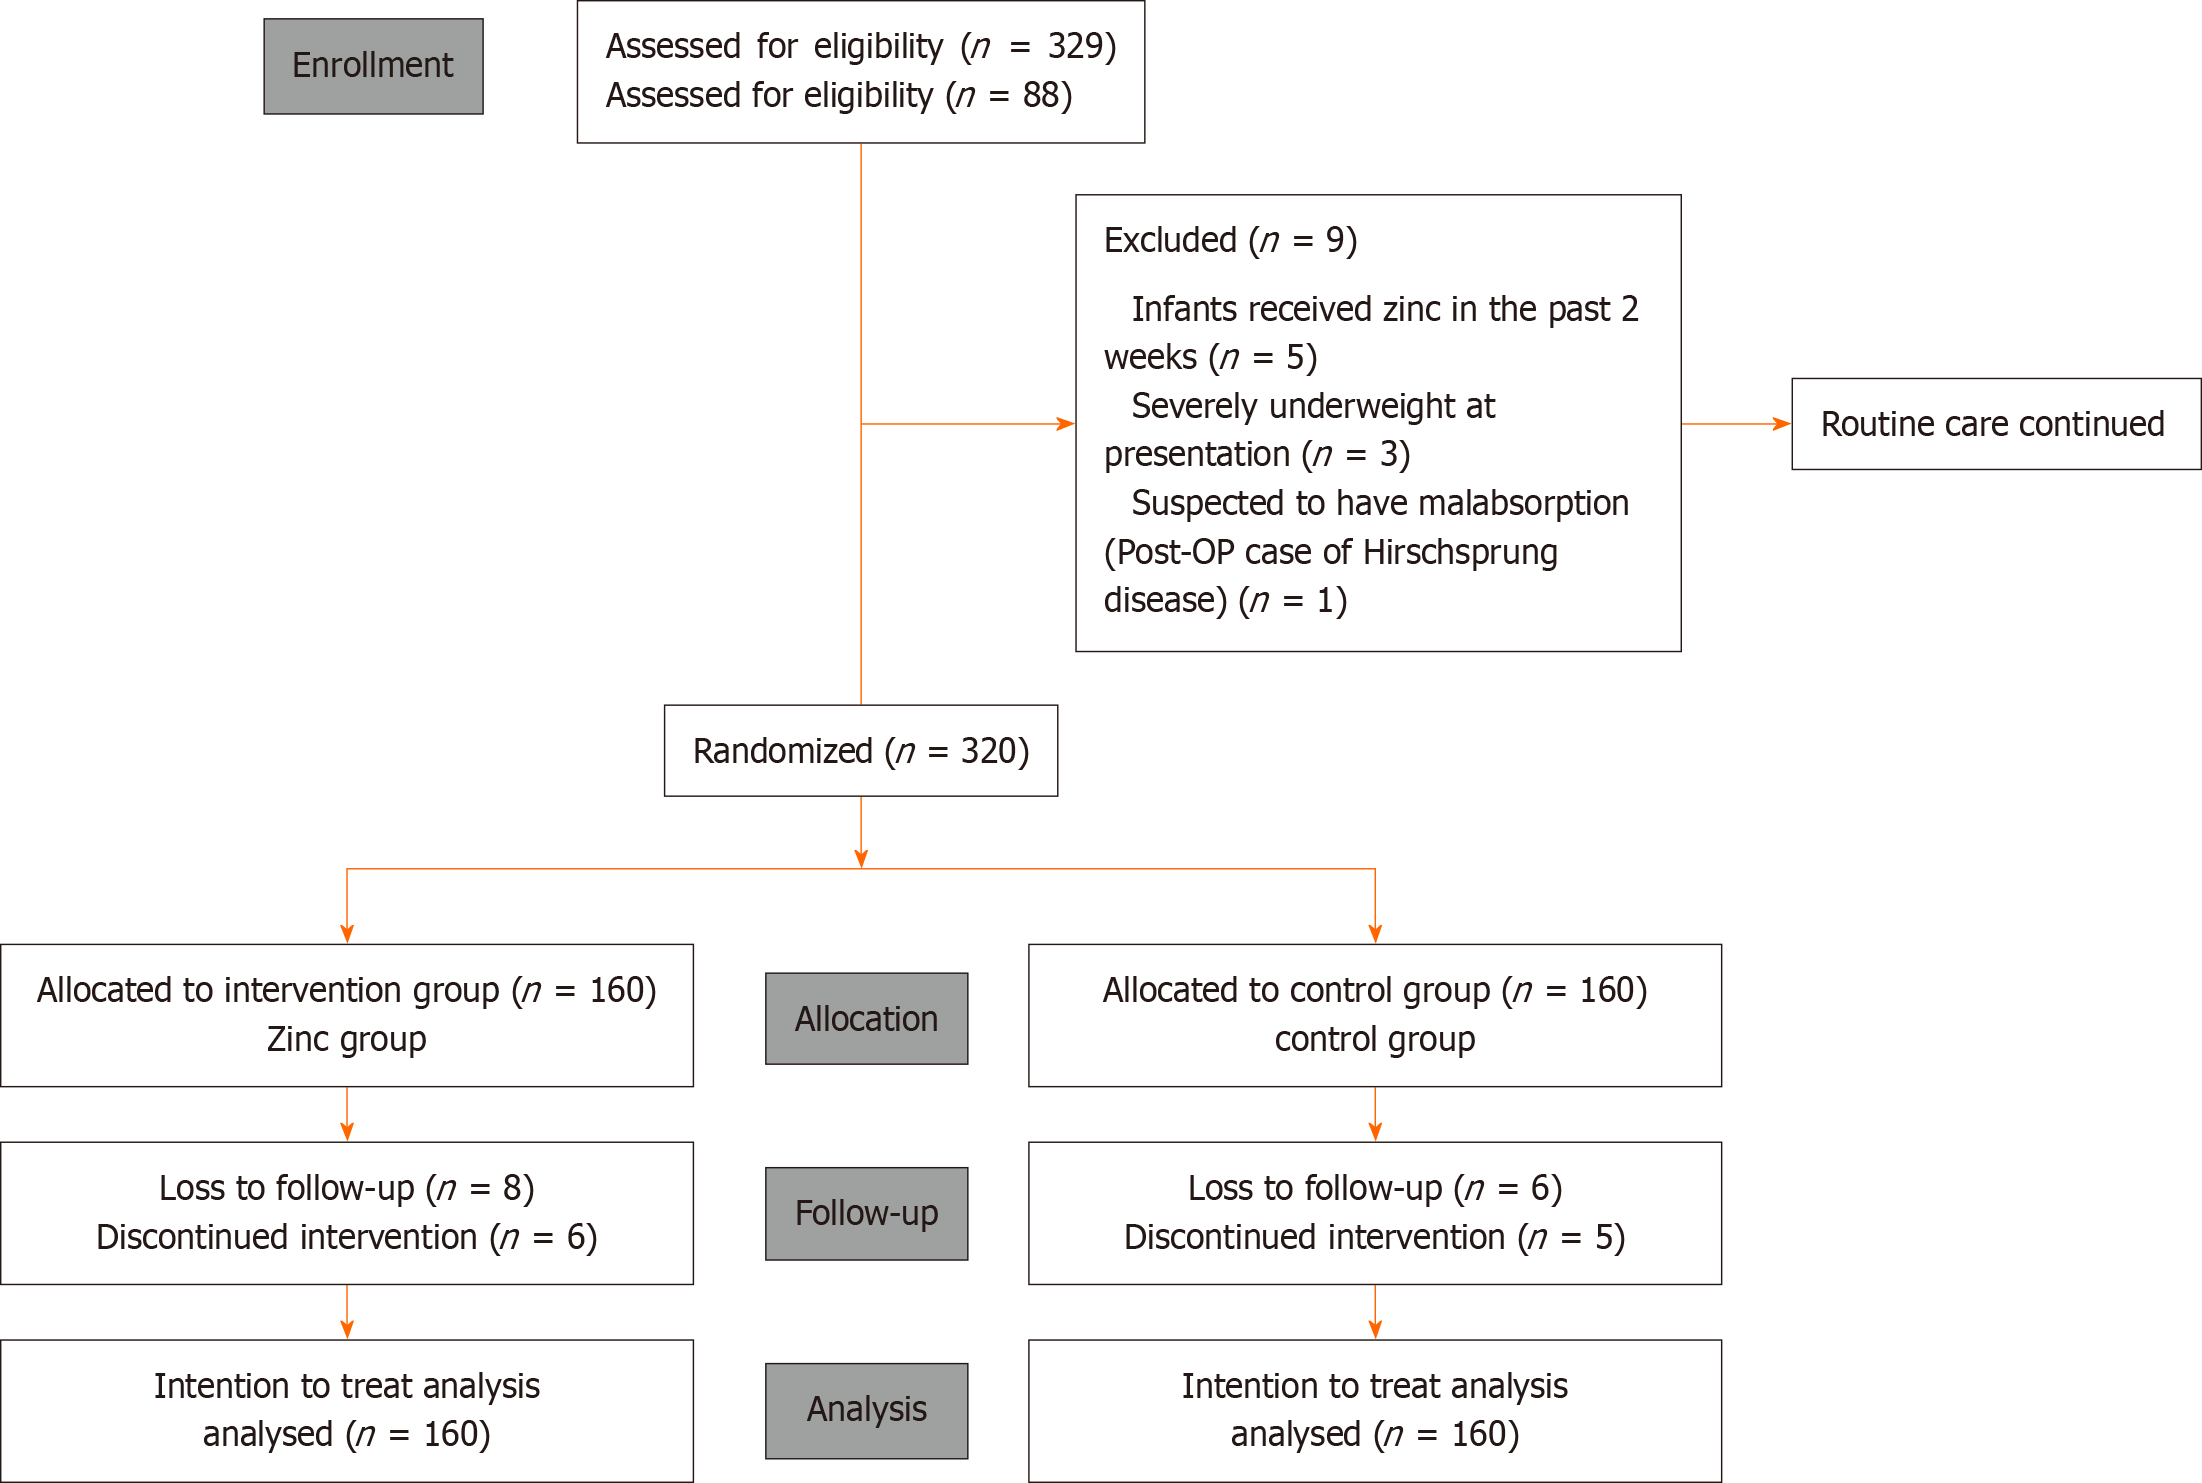
Figure 1 The CONSORT Flow diagram: Flow-chart showing inclusion, randomization and participation throughout the study.
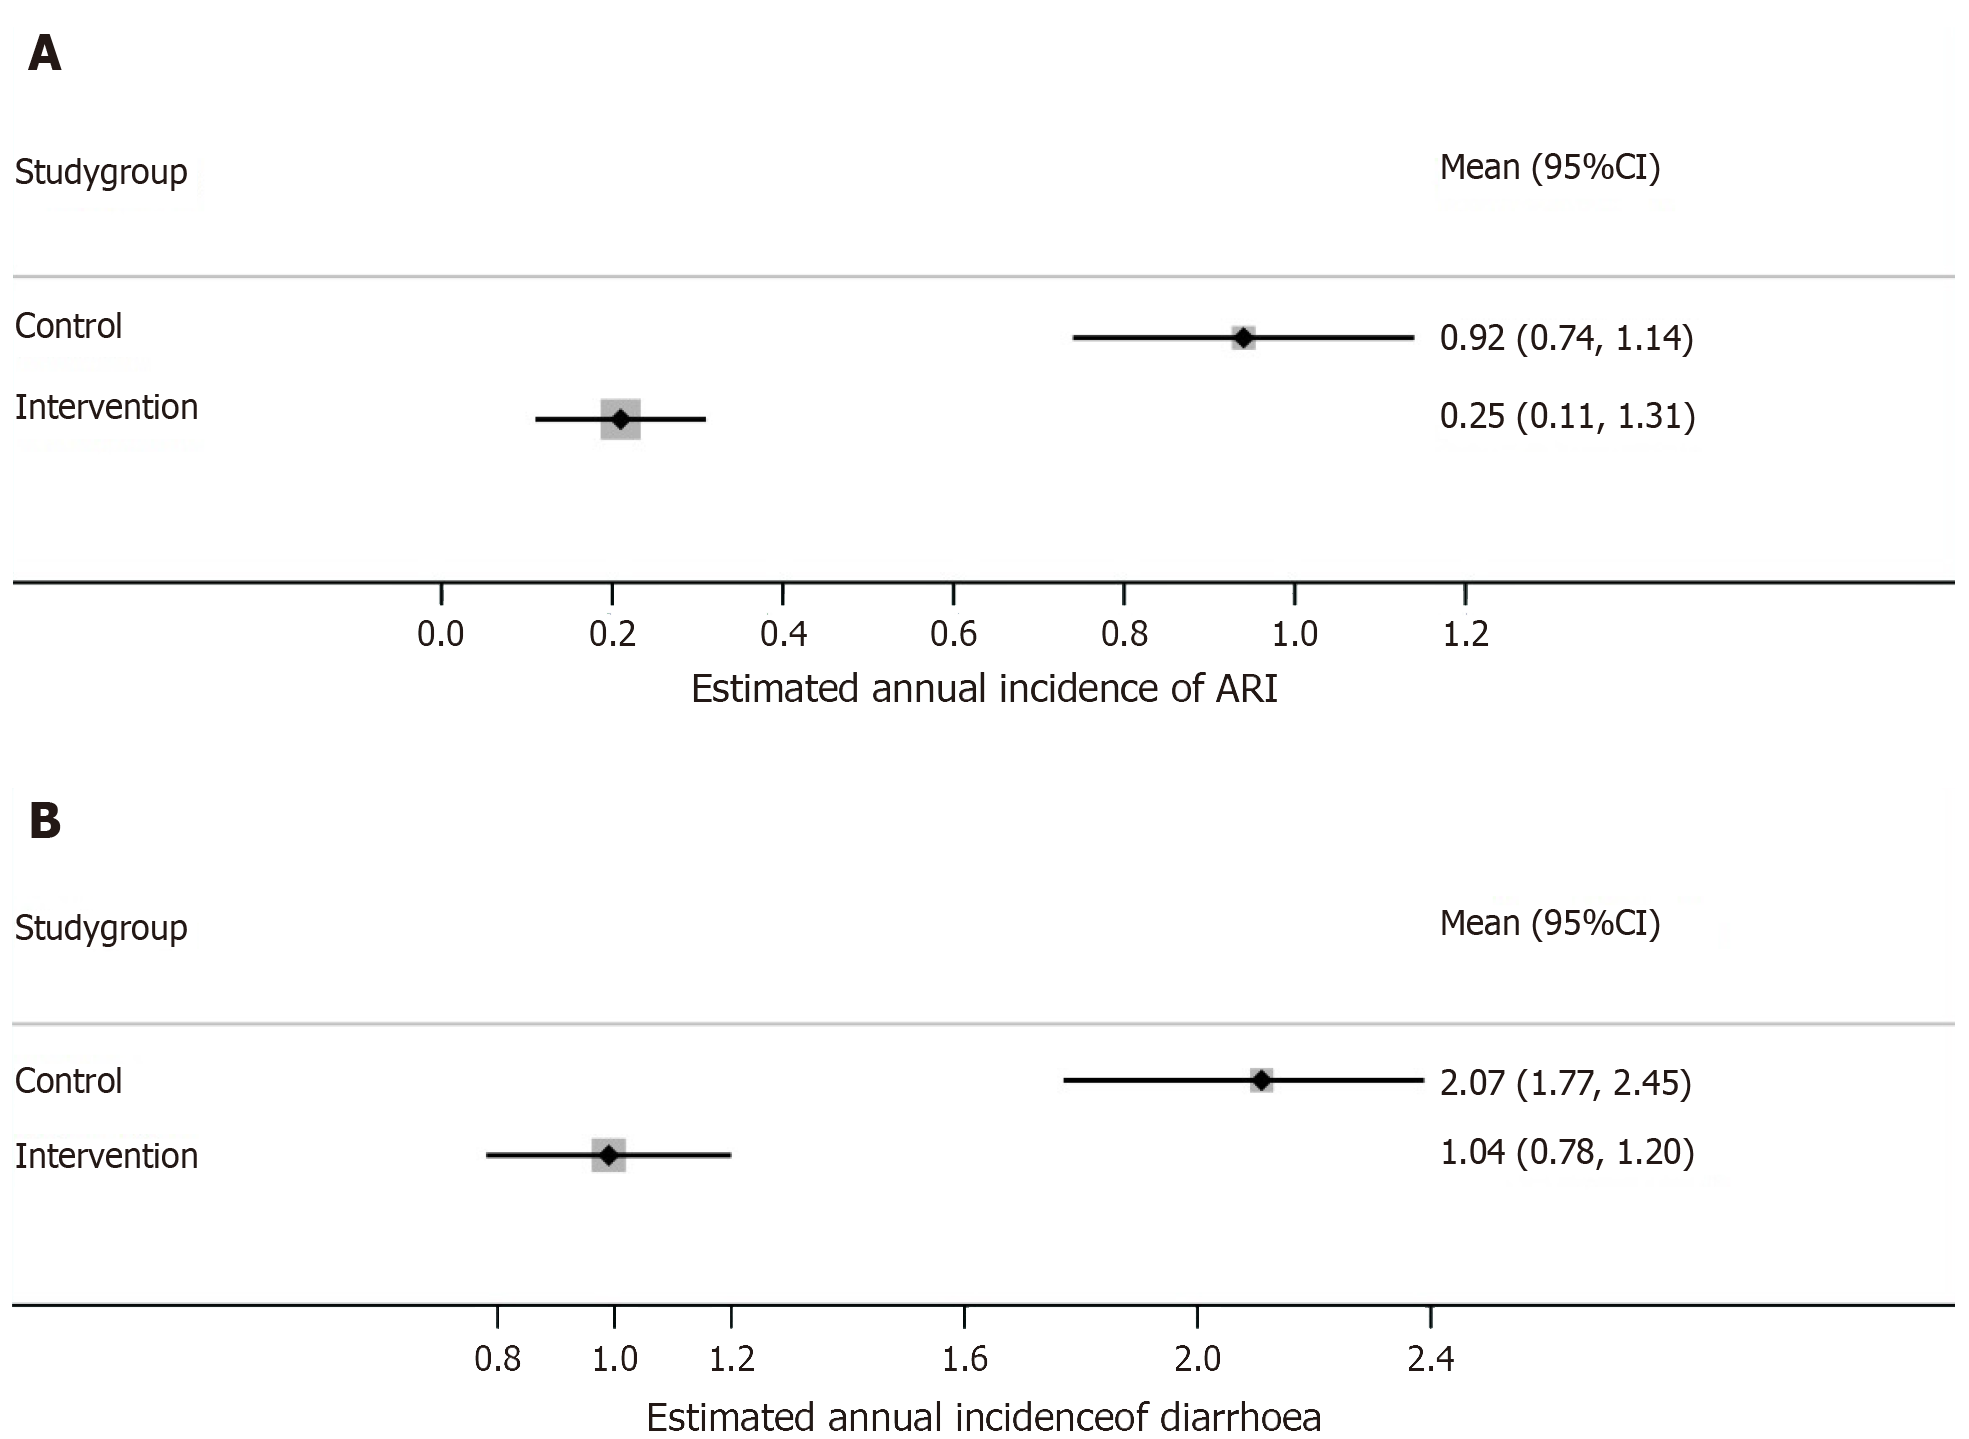
Figure 2 Forest plot.
A: Comparison of estimated mean annual incidence of acute respiratory infection across the study groups; B: Comparison of estimated mean annual incidence of acute diarrhoea across the study groups. ARI: Acute respiratory infection.
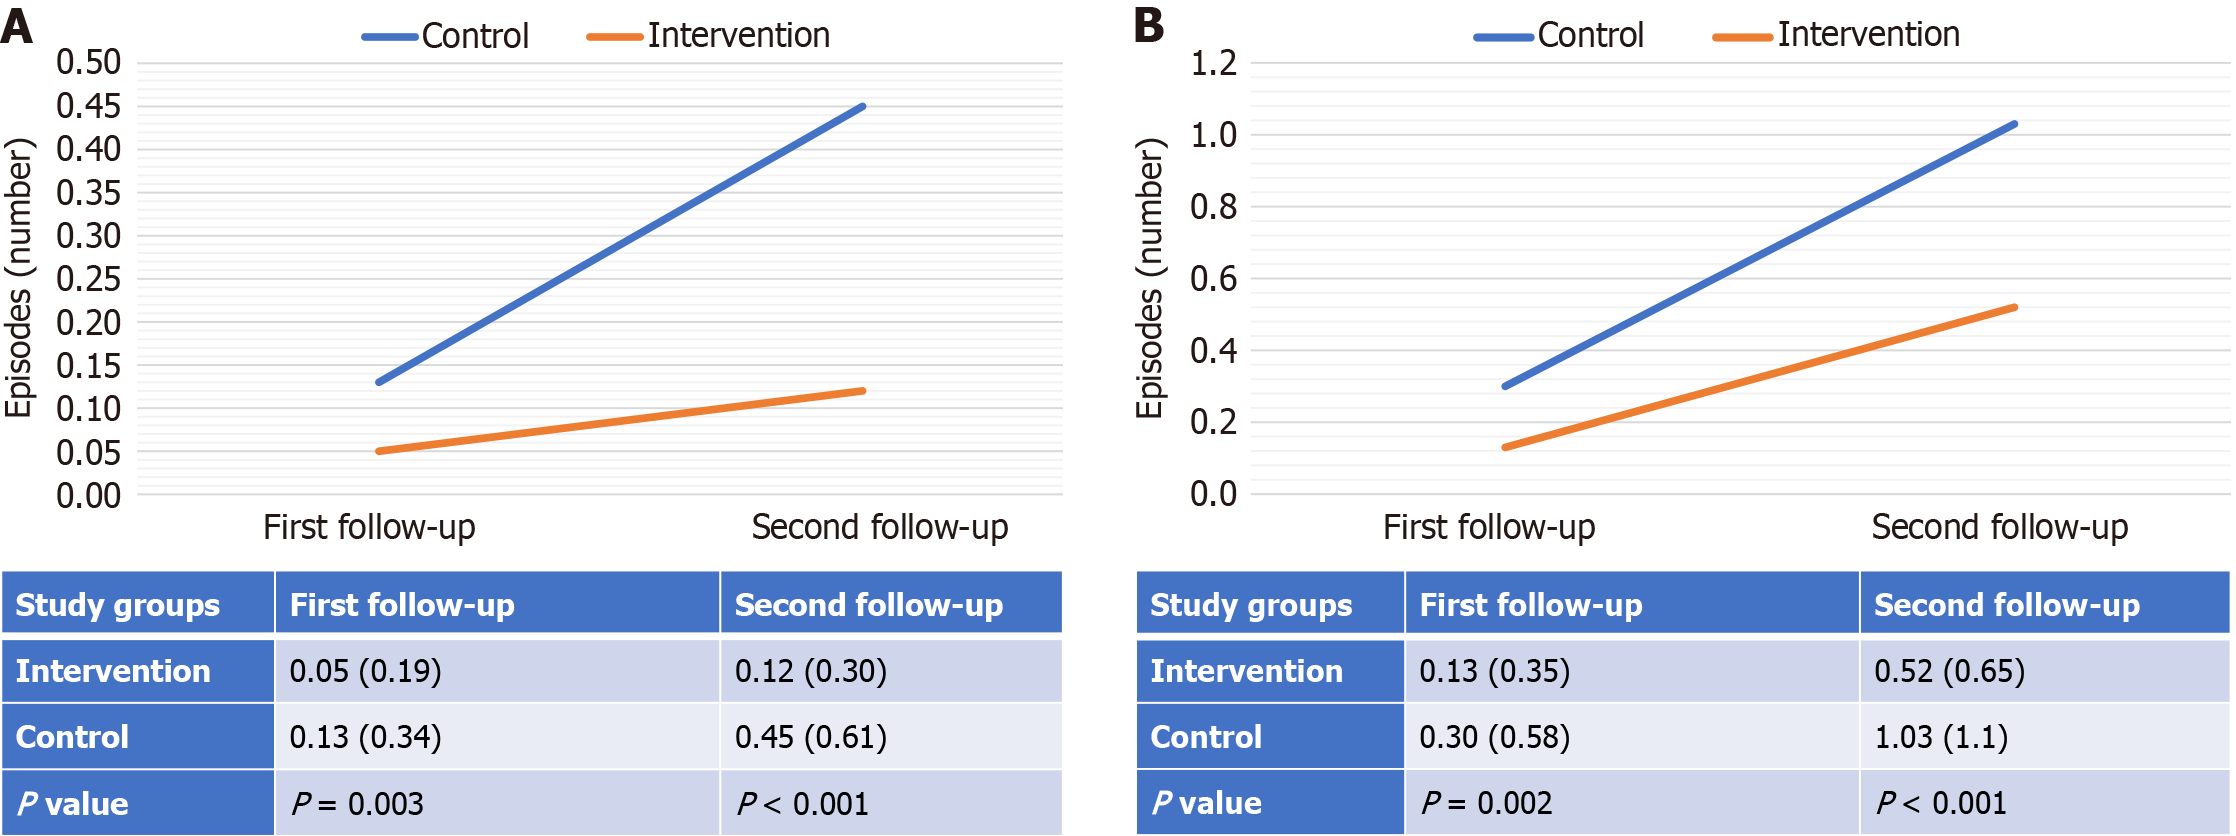
Figure 3 Trends of cumulative episodes of acute respiratory infection and acute diarrhoea over time across the study groups.
A: Trends of cumulative episodes of acute respiratory infection over time; B: Trends of cumulative episodes of acute diarrhoea over time.
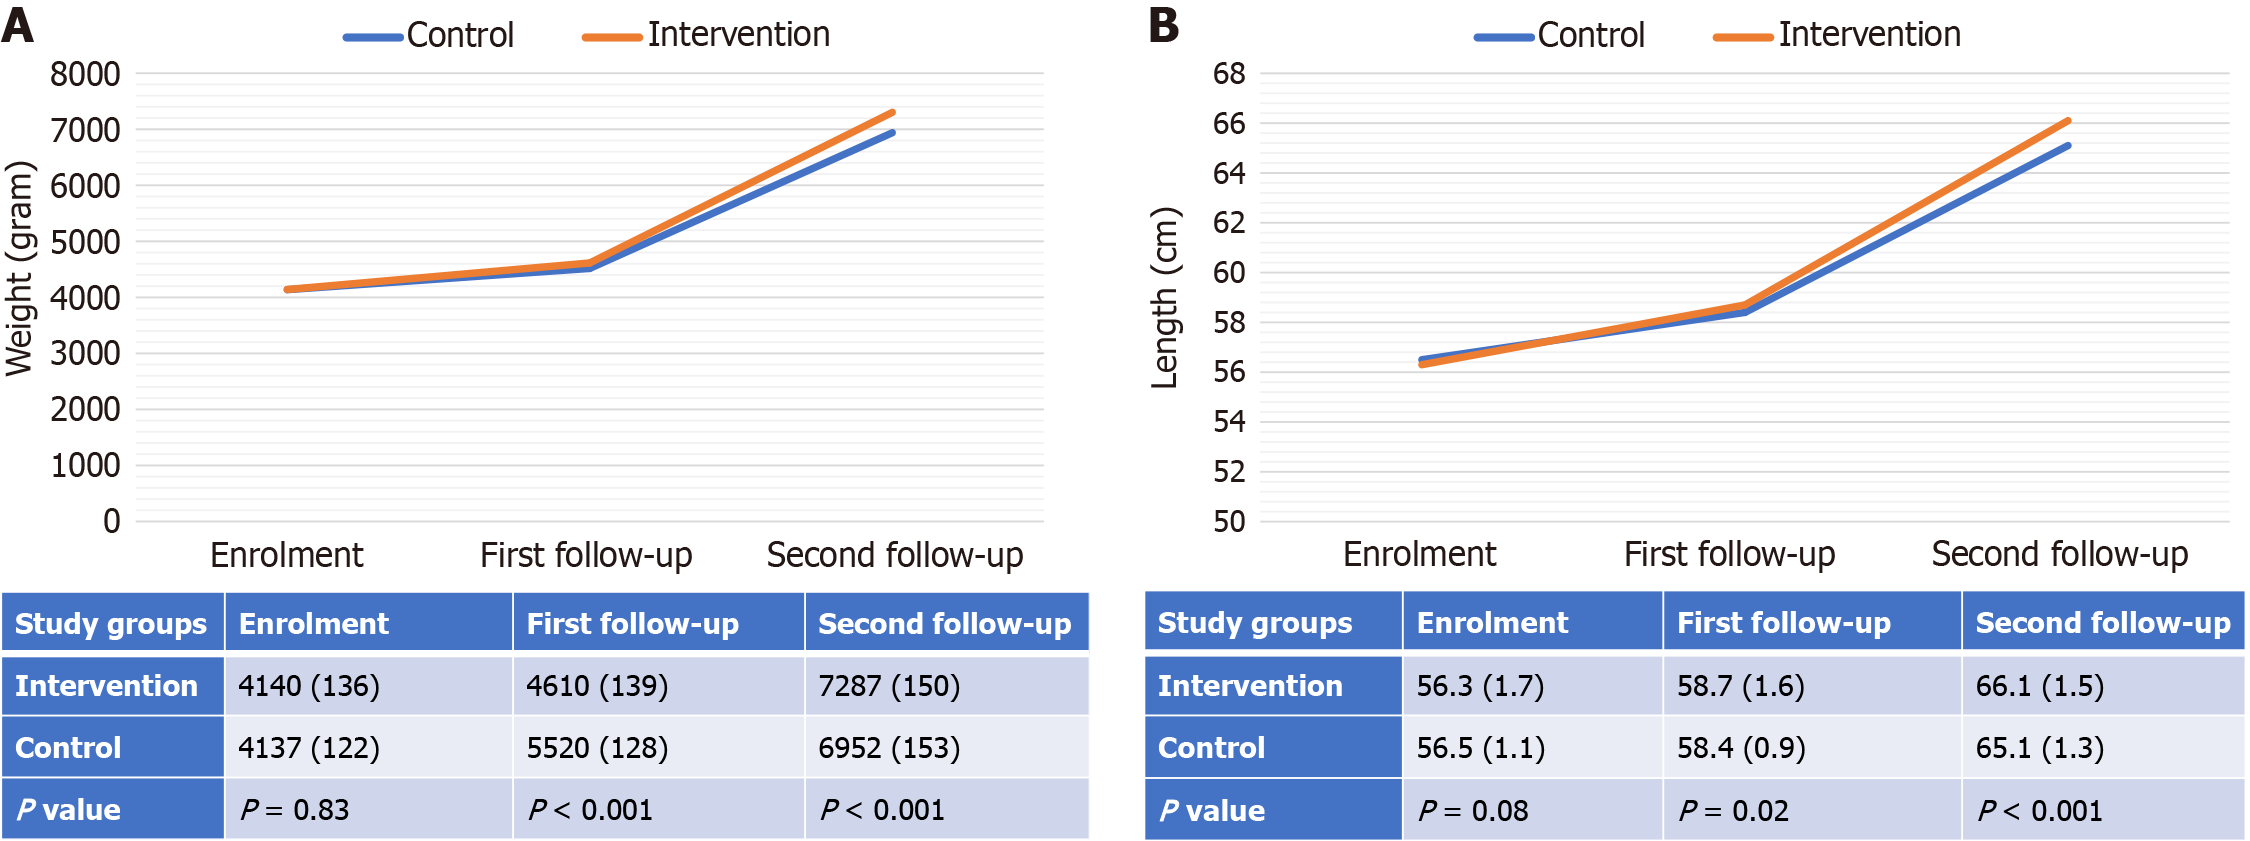
Figure 4 Trends of mean weight (gram) and length (cm) over time across the study groups.
A: Trends of mean weight over time; B: Trends of mean length over time.
- Citation: Kumar CM, Ghorui A, Hamsay K. Efficacy of prophylactic intermittent zinc supplementation for reducing acute respiratory infections and diarrhoea in infants: A randomized controlled trial. World J Clin Pediatr 2025; 14(4): 109022
- URL: https://www.wjgnet.com/2219-2808/full/v14/i4/109022.htm
- DOI: https://dx.doi.org/10.5409/wjcp.v14.i4.109022


