Copyright
©The Author(s) 2022.
World J Clin Pediatr. Mar 9, 2022; 11(2): 206-214
Published online Mar 9, 2022. doi: 10.5409/wjcp.v11.i2.206
Published online Mar 9, 2022. doi: 10.5409/wjcp.v11.i2.206
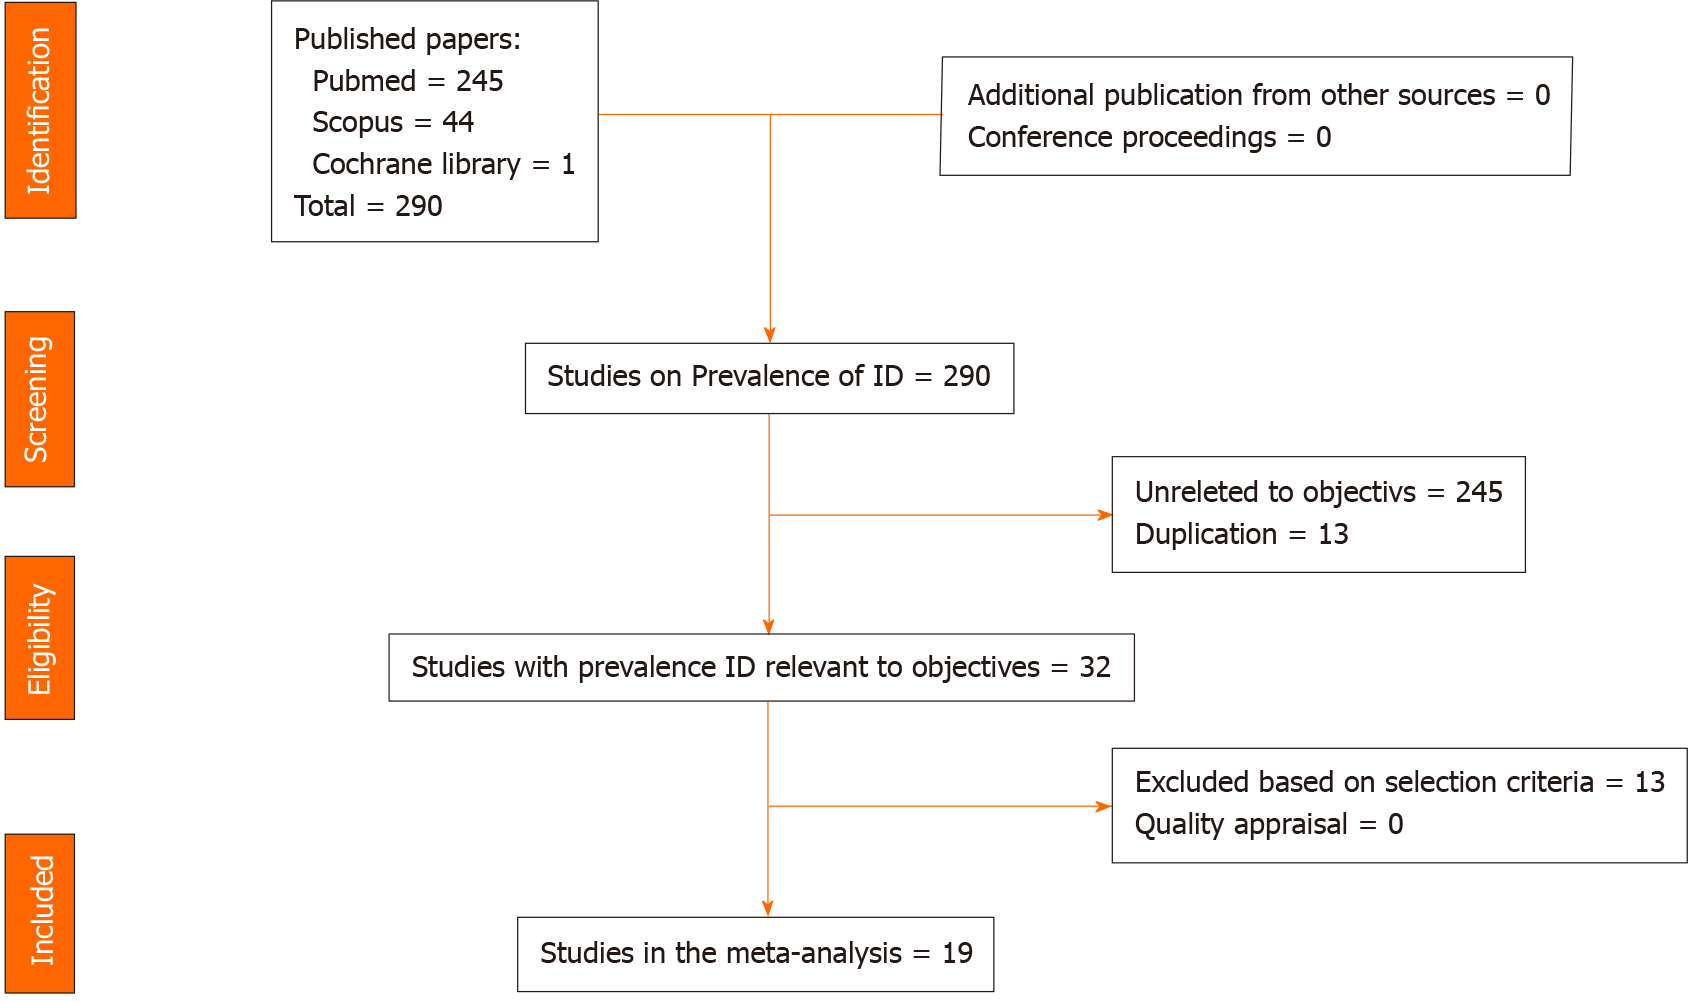
Figure 1 Preferred reporting items for systematic reviews and meta-analyses flow-chart for studies in the final meta-analysis.
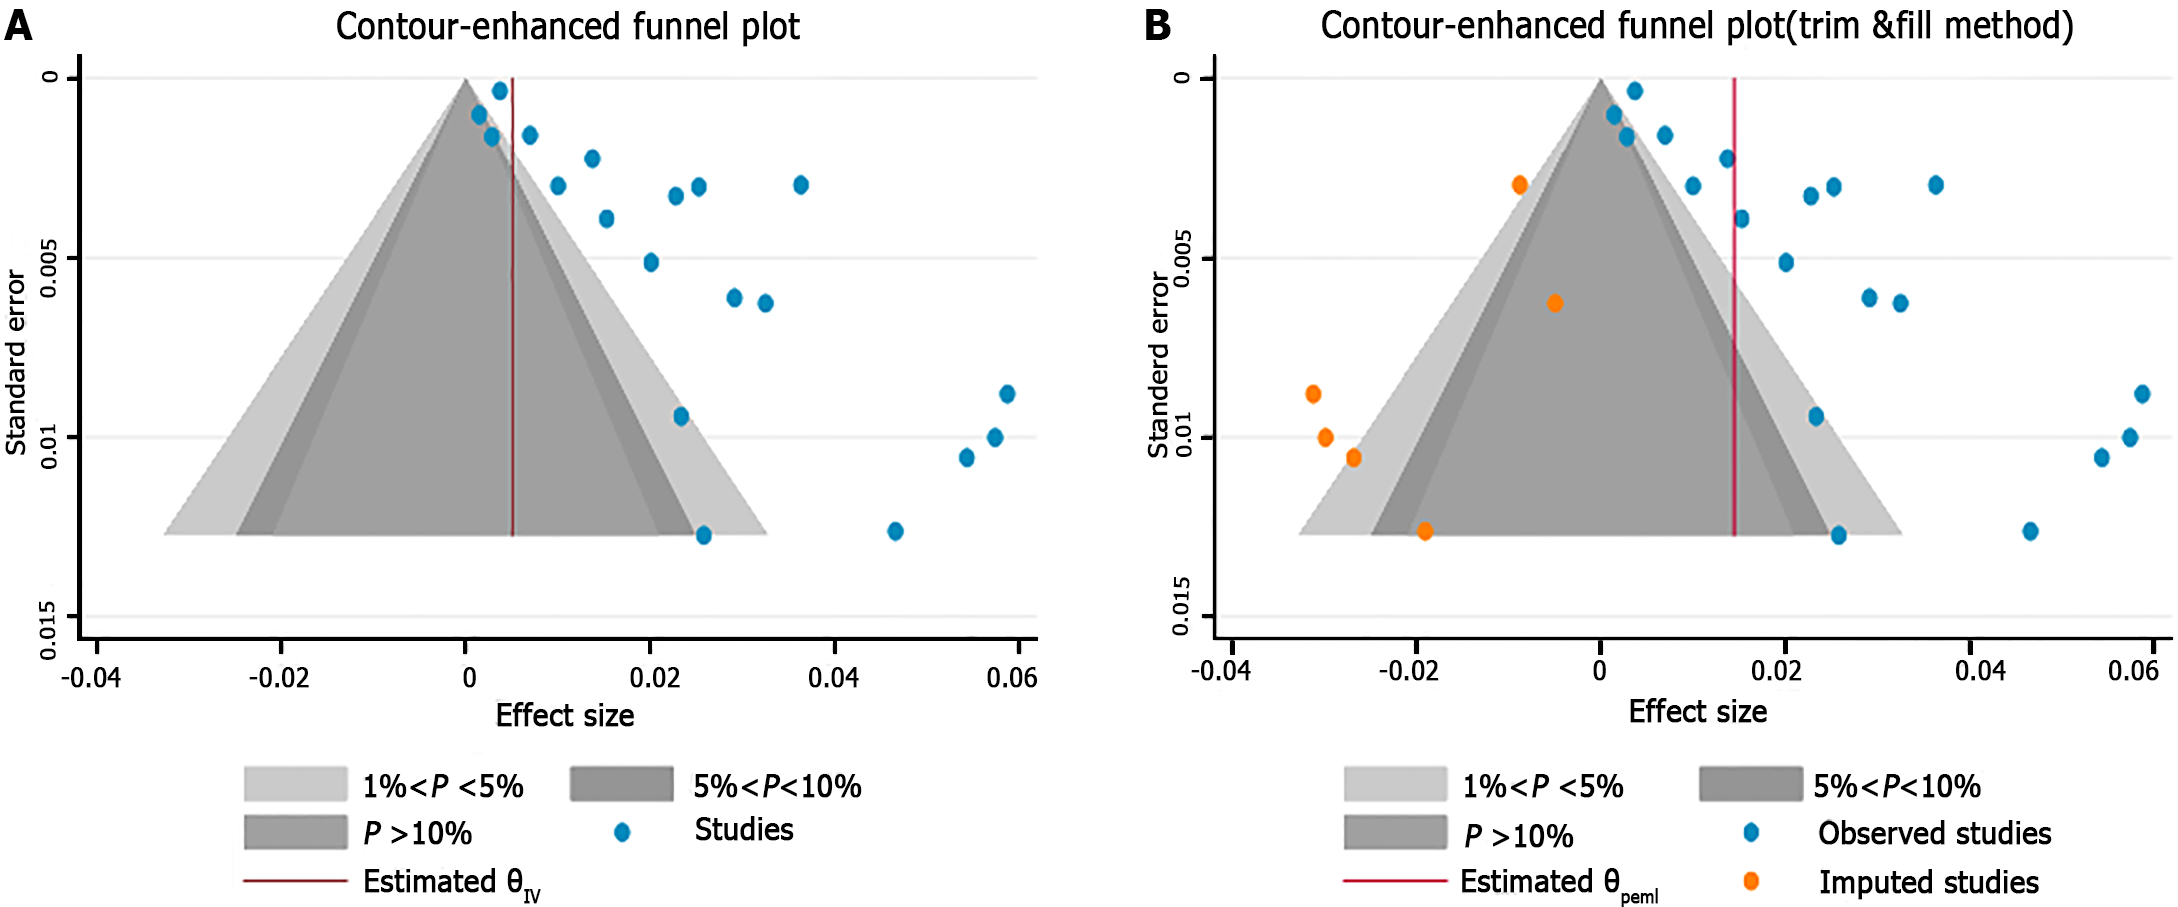
Figure 2 The contour-enhanced funnel plot (A) and trim-and-fill plot (B) for publication bias.
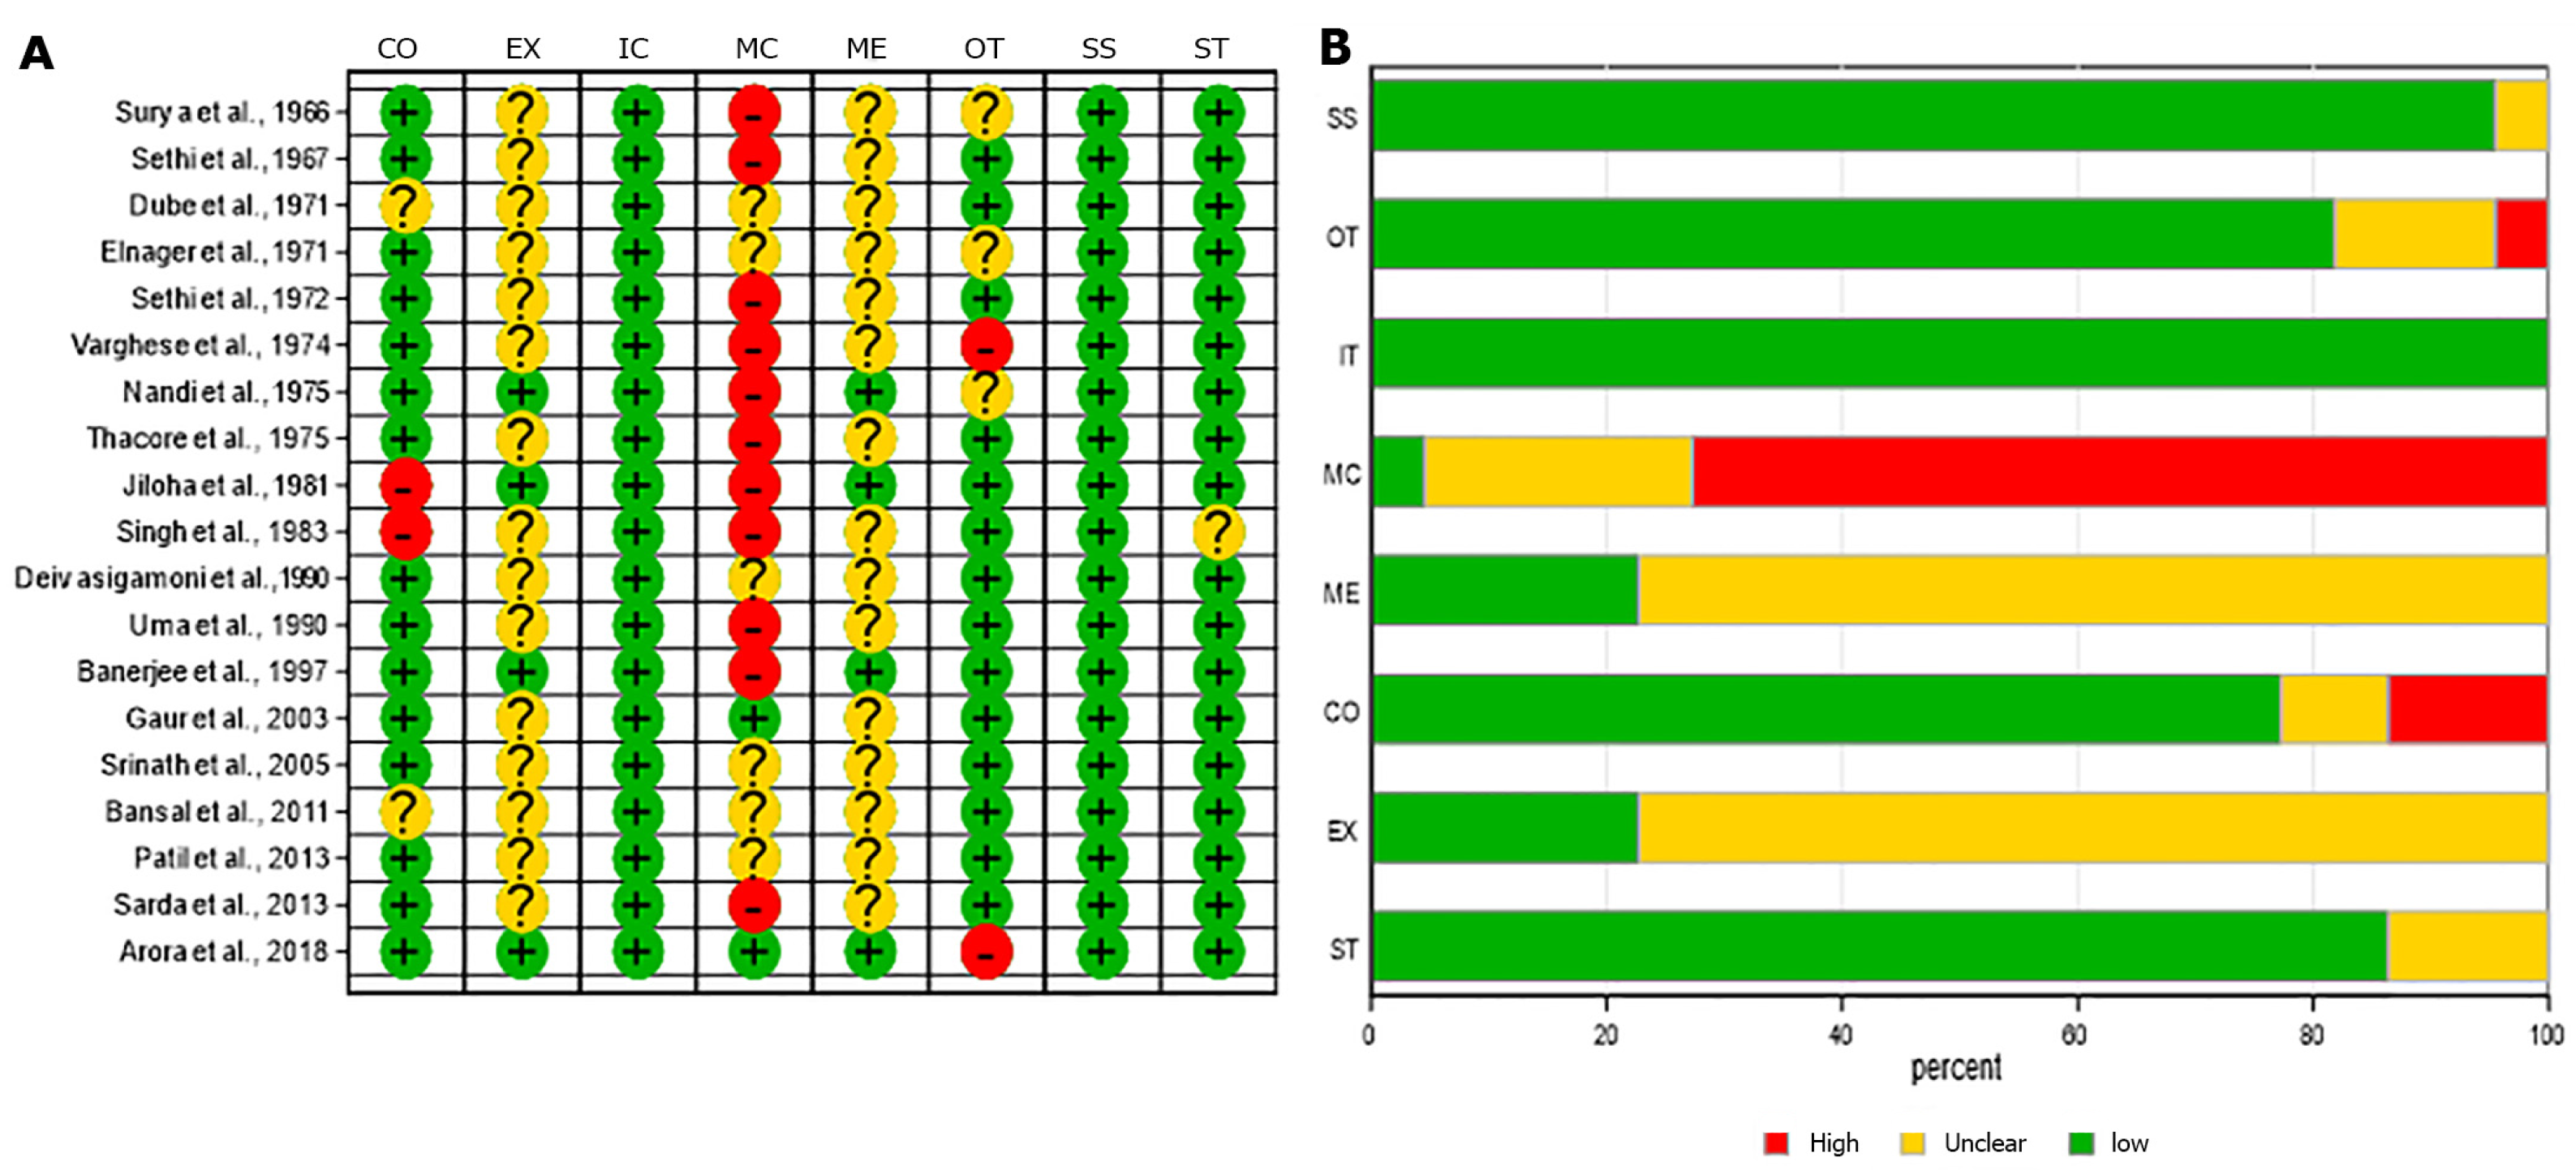
Figure 3 The Joanna Briggs Institute critical appraisal for prevalence meta-analysis for individual studies (A) and average quality across studies (B).
IC: Were the criteria for inclusion in the sample clearly defined? SS: Were the study subjects and the setting described in detail? EX: Was the exposure measured in a valid and reliable way? ME: Were objective, standard criteria used for measurement of the condition? CO: Were confounding factors identified? MC: were strategies to deal with confounding factors stated? OT: Were the outcomes measured in a valid and reliable way? ST: Was appropriate statistical analysis used? High: High bias; No: Low bias; Unclear: Unclear bias; NA: Not applicable.
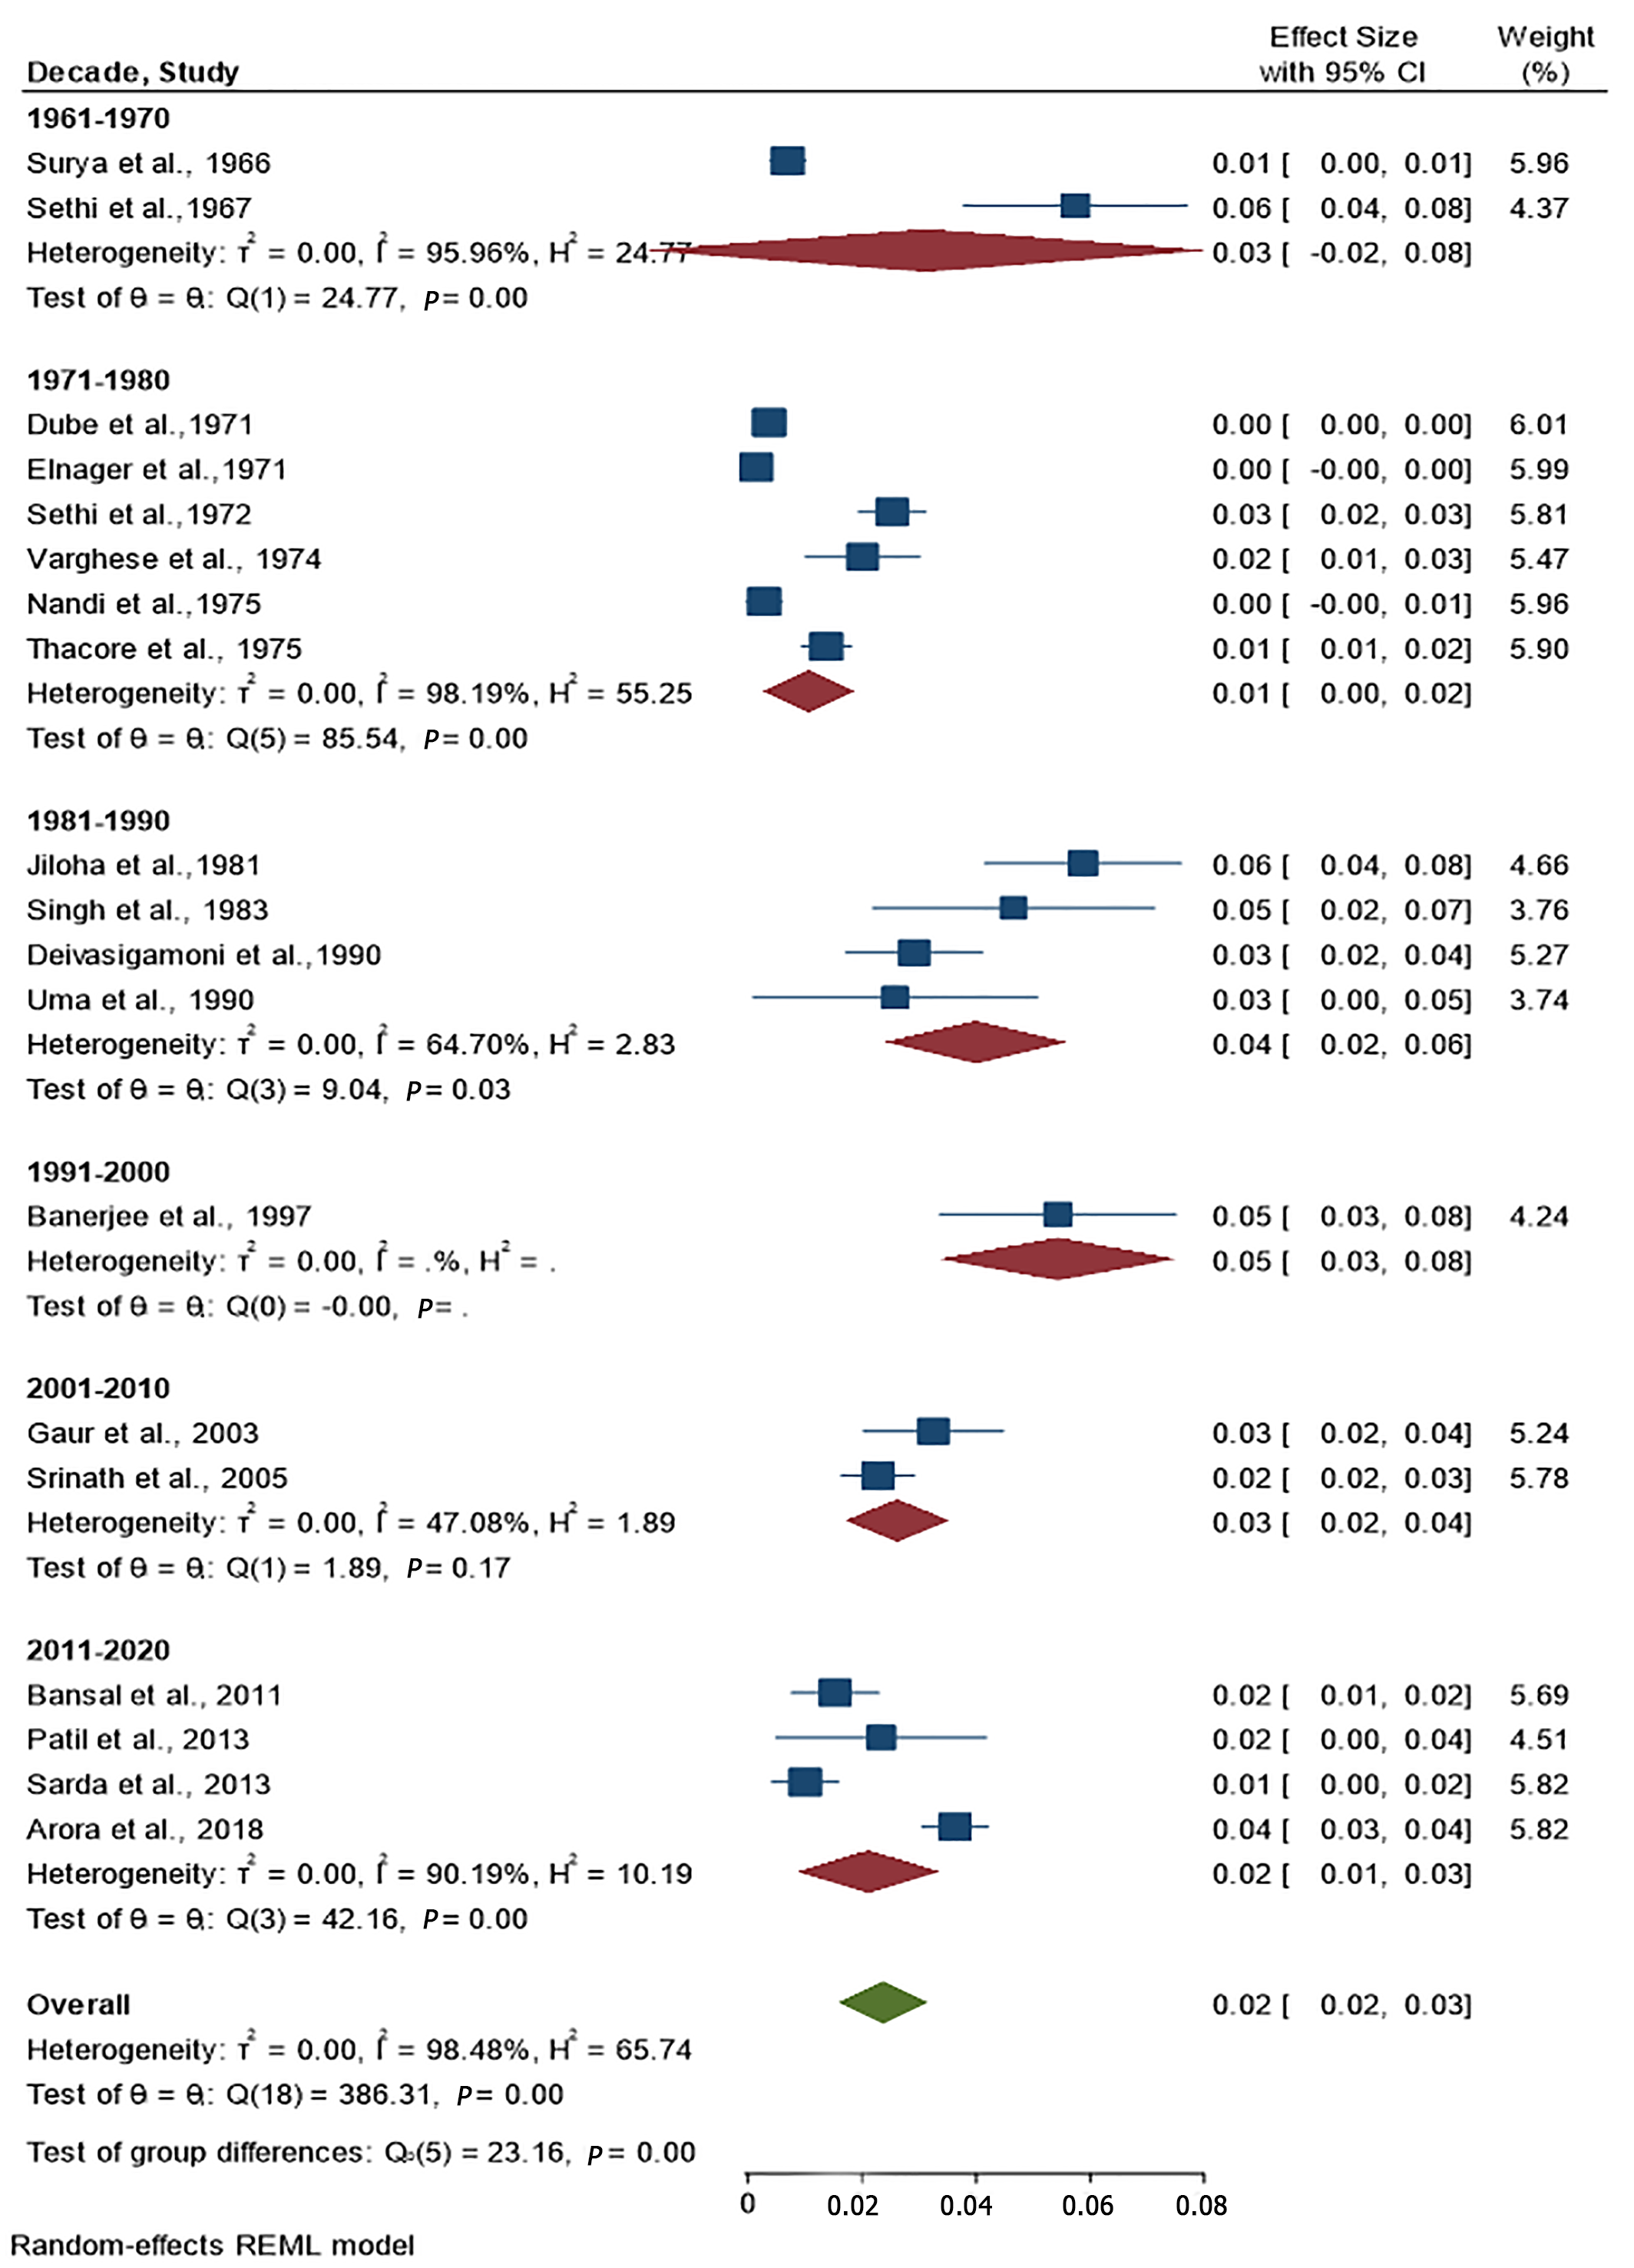
Figure 4 The forest plot for summary prevalence of intellectual disability in India.
- Citation: Russell PSS, Nagaraj S, Vengadavaradan A, Russell S, Mammen PM, Shankar SR, Viswanathan SA, Earnest R, Chikkala SM, Rebekah G. Prevalence of intellectual disability in India: A meta-analysis. World J Clin Pediatr 2022; 11(2): 206-214
- URL: https://www.wjgnet.com/2219-2808/full/v11/i2/206.htm
- DOI: https://dx.doi.org/10.5409/wjcp.v11.i2.206


