©The Author(s) 2025.
World J Neurol. Sep 19, 2025; 11(1): 110105
Published online Sep 19, 2025. doi: 10.5316/wjn.v11.i1.110105
Published online Sep 19, 2025. doi: 10.5316/wjn.v11.i1.110105
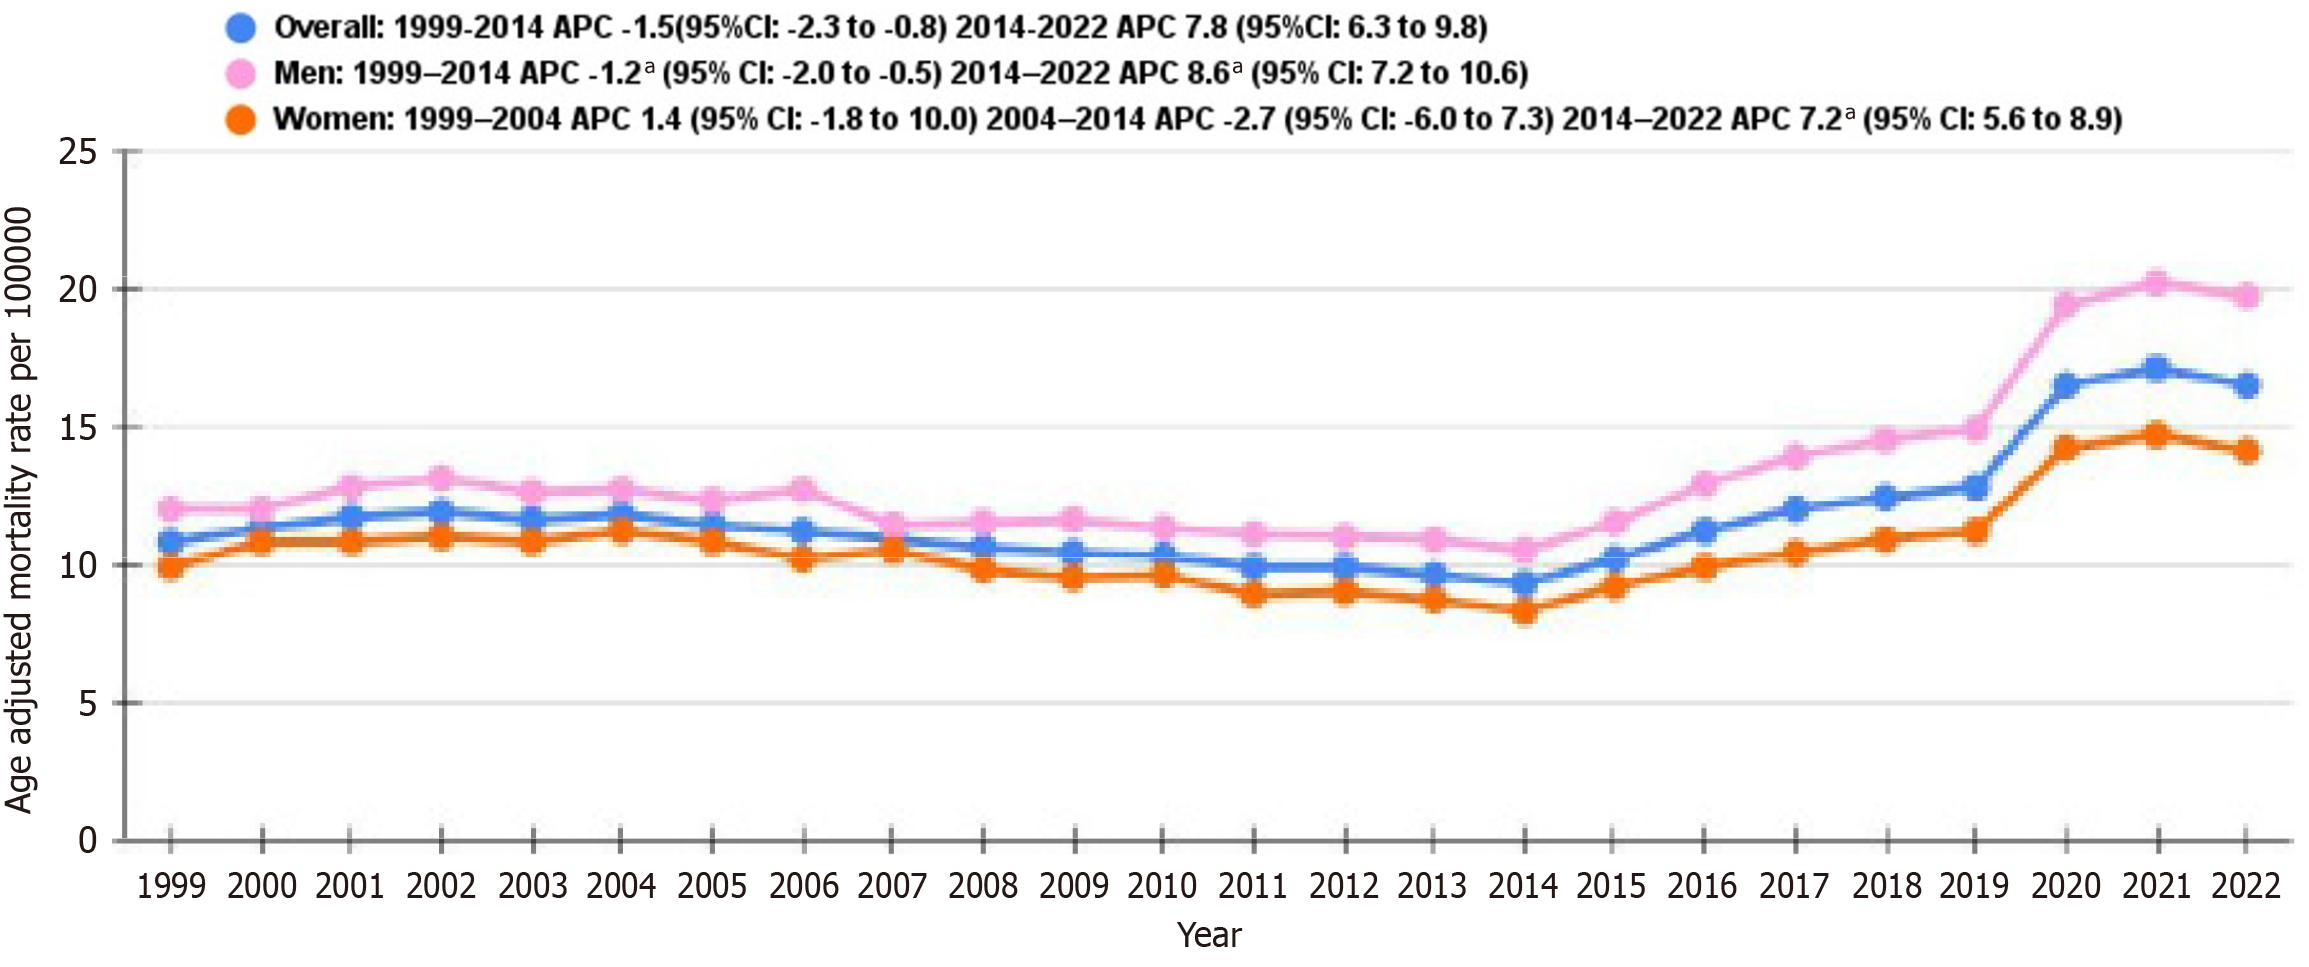
Figure 1 Overall and gender stratified non-insulin dependent diabetes mellitus and stroke-related age adjusted mortality rate per 100000, in Adults in the United States from 1999 to 2022.
aP < 0.05. APC: Annual percentage changes.
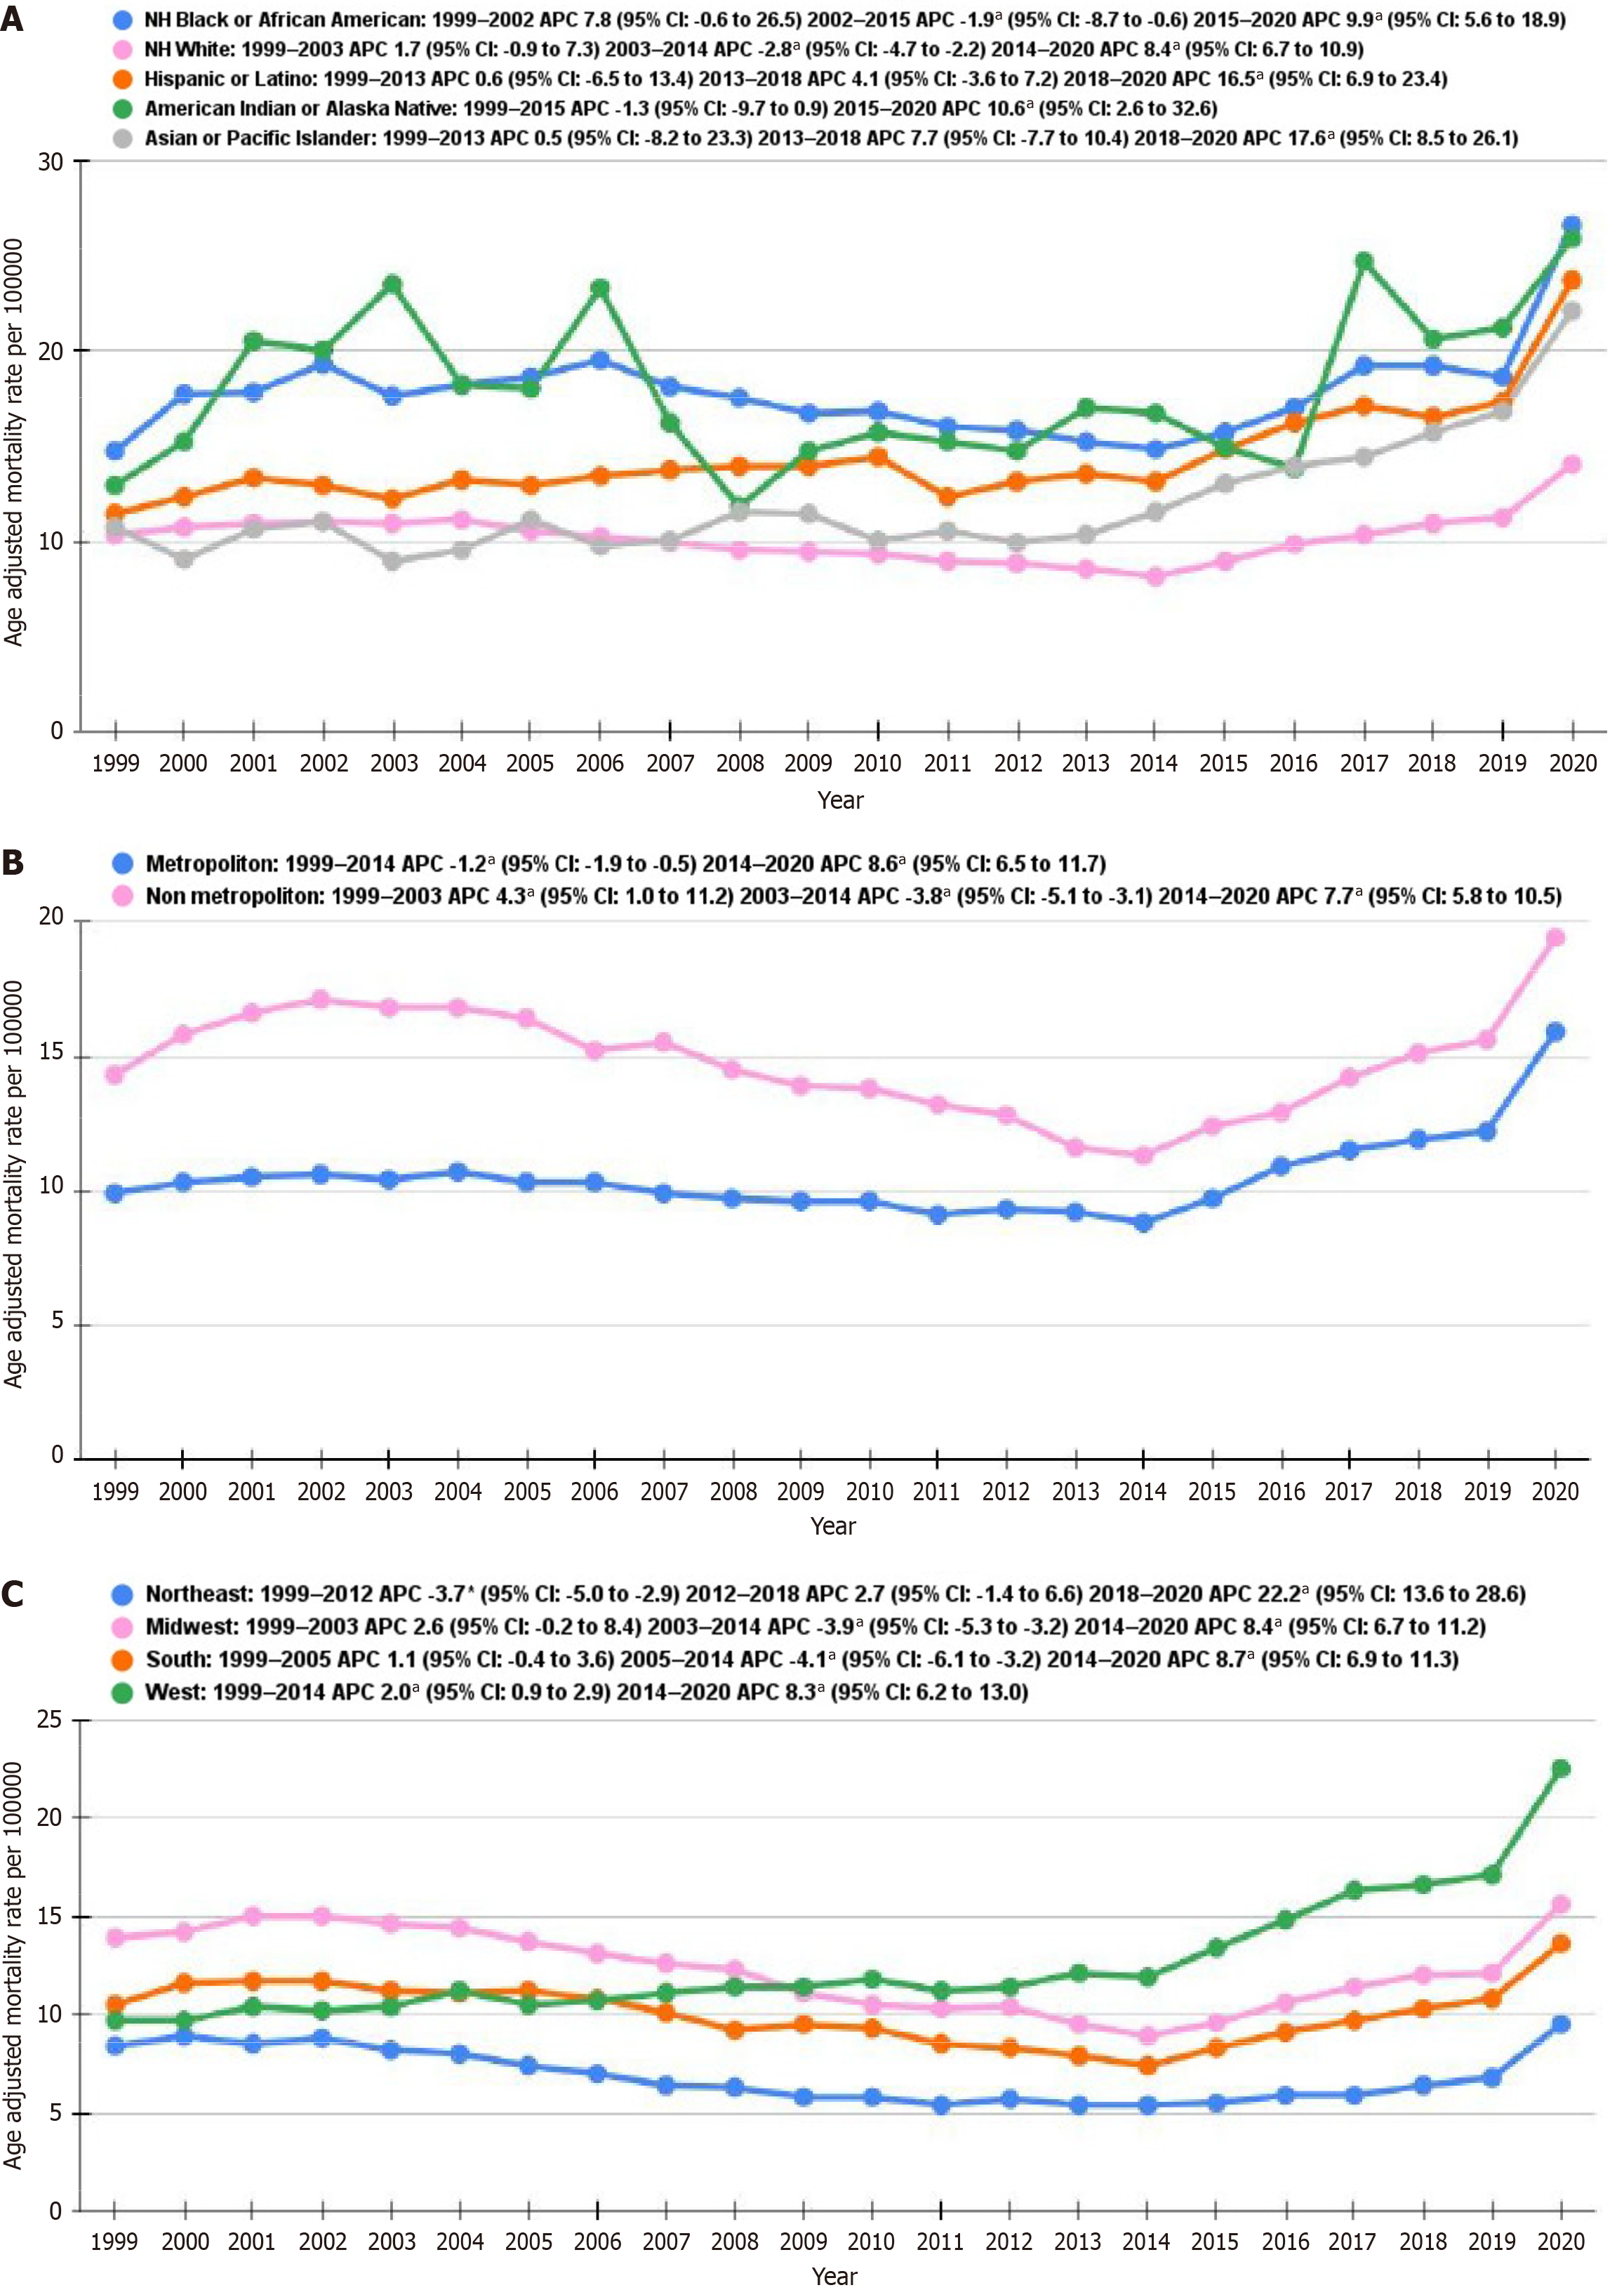
Figure 2 Non-insulin dependent diabetes mellitus and stroke-related age adjusted mortality rate per 100000 among older adults in the United States from 1999 to 2020.
A: Stratified by race; B: Stratified by urban-rural; C: Stratified by census region. aP < 0.05. APC: Annual percentage changes.
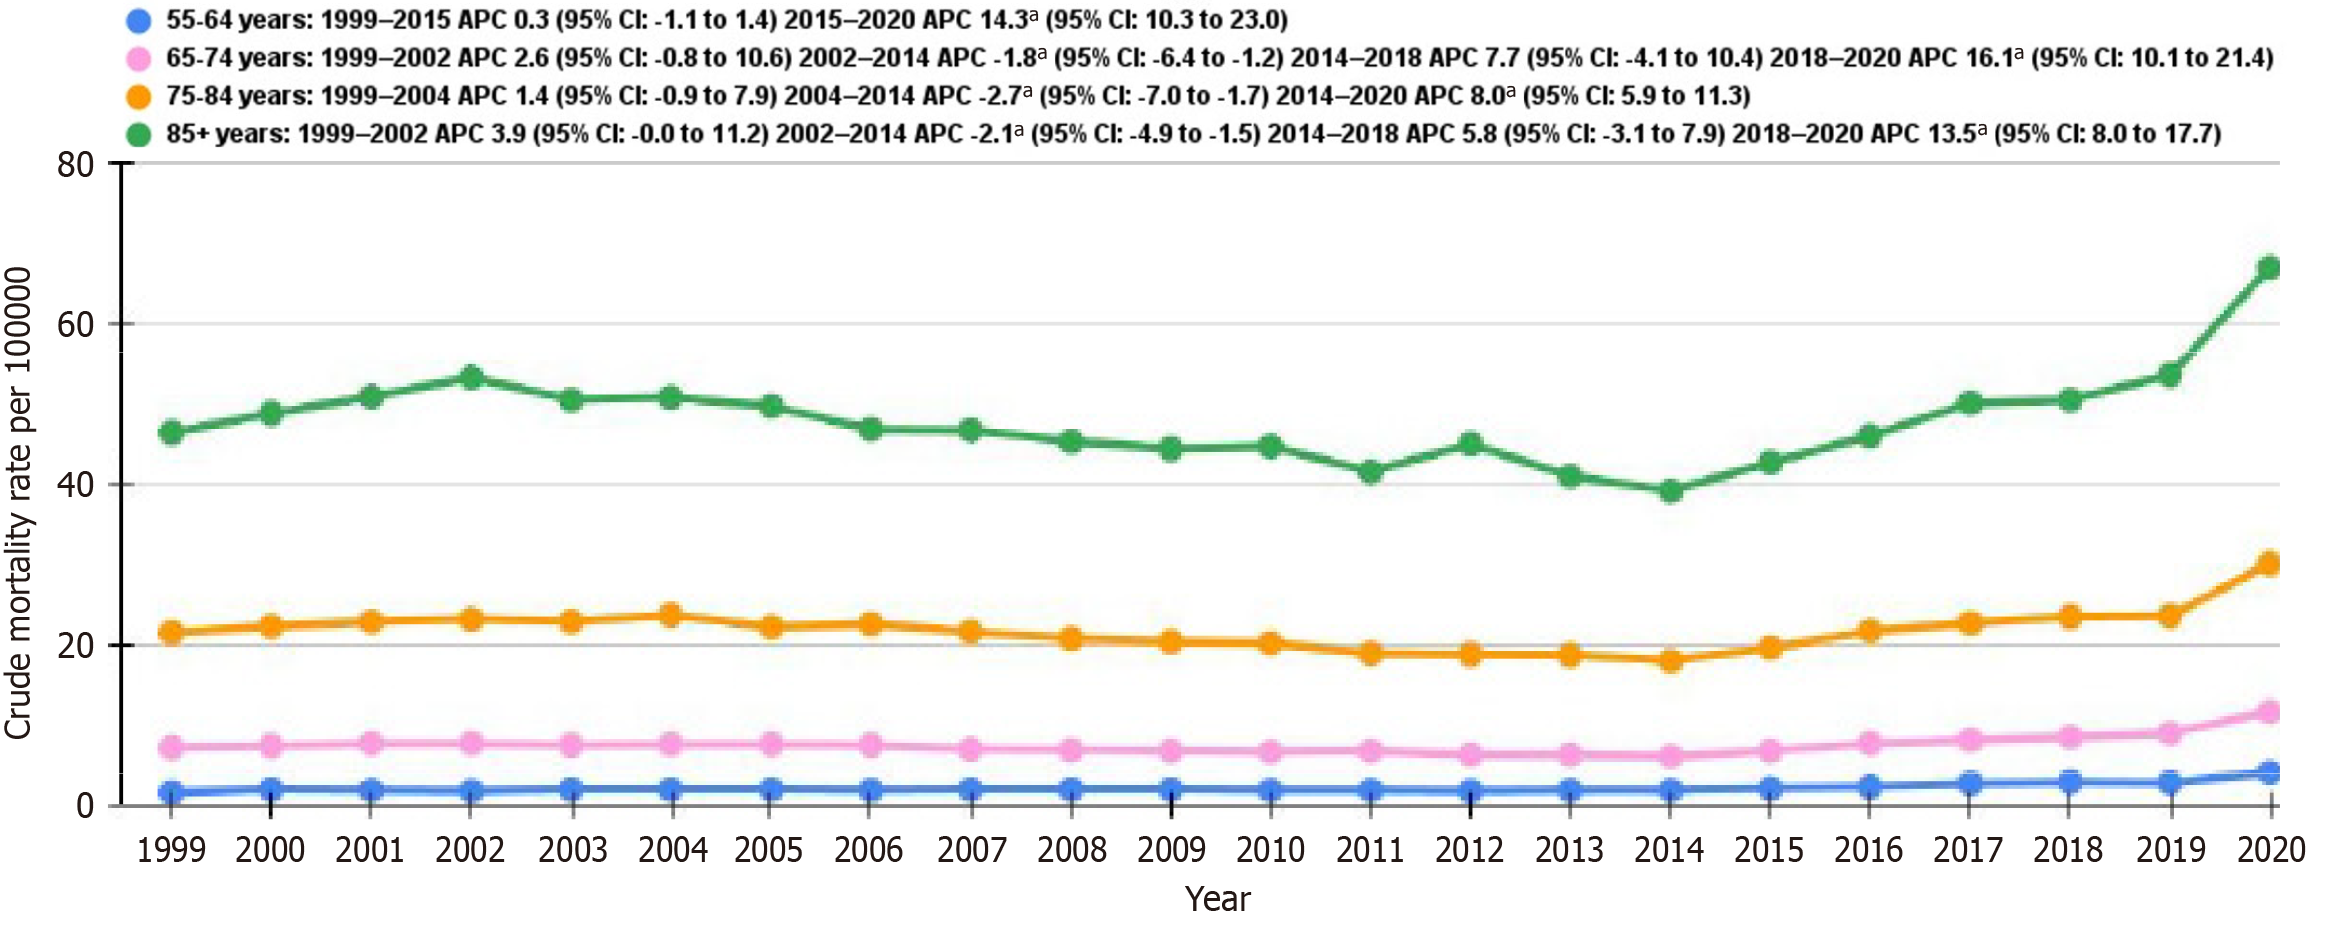
Figure 3 Non-insulin dependent diabetes mellitus and stroke-related crude mortality rate per 100000, stratified by age groups among older adults in the United States from 1999 to 2020.
aP < 0.05. APC: Annual percentage changes.
- Citation: Khan SMI, Asif H, Raza MH, Waqas M, Ali SZ, Khawar M, Saifullah M, Mehdi AM. Trends and disparities in mortality from comorbid non-insulin-dependent diabetes mellitus and stroke (1999-2022): A retrospective analysis. World J Neurol 2025; 11(1): 110105
- URL: https://www.wjgnet.com/2218-6212/full/v11/i1/110105.htm
- DOI: https://dx.doi.org/10.5316/wjn.v11.i1.110105


