
















Copyright: ©Author(s) 2026.
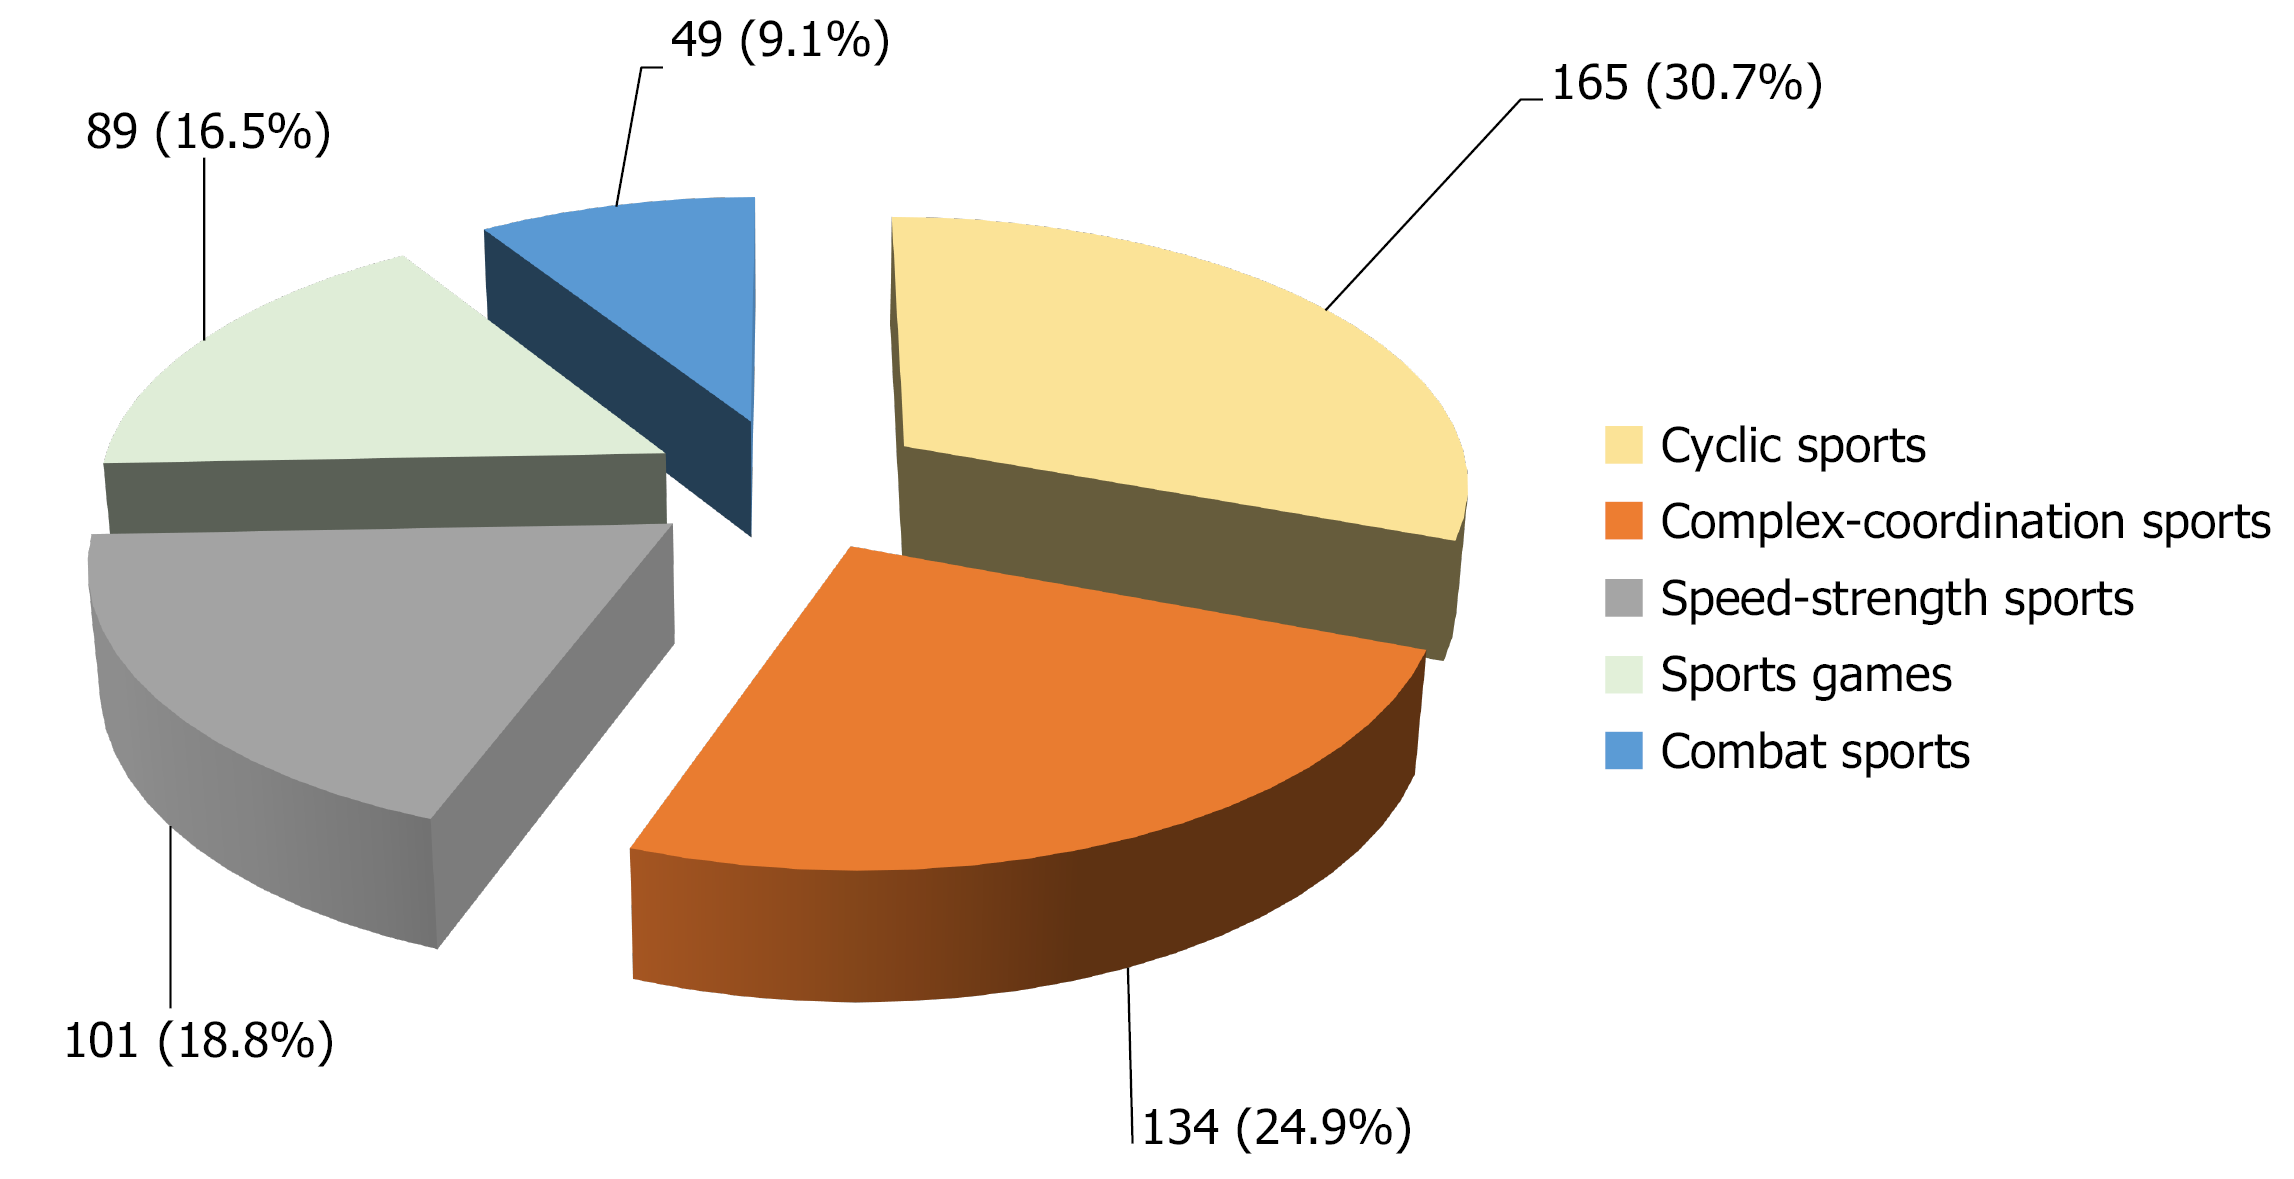
Figure 1
Distribution of study participants depending on the sports type.
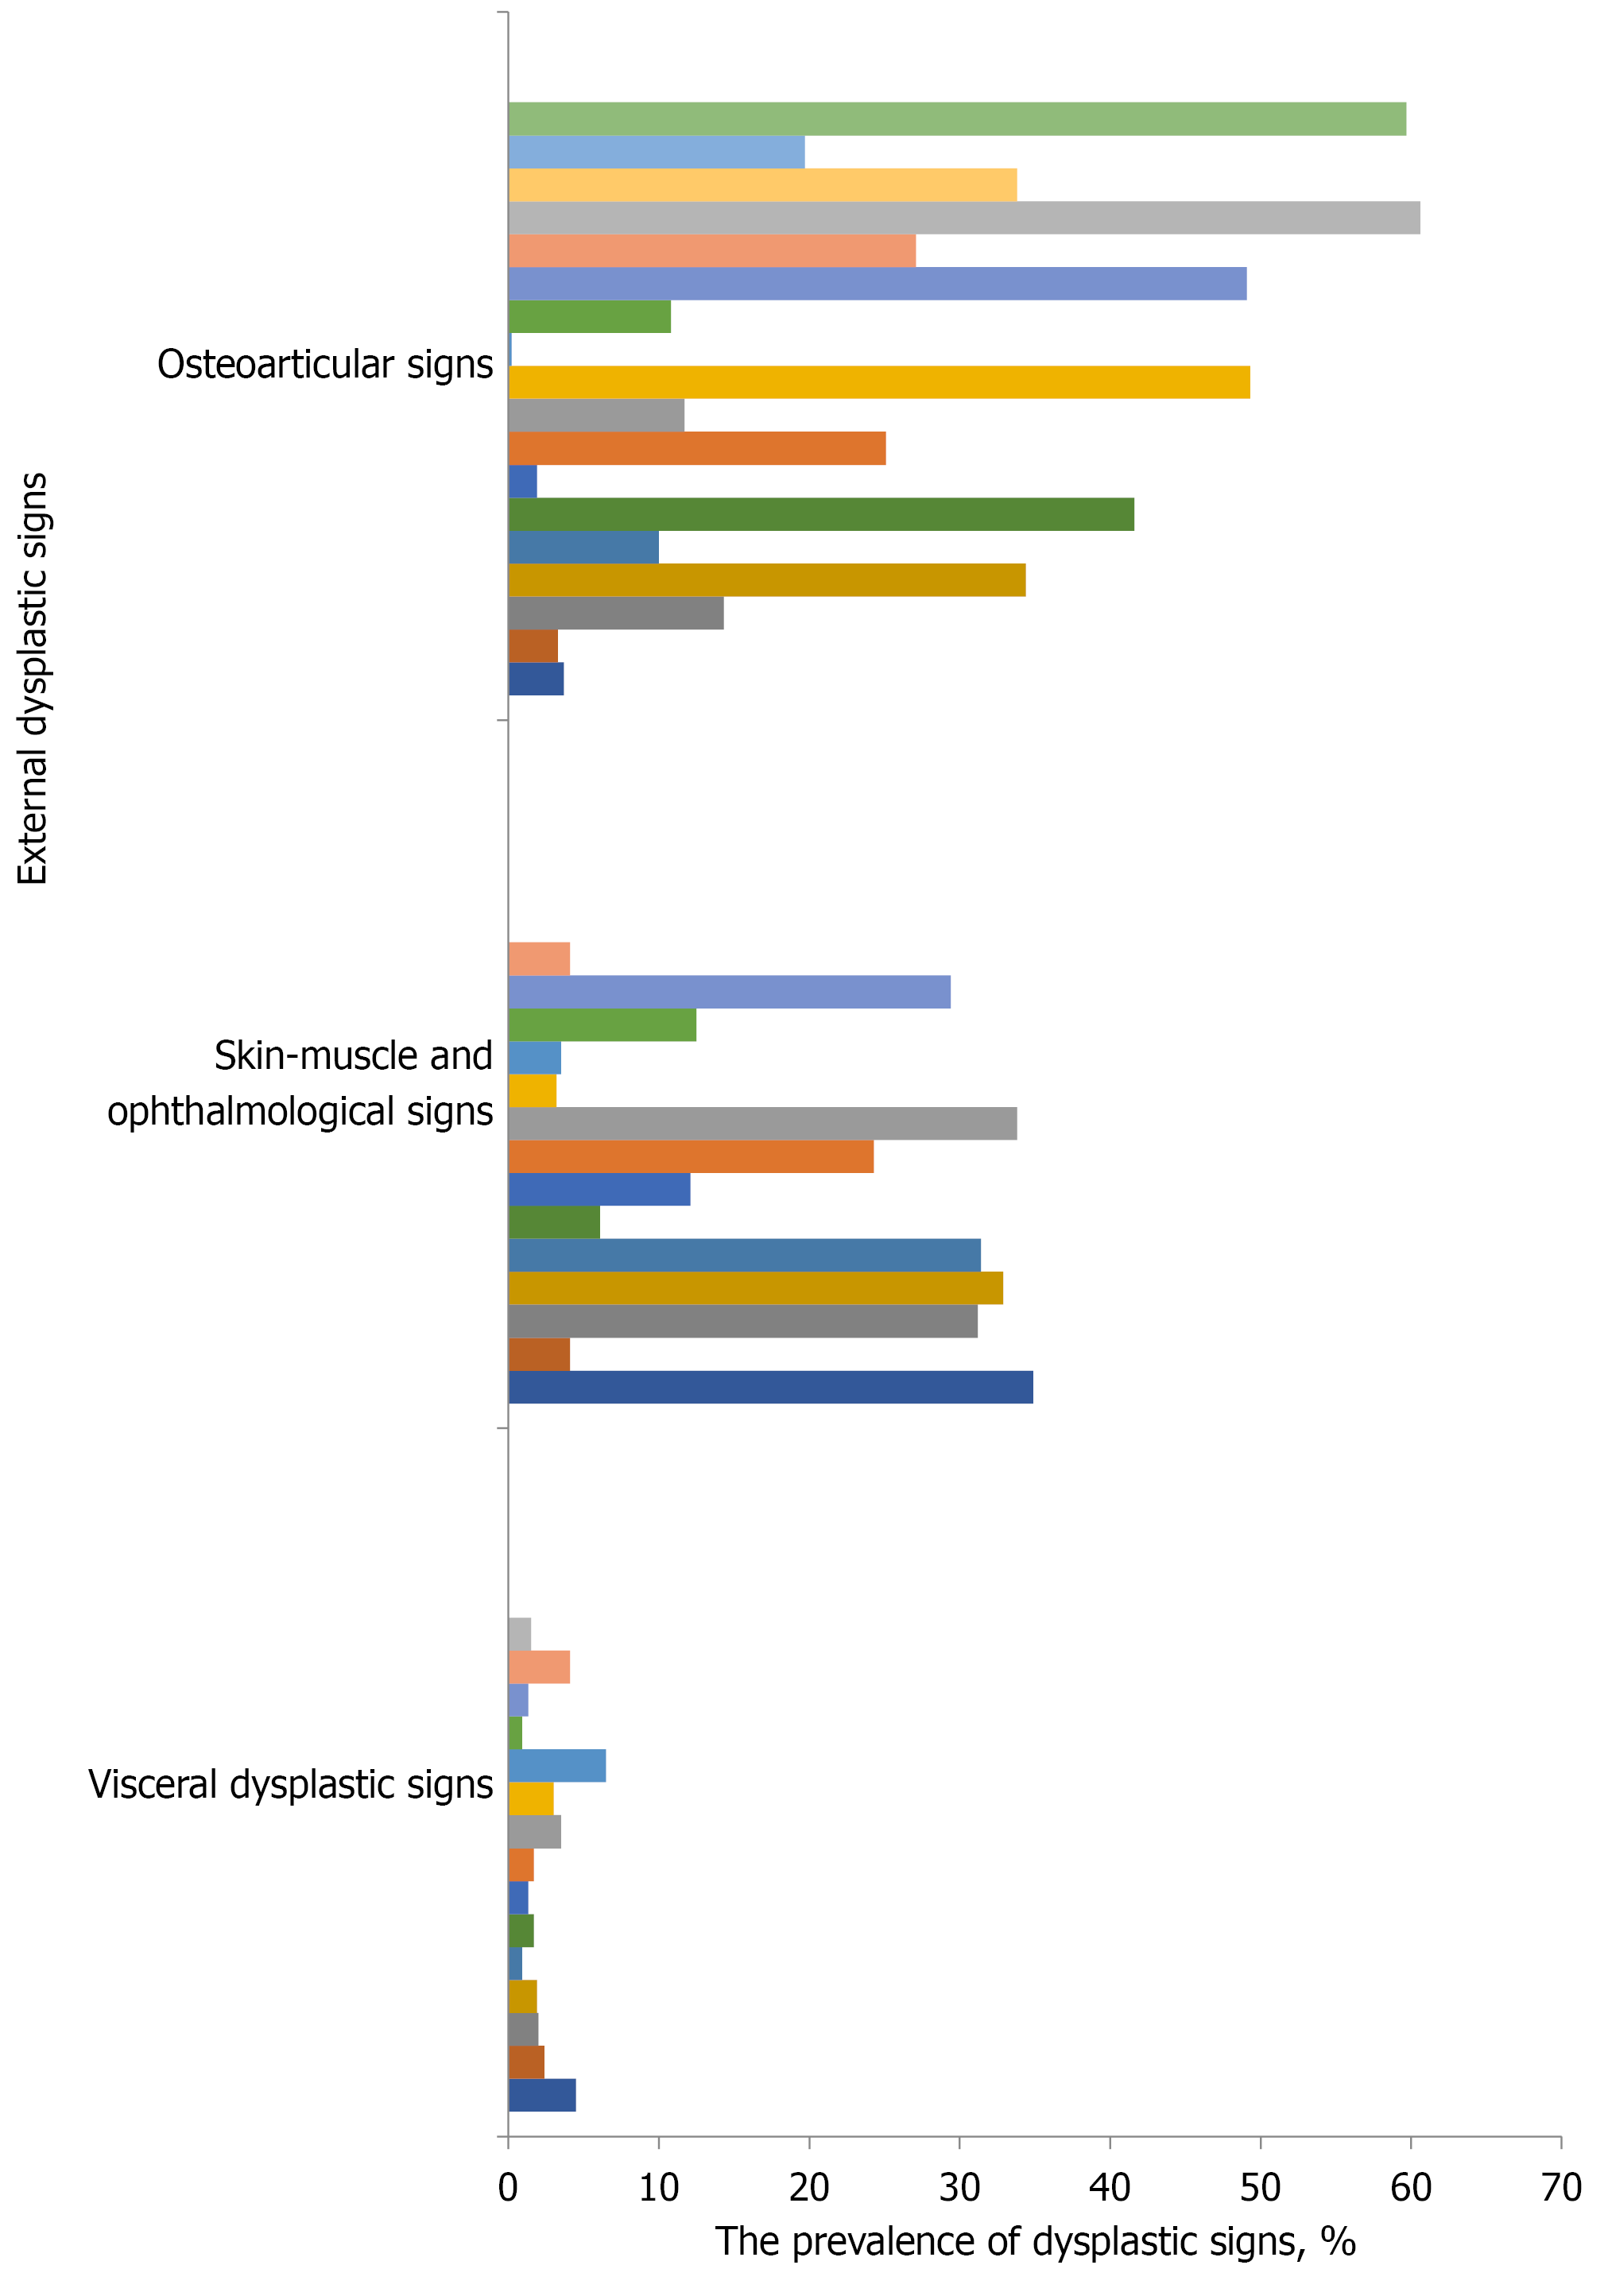
Figure 2 Prevalence of all dysplastic features in the total sample of young athletes.
The dysplastic manifestations in young athletes were primarily represented by external dysplastic features with a significant predominance of osteoarticular signs.
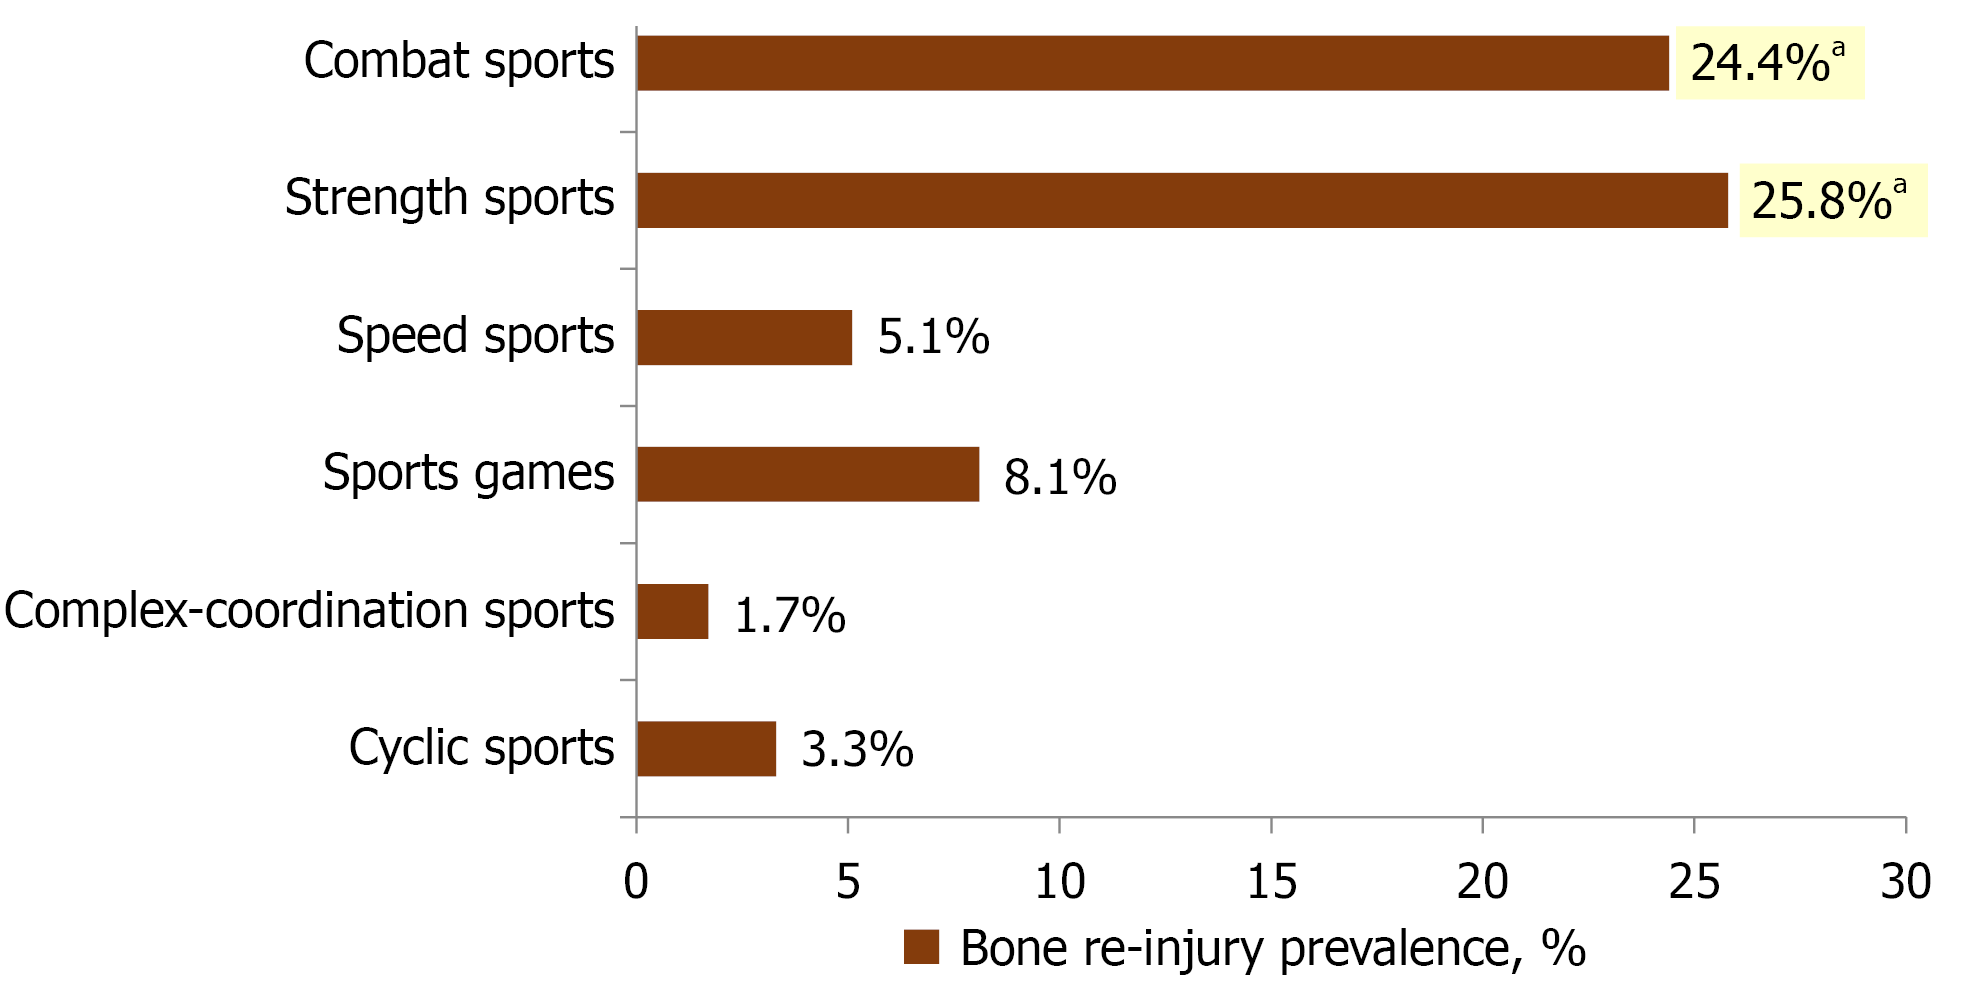
Figure 3 Recurrent bone injury prevalence depending on the sports activity type.
aP < 0.001 compared with other sports activities.
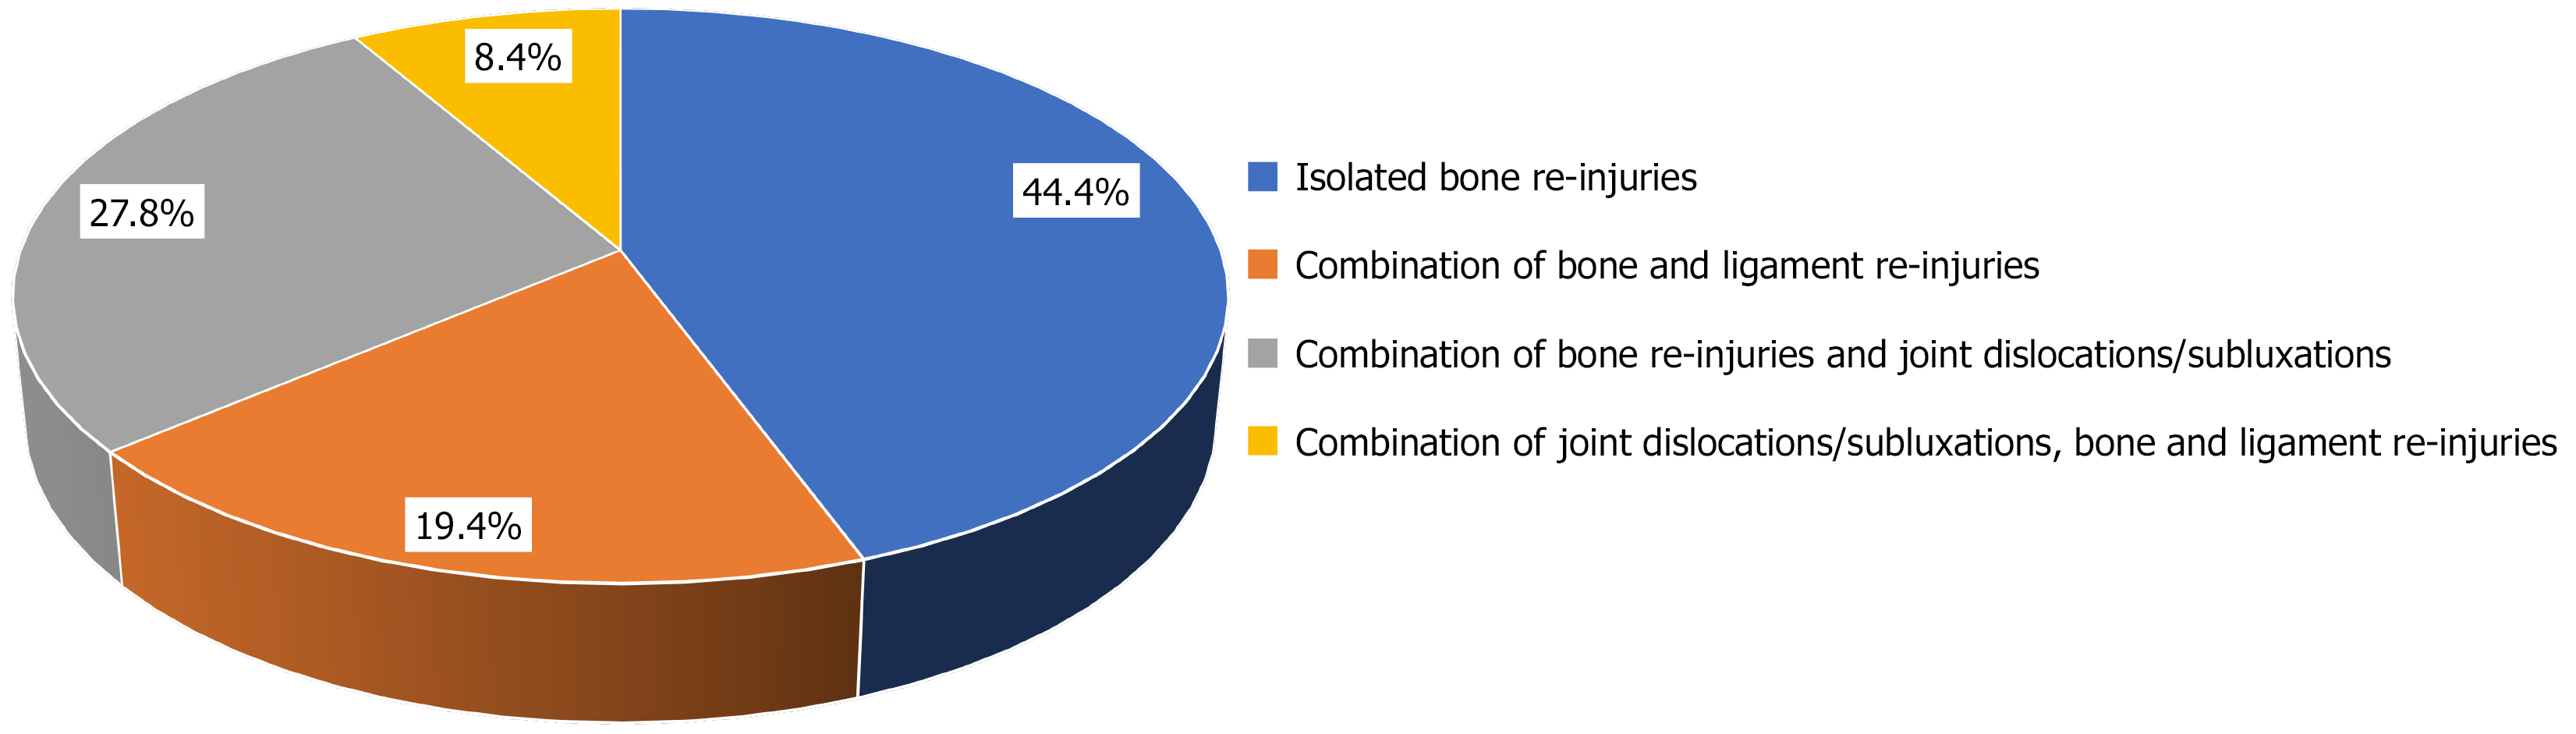
Figure 4
Recurrent bone injury description.
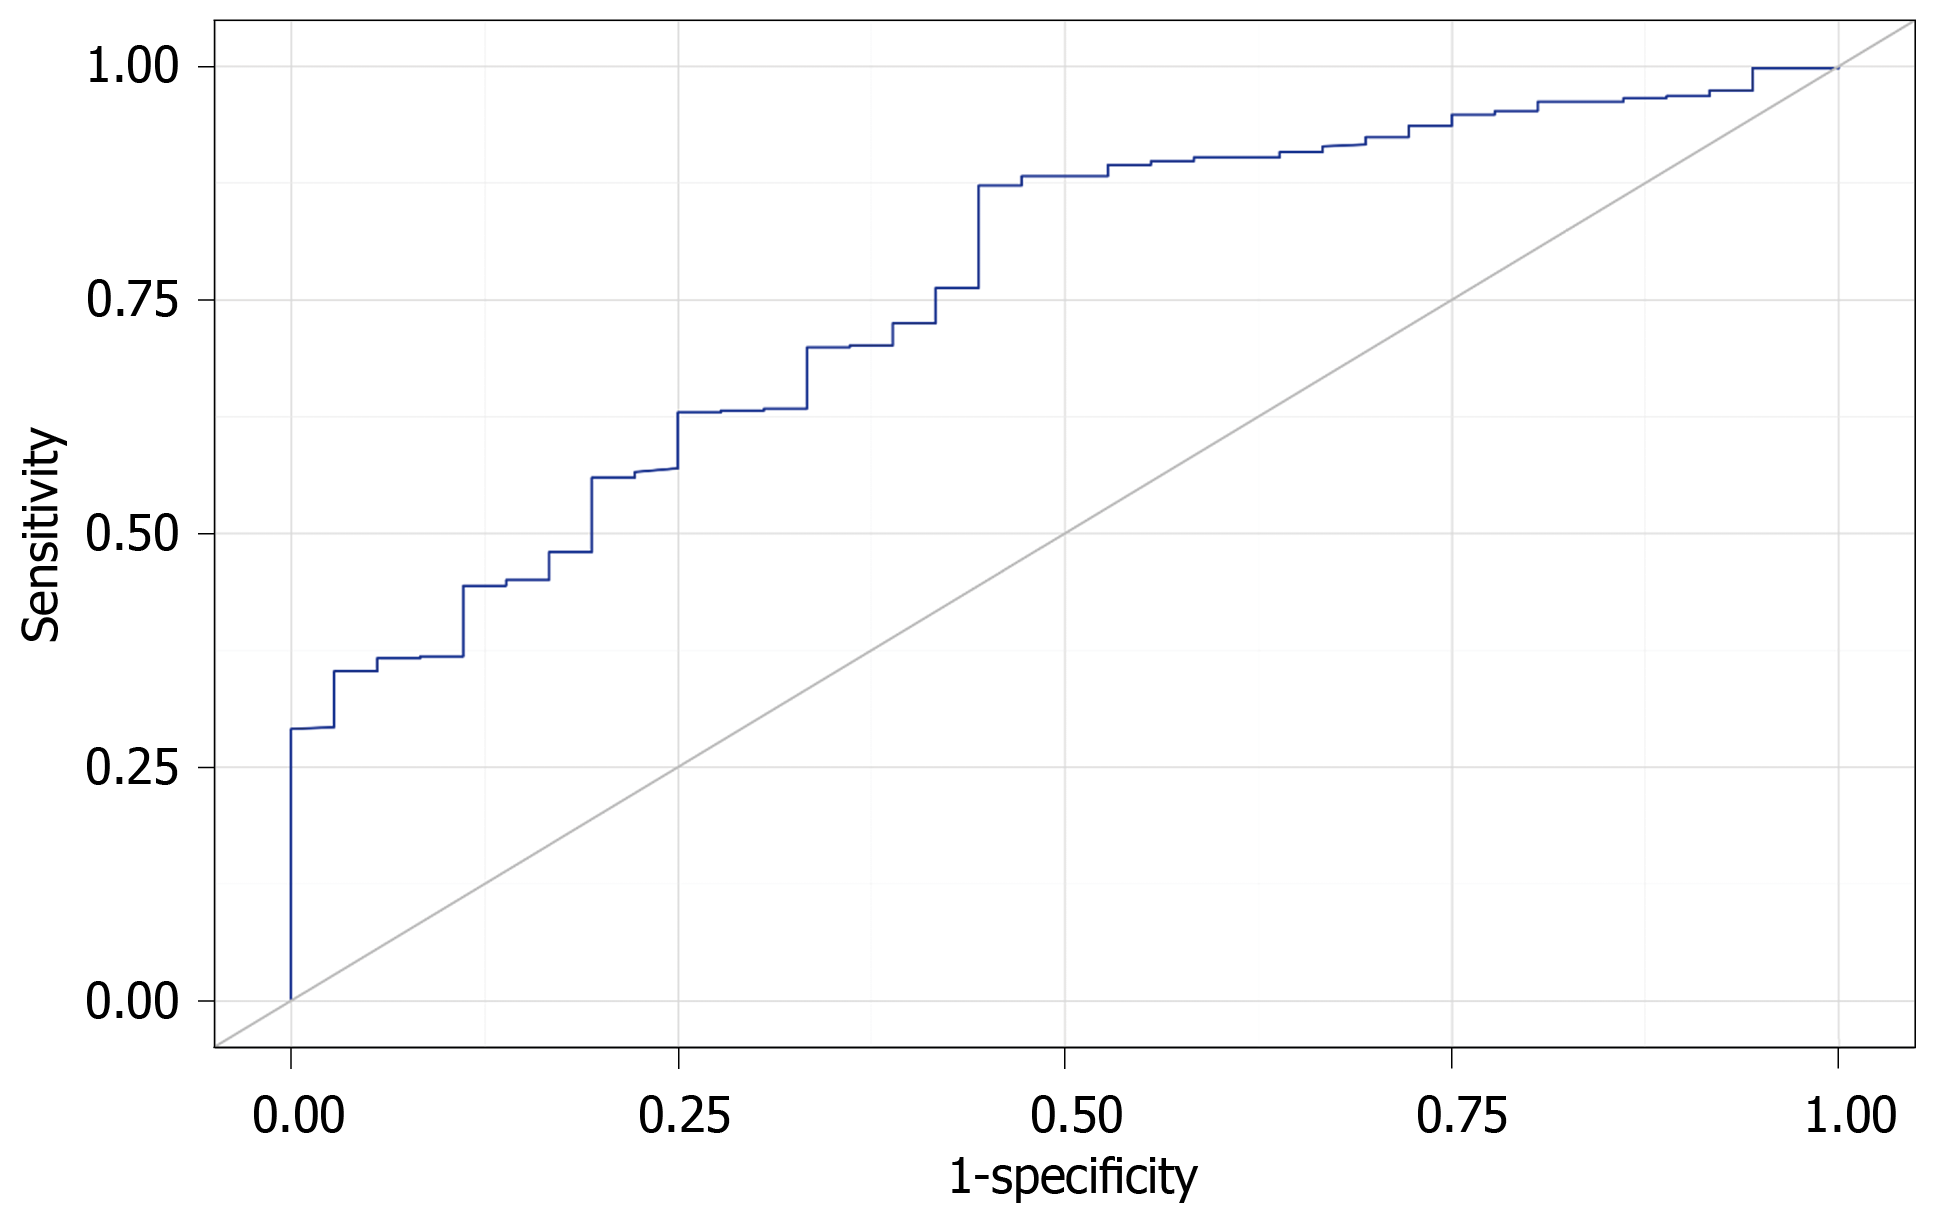
Figure 5
Receiver operating characteristic-curve characterizing the discriminatory ability of connective tissue dysplasia score in identifying predisposition to bone injury.
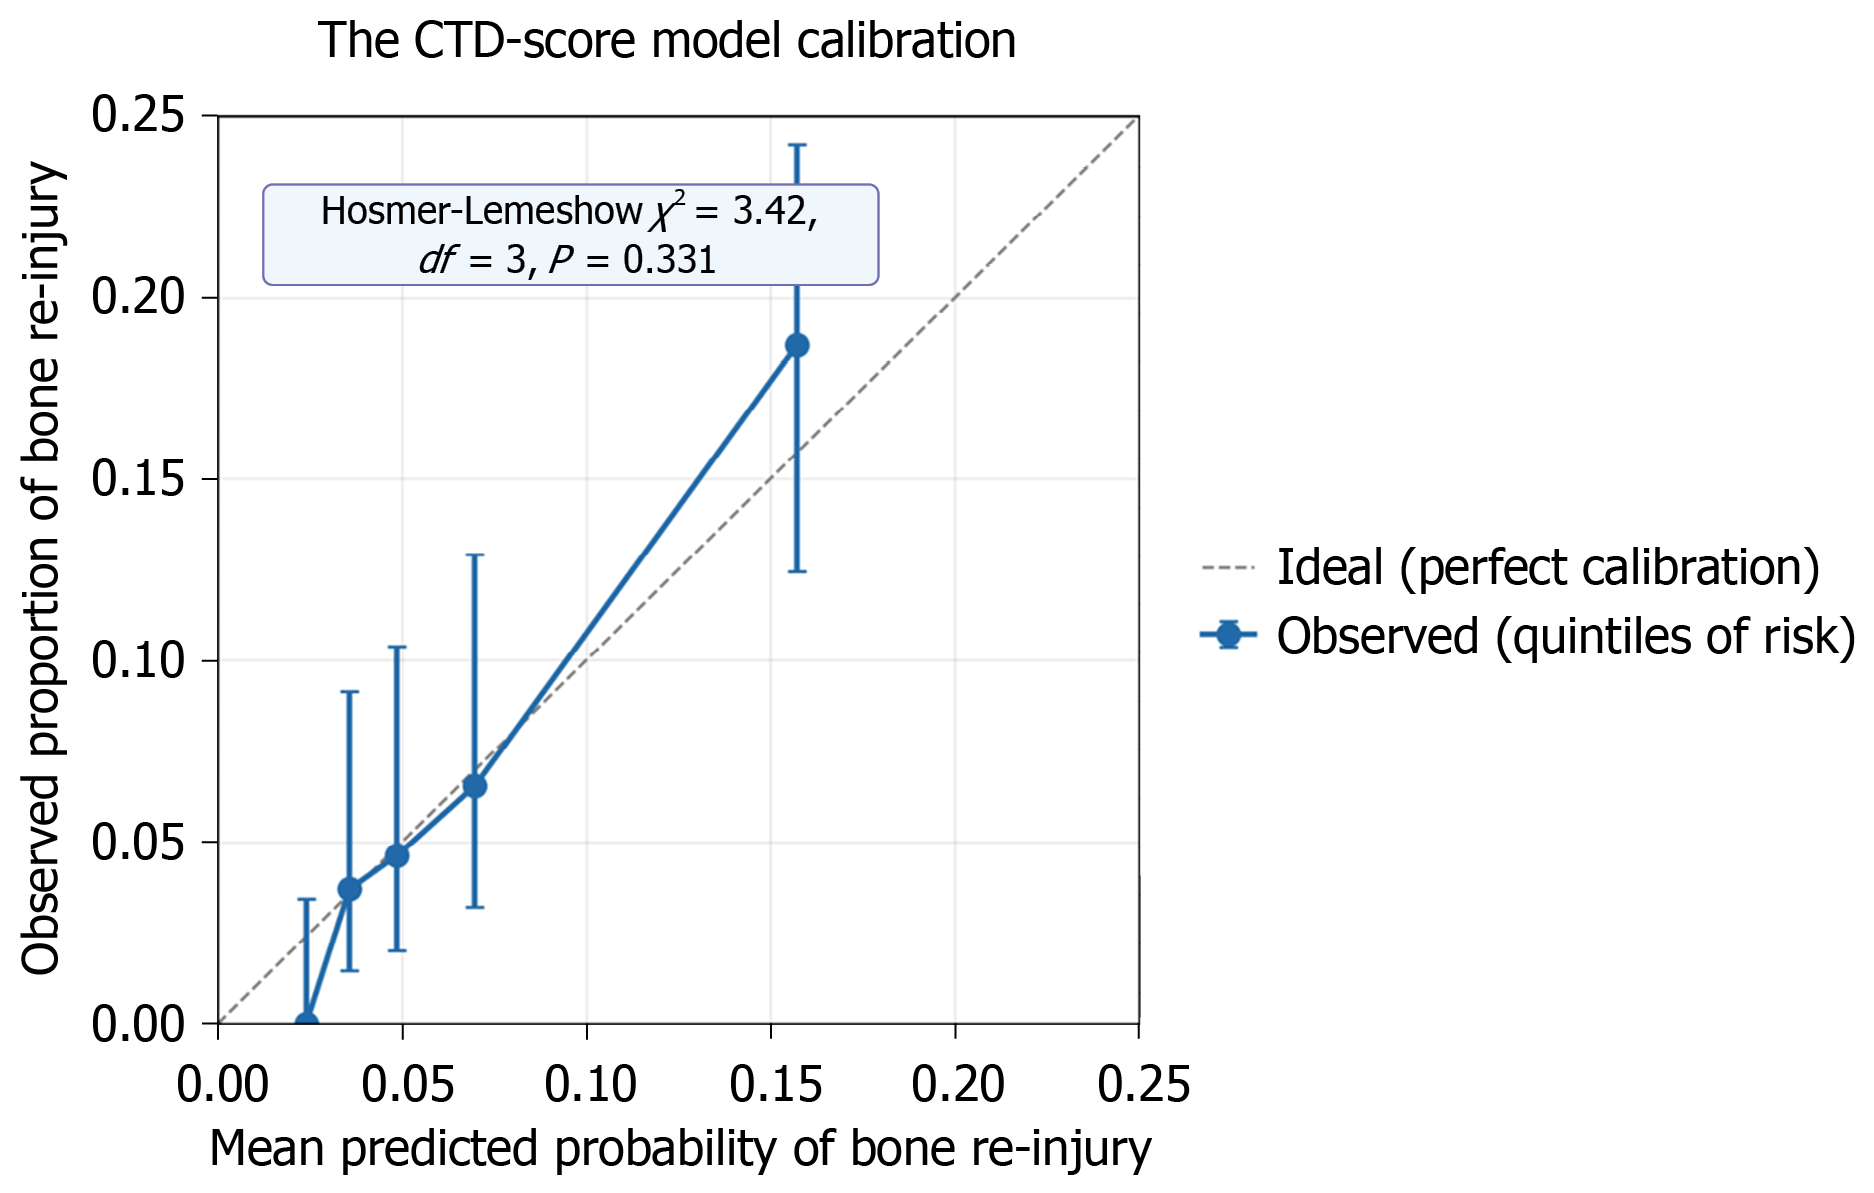
Figure 6 Calibration of the connective tissue dysplasia score model.
CTD: Connective tissue dysplasia.
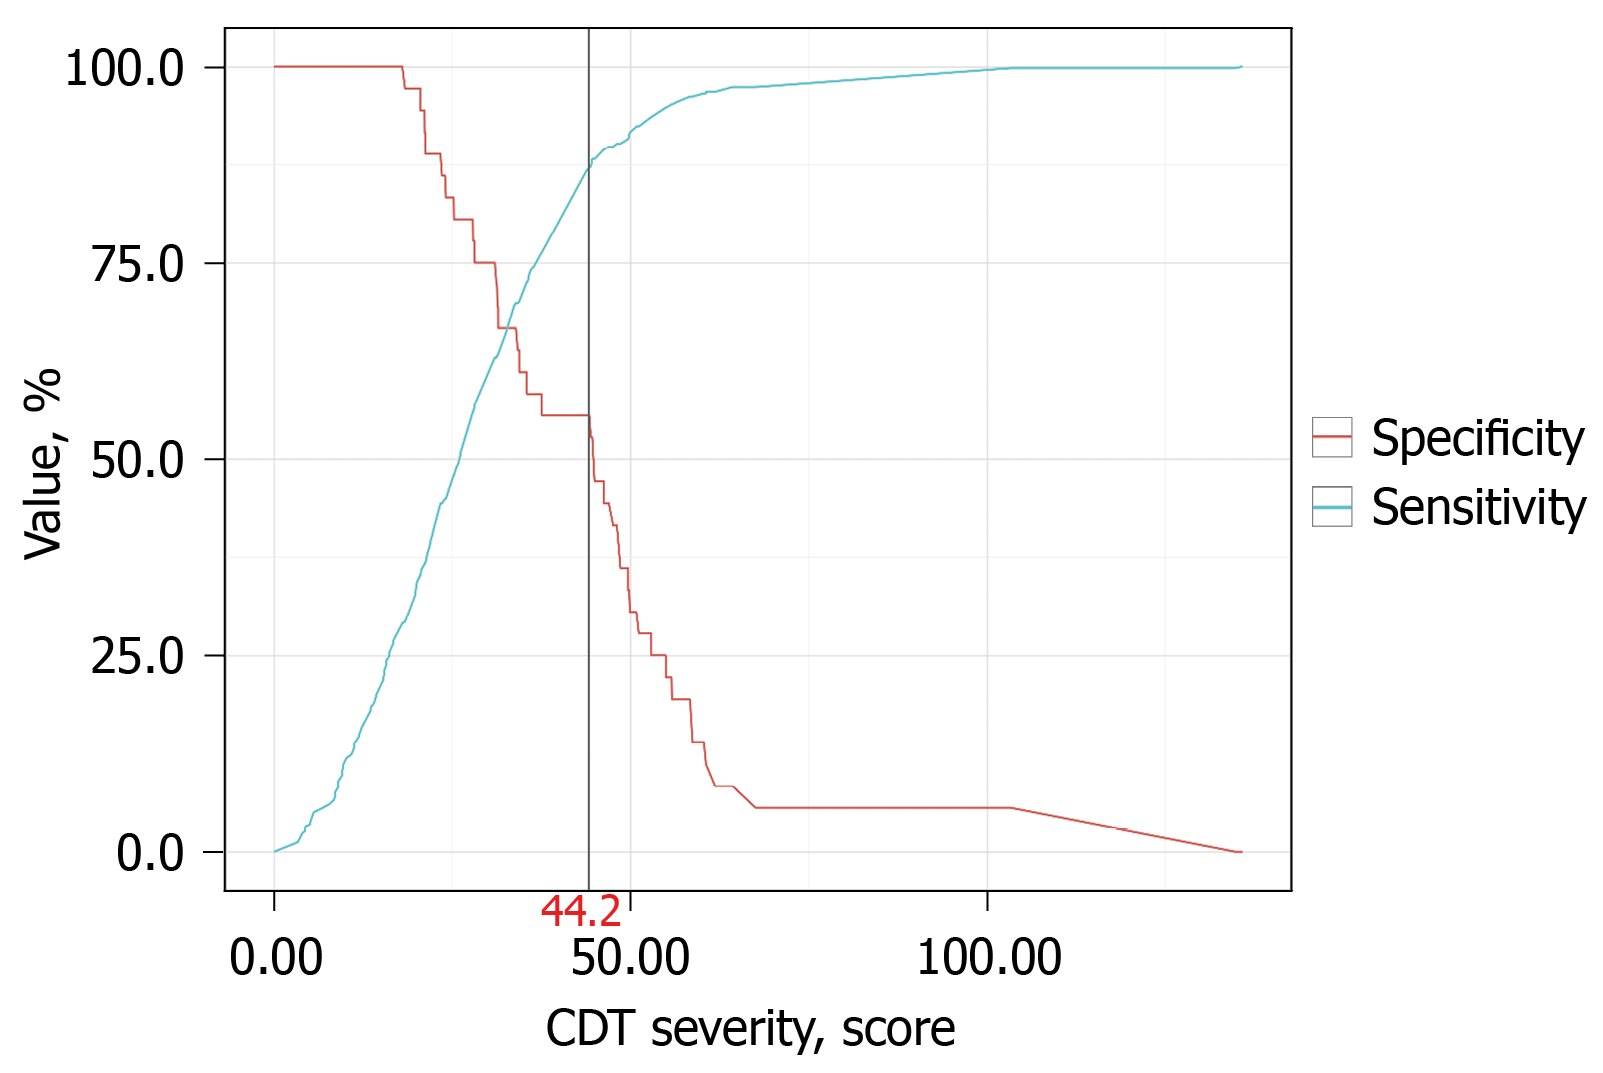
Figure 7
Analysis of model sensitivity and specificity depending on threshold values estimating the risk of predisposition to bone injury.
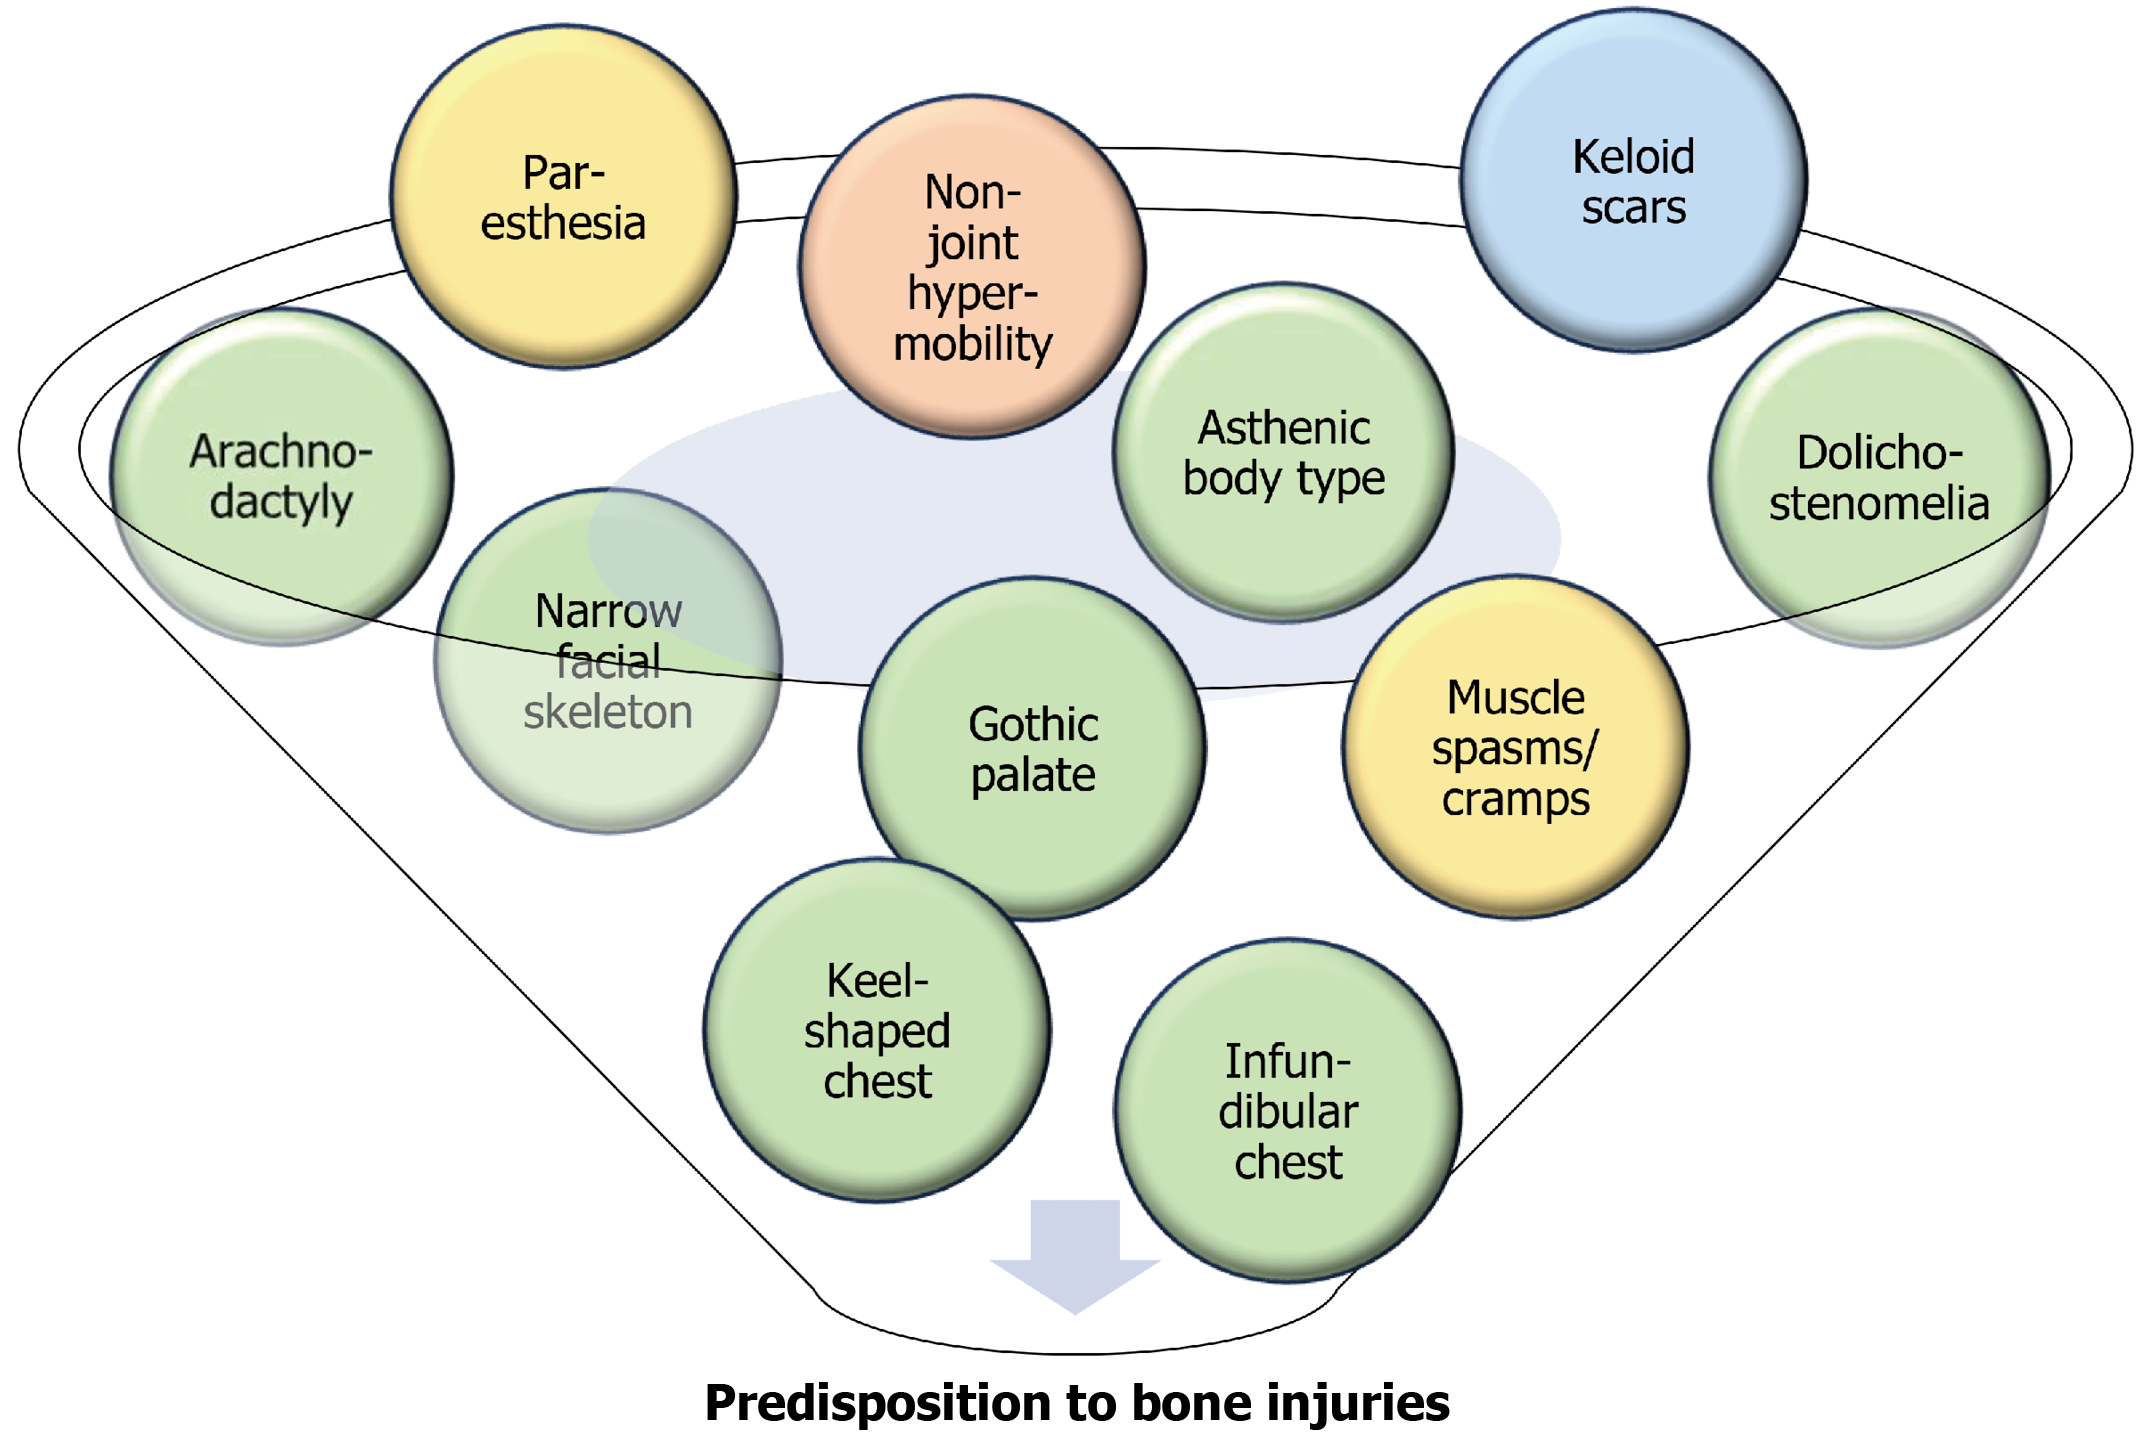
Figure 8 The dysplastic features characteristic of recurrent bone injury.
The dysplastic phenotype of individuals predisposed to bone re-injury was characterized by a predominance of ten dysplastic signs, including gothic palate, narrow facial skeleton, dolichostenomelia, arachnodactyly, chest deformities (infundibular or keel-shaped), non-joint hypermobility, keloid scars, limb paresthesia, and painful muscle spasms and cramps. The presence of each of these characteristic dysplastic features is significant and substantially increases the risk of developing the predisposition to bone injuries.
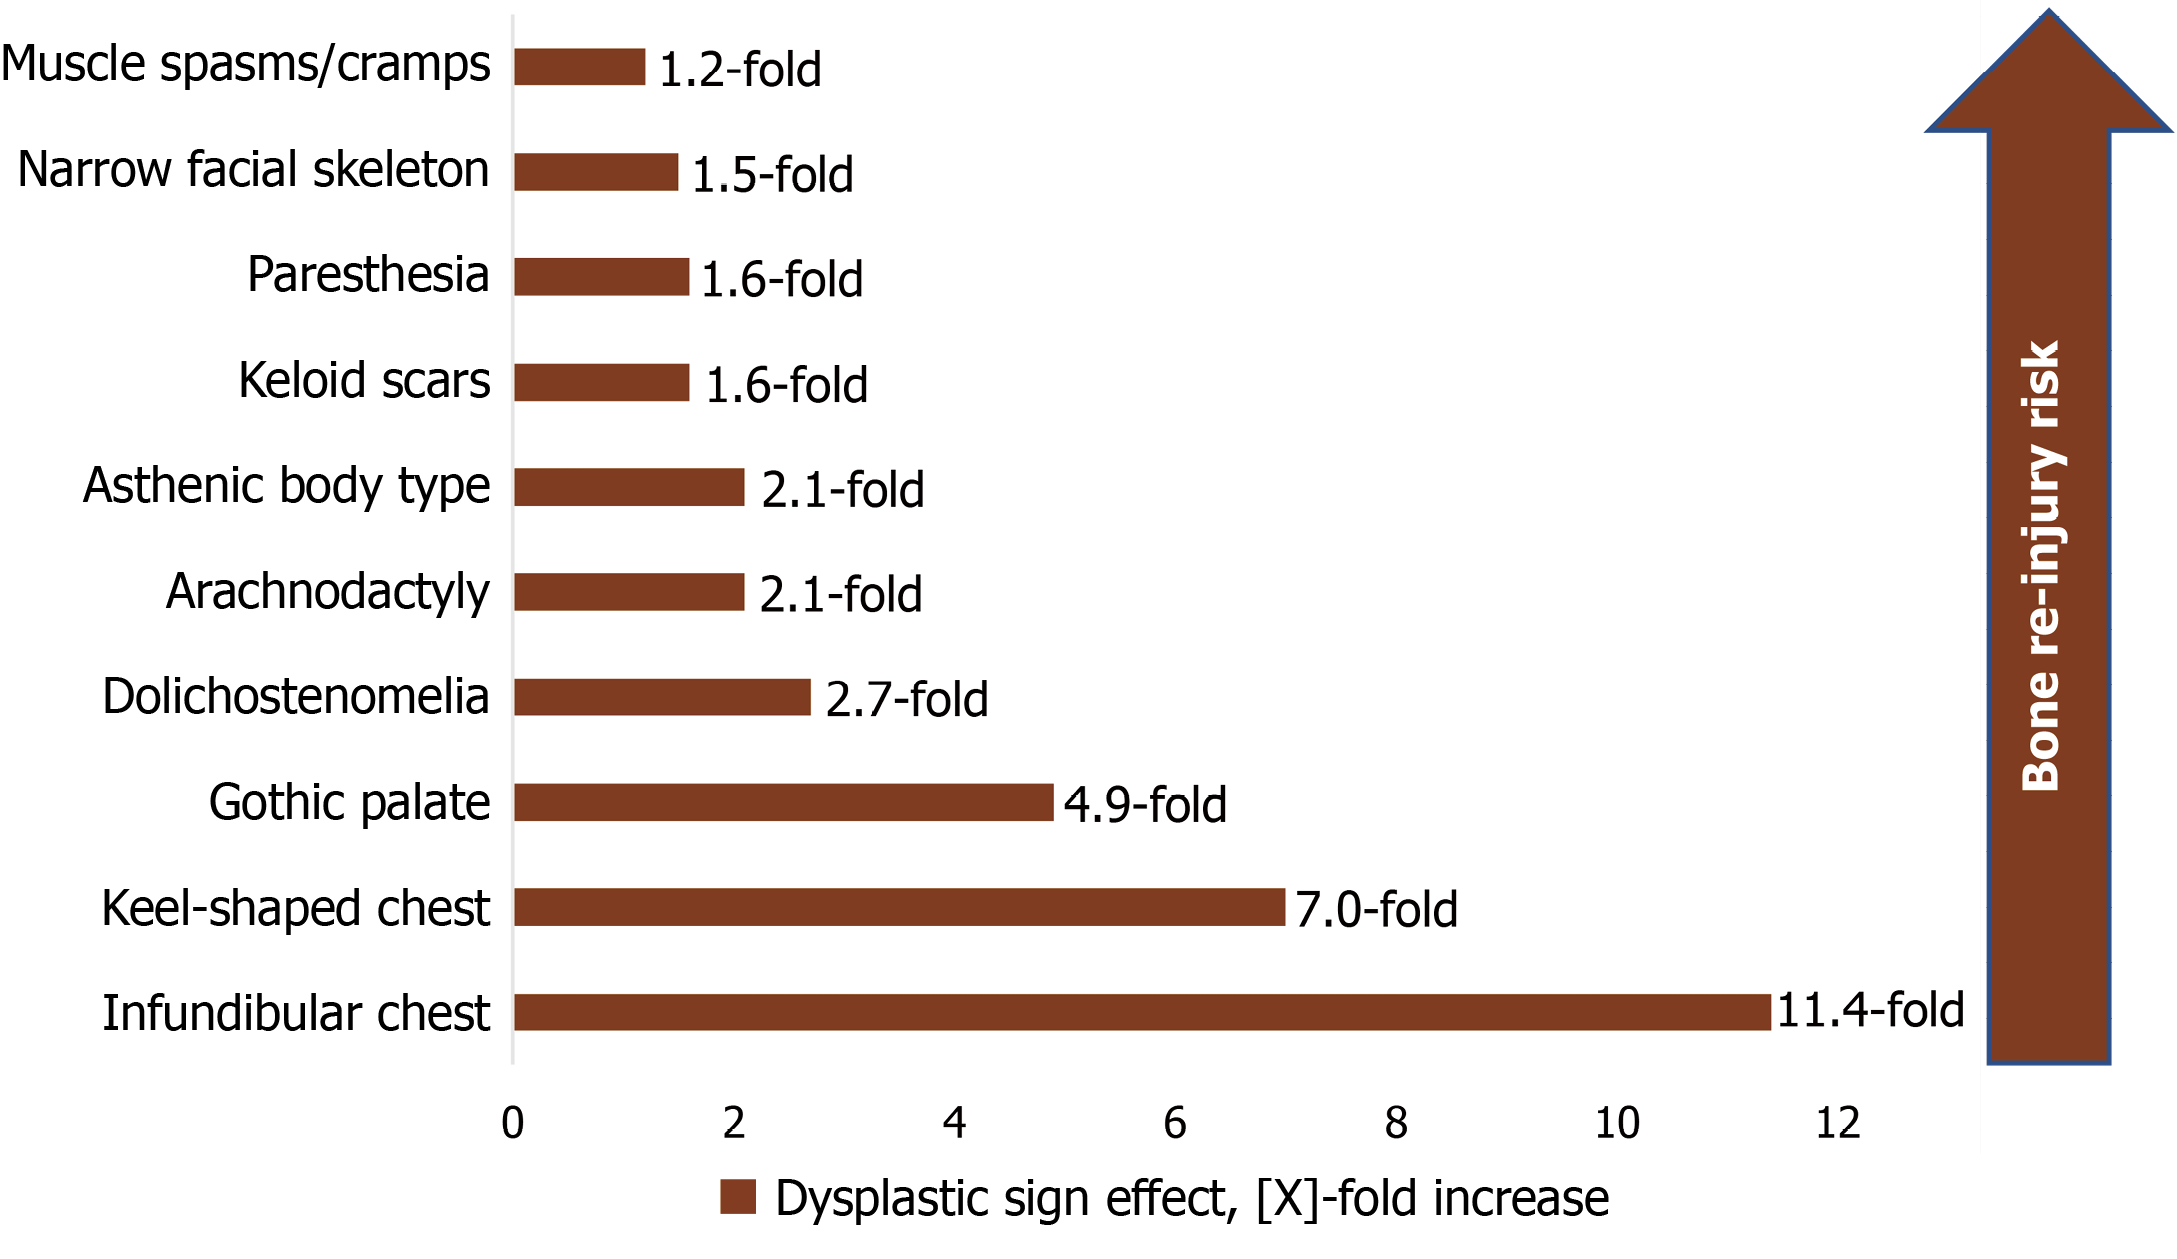
Figure 9
The Effect of characteristic dysplastic features on recurrent bone injury risk.
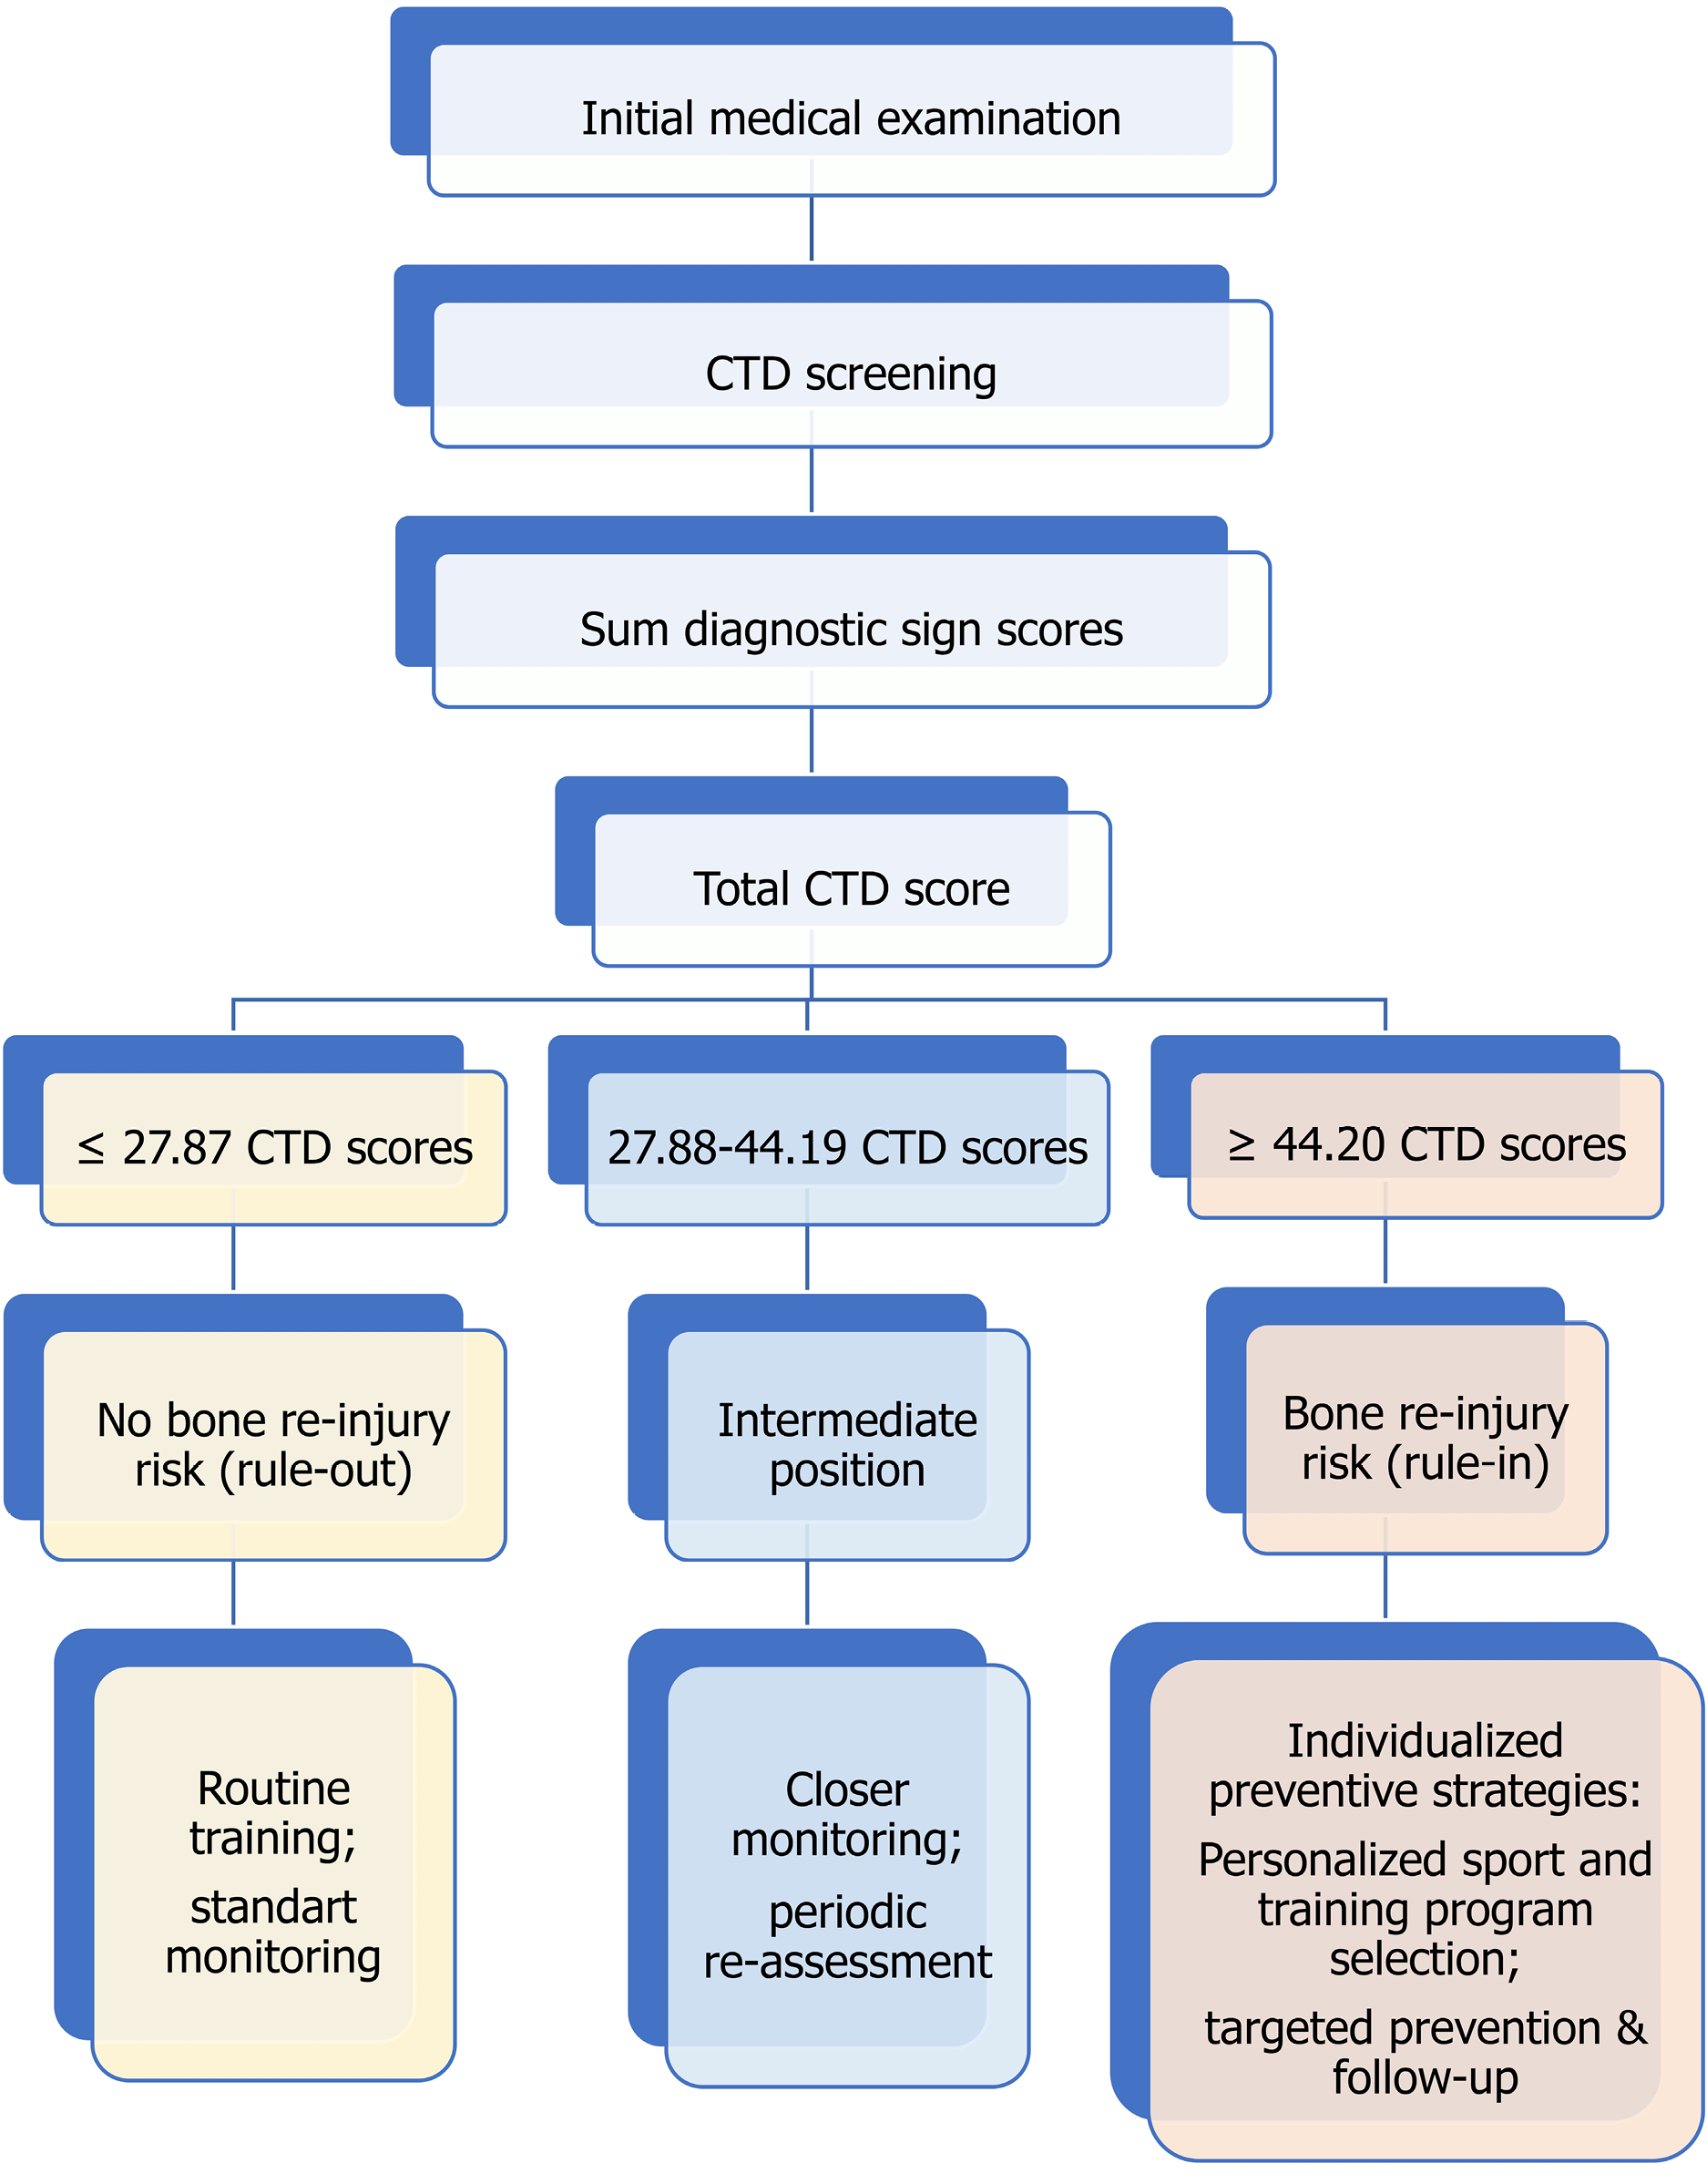
Figure 10 Clinical algorithm for identifying predisposition to bone injuries.
CTD: Connective tissue dysplasia.
- Citation: Sankova MV, Achkasov EE, Nikolenko VN, Oganesyan MV, Rizaeva NA, Sankov AV, Pires LAS, Zharikova TS, Zharikov YO. New paradigms for identifying predisposition to bone injuries in young athletes: Significant keys for rapid diagnostics. World J Orthop 2026; 17(8): 123460
- URL: https://www.wjgnet.com/2218-5836/full/v17/i8/123460.htm
- DOI: https://dx.doi.org/10.5312/wjo.123460