Copyright
©The Author(s) 2025.
World J Orthop. Mar 18, 2025; 16(3): 101841
Published online Mar 18, 2025. doi: 10.5312/wjo.v16.i3.101841
Published online Mar 18, 2025. doi: 10.5312/wjo.v16.i3.101841
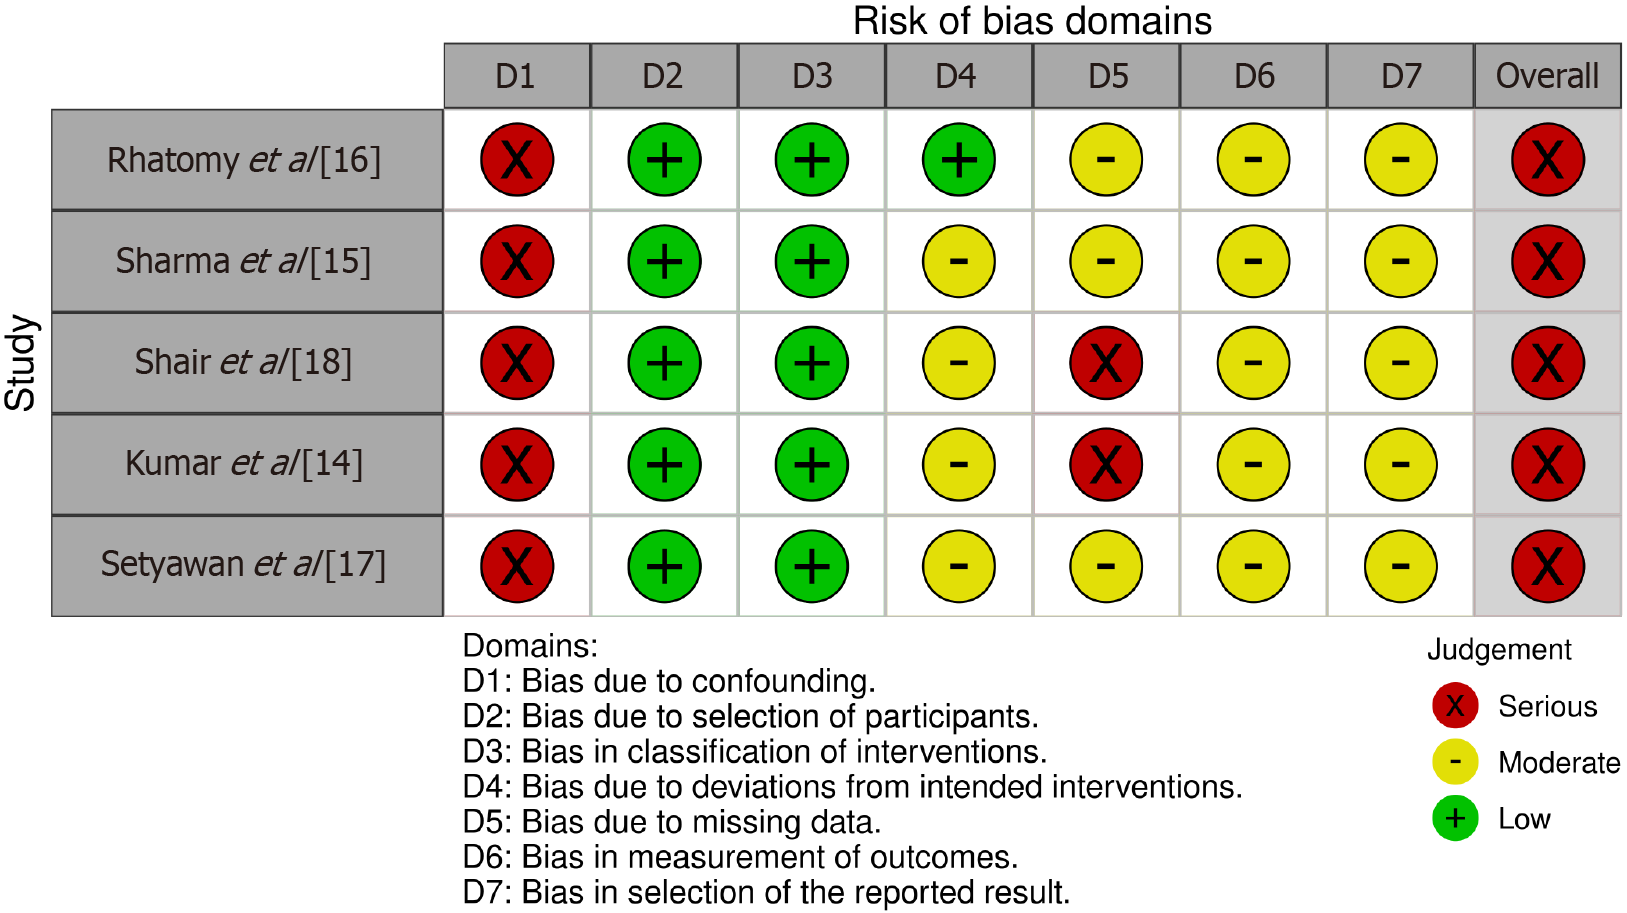
Figure 1 Quality assessment using Risk of Bias in Non-randomized Studies-of Interventions tool for non-randomized clinical trials.
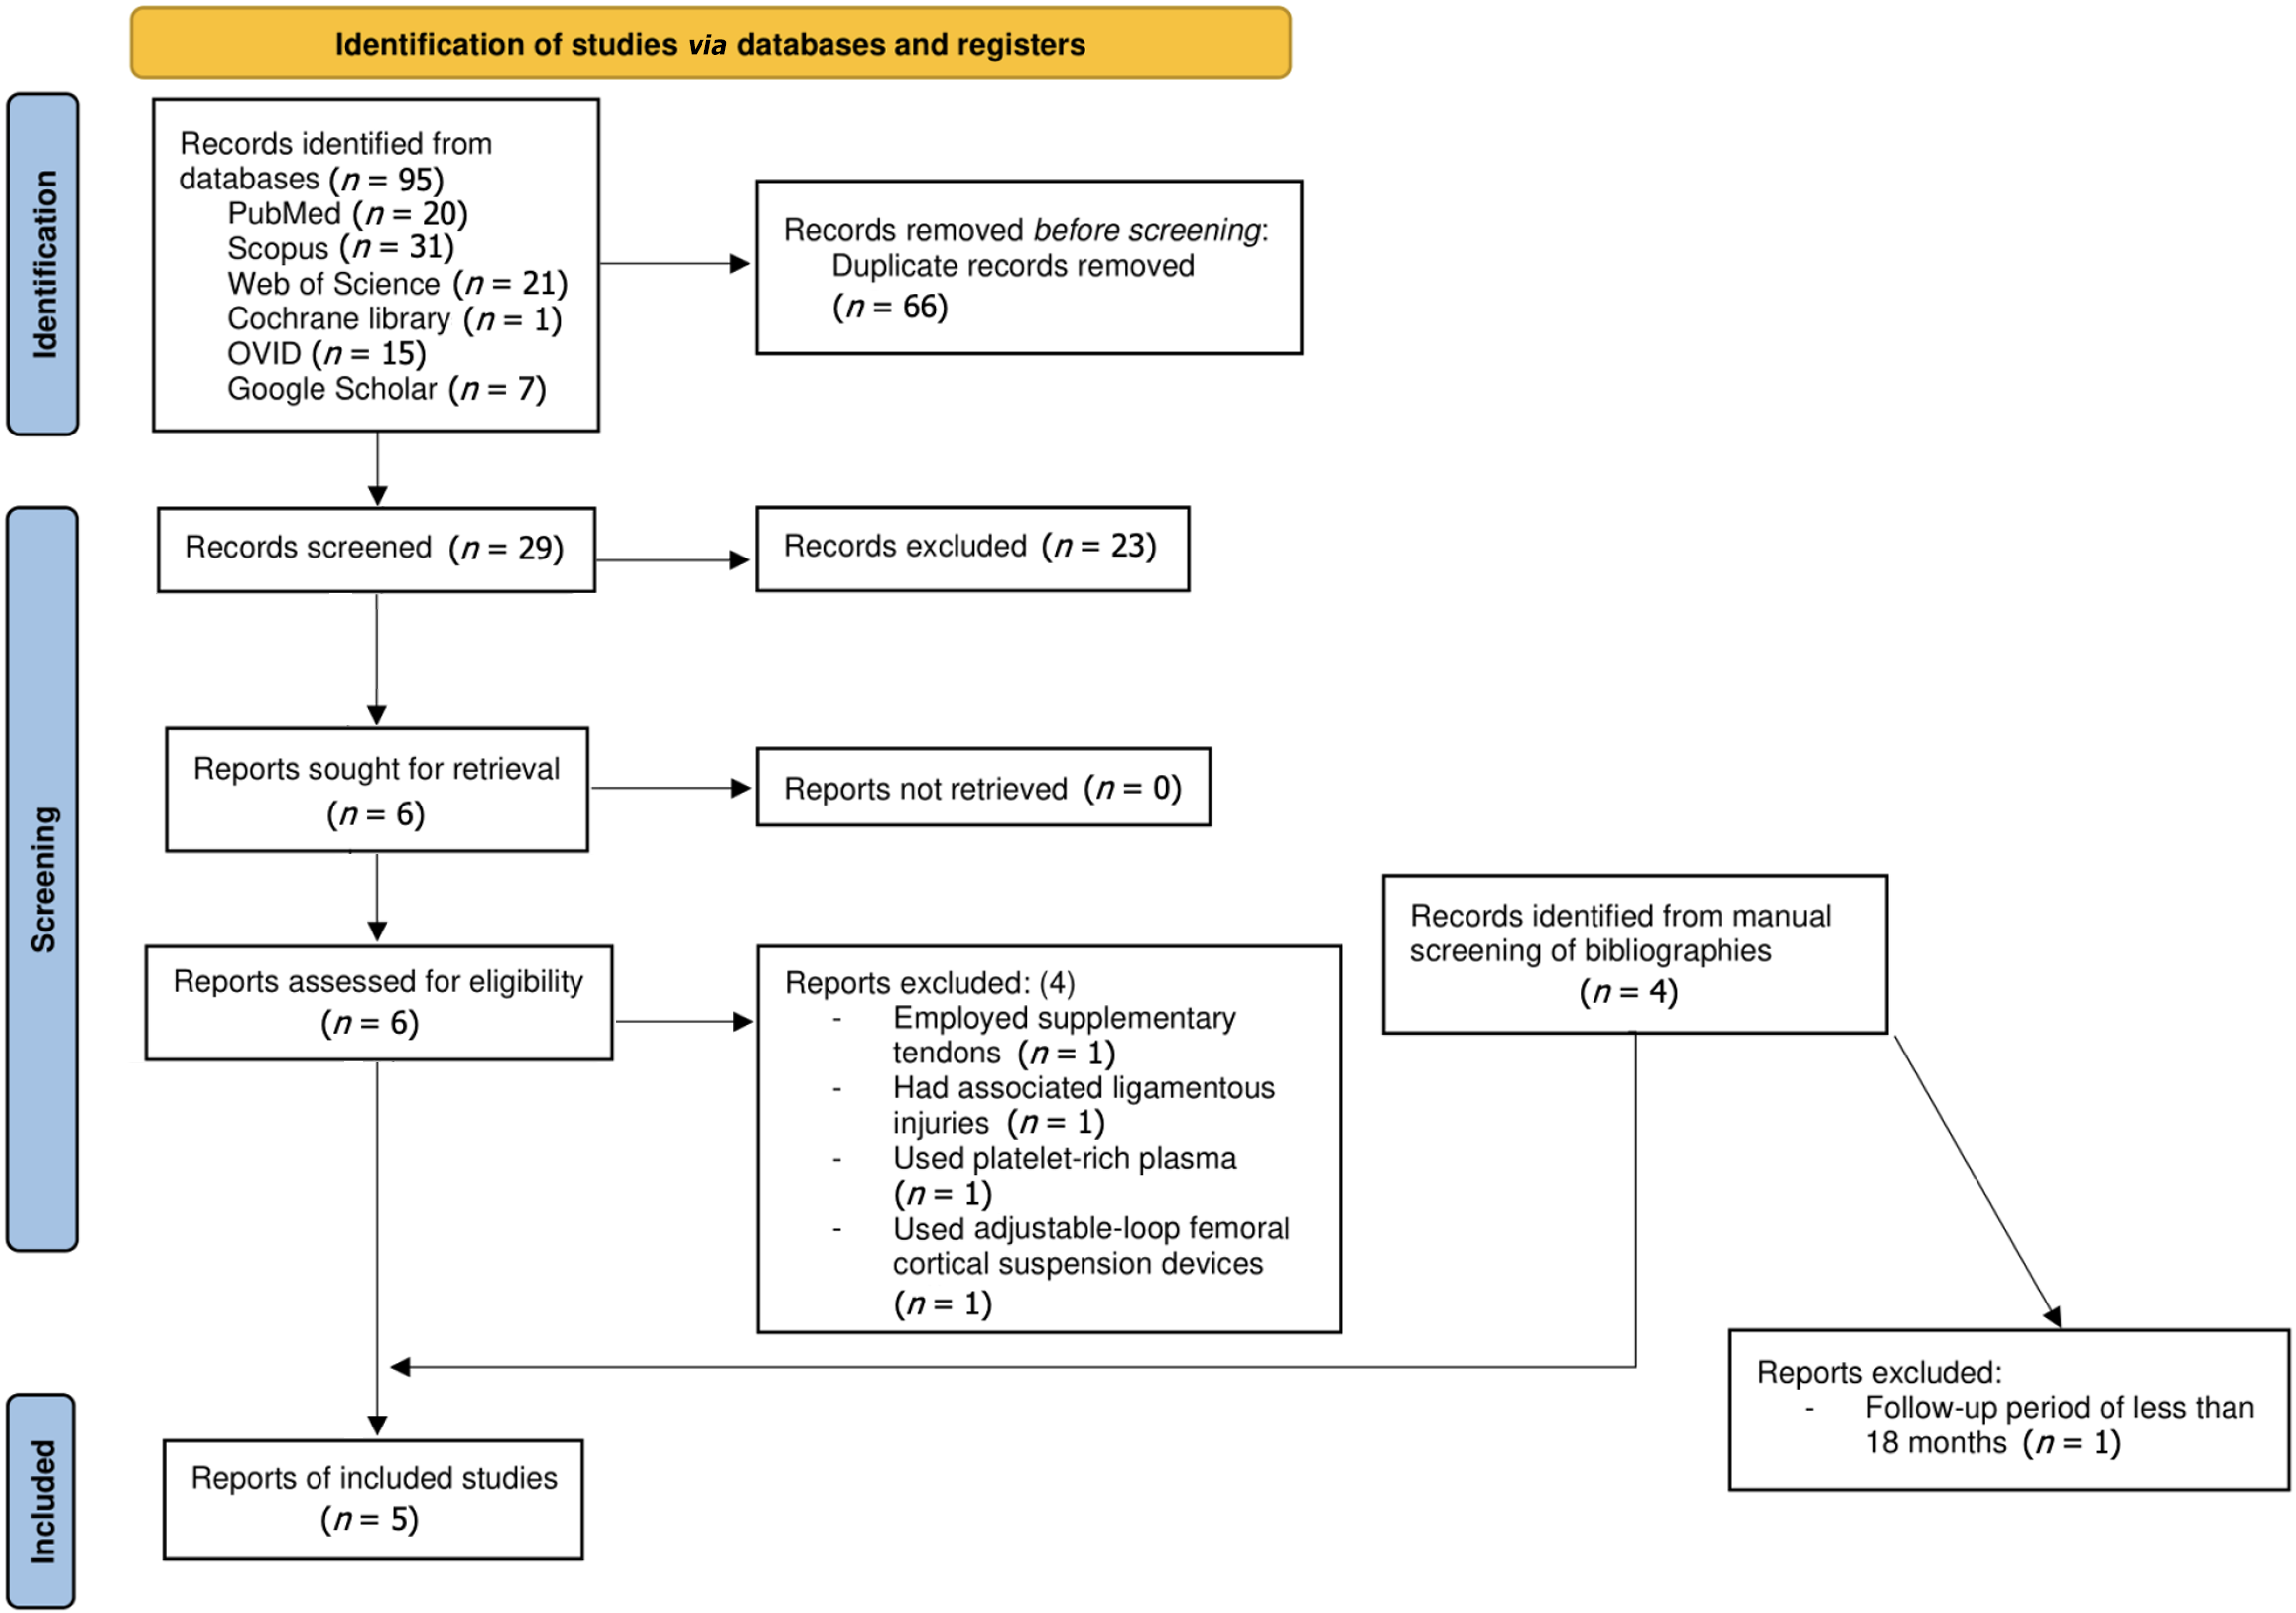
Figure 2 Flow chart of the literature search.
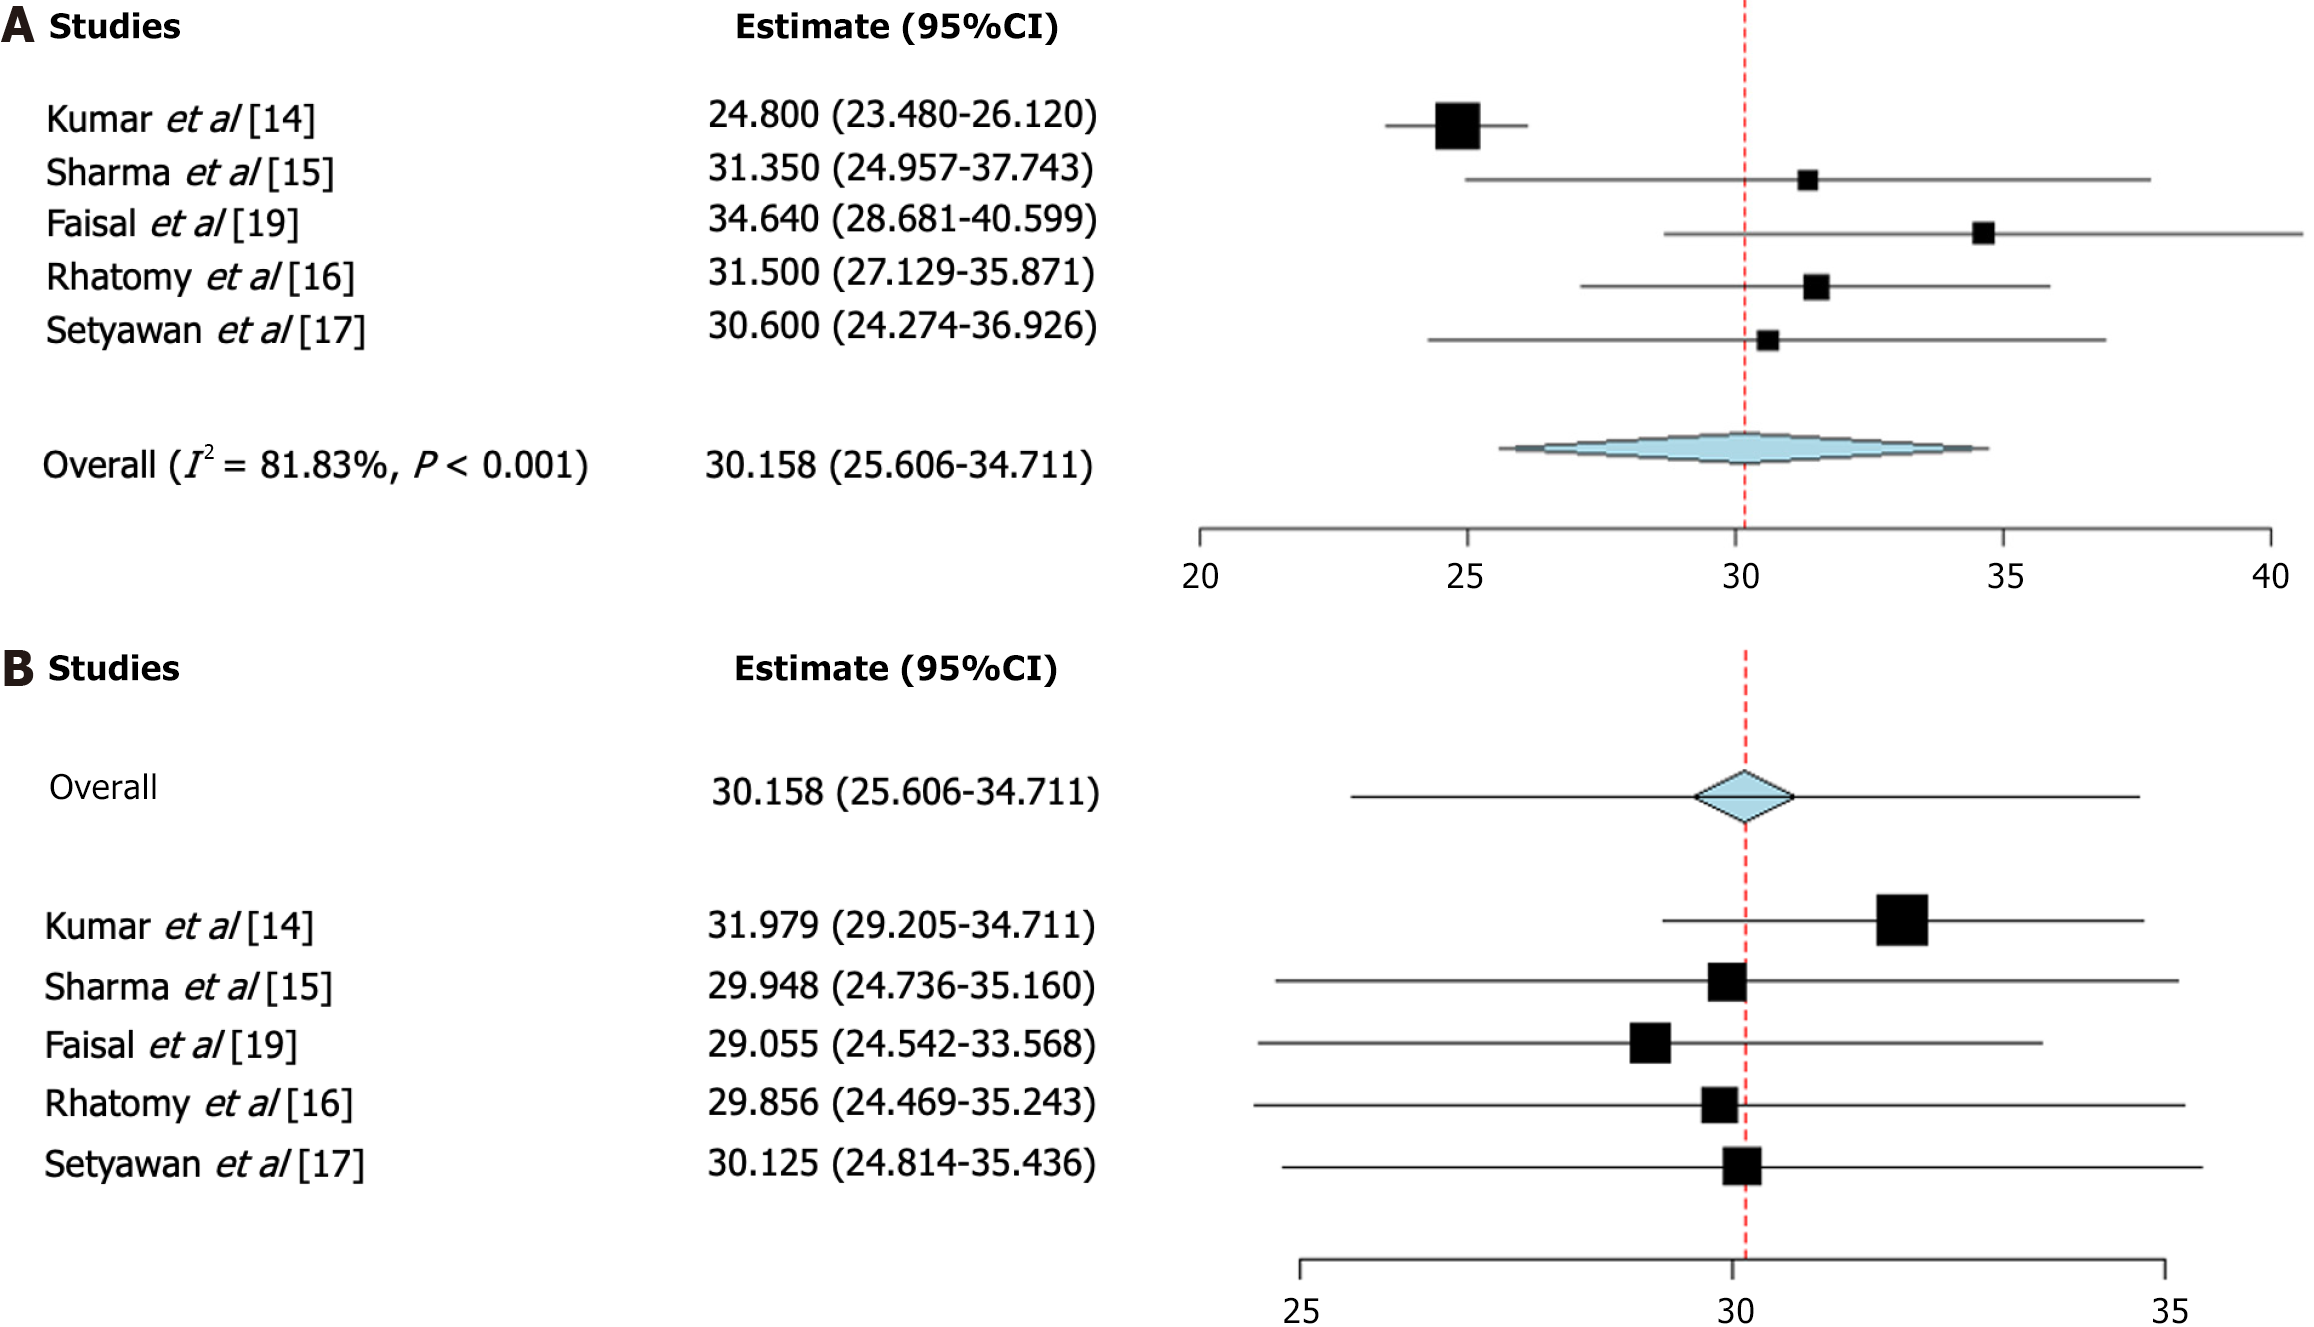
Figure 3 Forest plot and leave-one-out test for International Knee Documentation Committee score.
A: Forest plot for International Knee Documentation Committee (IKDC) score change outcome; B: Leave-one-out test for IKDC score change outcome.
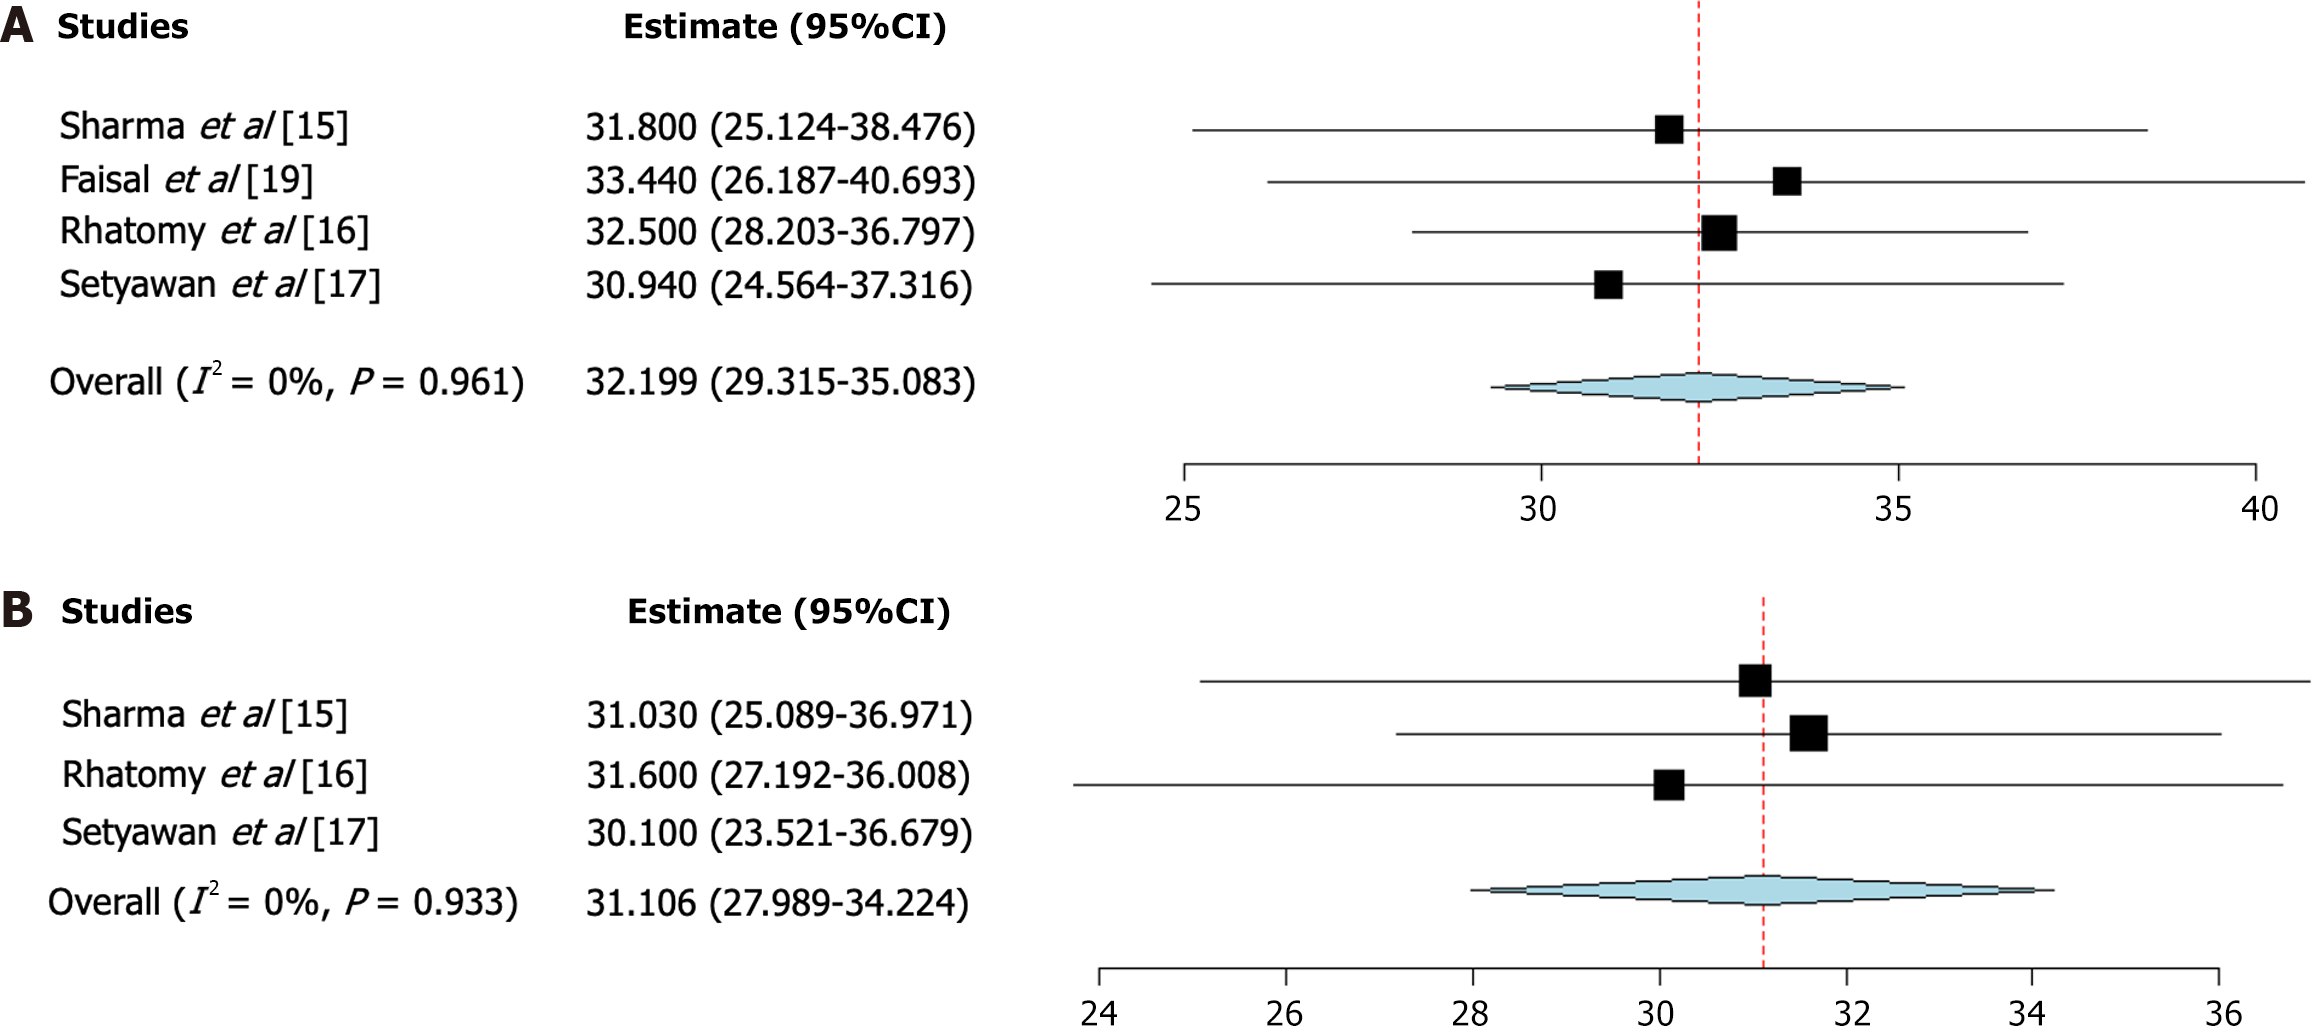
Figure 4 Forest plot for lysholm Score and modified cincinnati score change outcome.
A: Forest plot for Lysholm Score change outcome; B: Forest plot for modified cincinnati score change outcome.
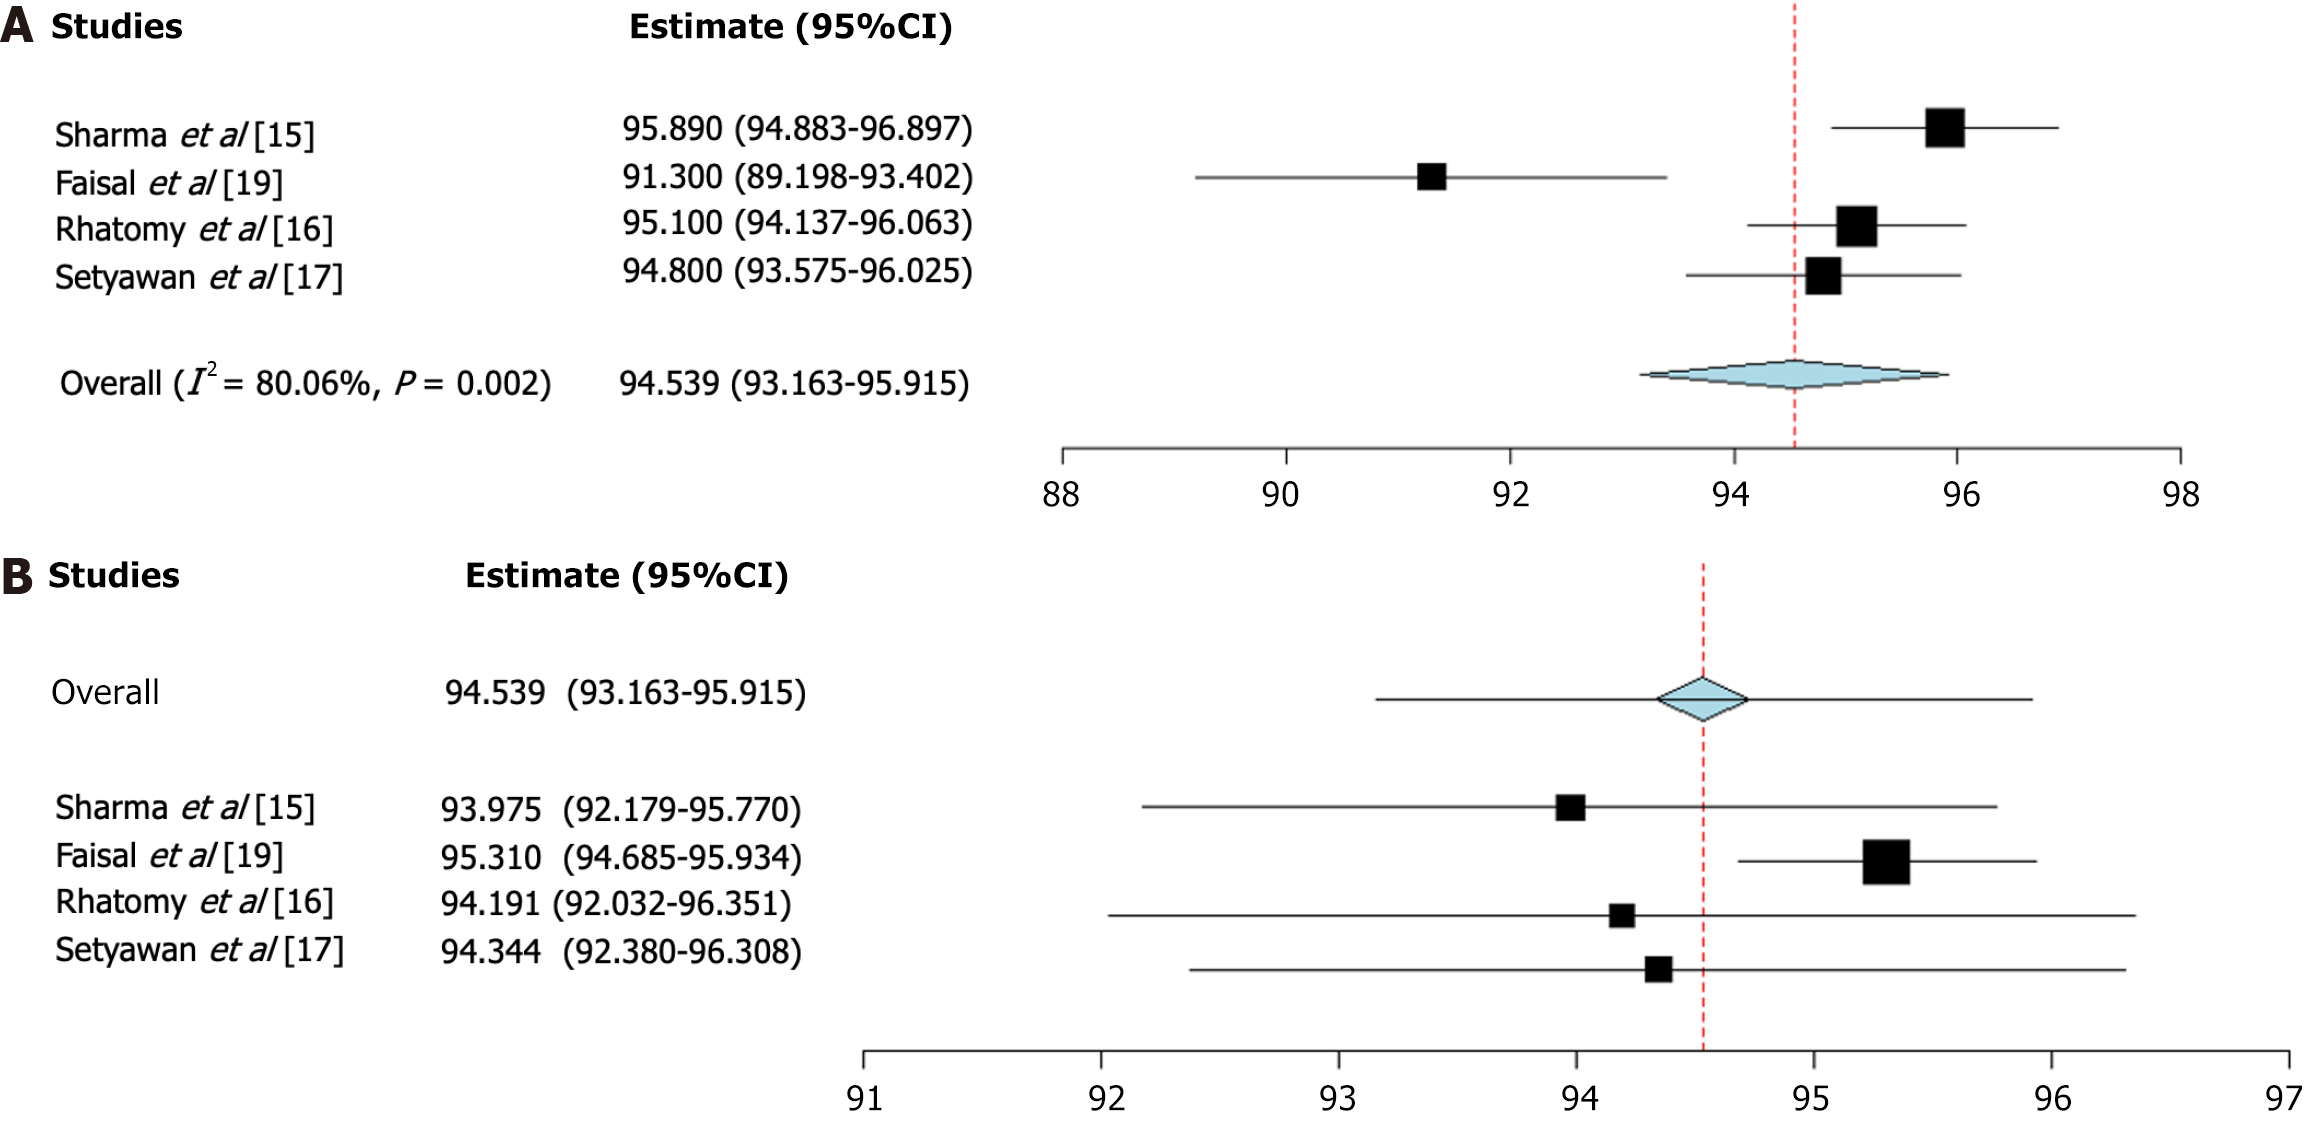
Figure 5 Forest plot and leave-one-out test for postoperative American Orthopaedic Foot and Ankle Society.
A: Forest plot for postoperative American Orthopaedic Foot and Ankle Society (AOFAS) score outcome; B: Leave-one-out test for postoperative AOFAS score outcome.
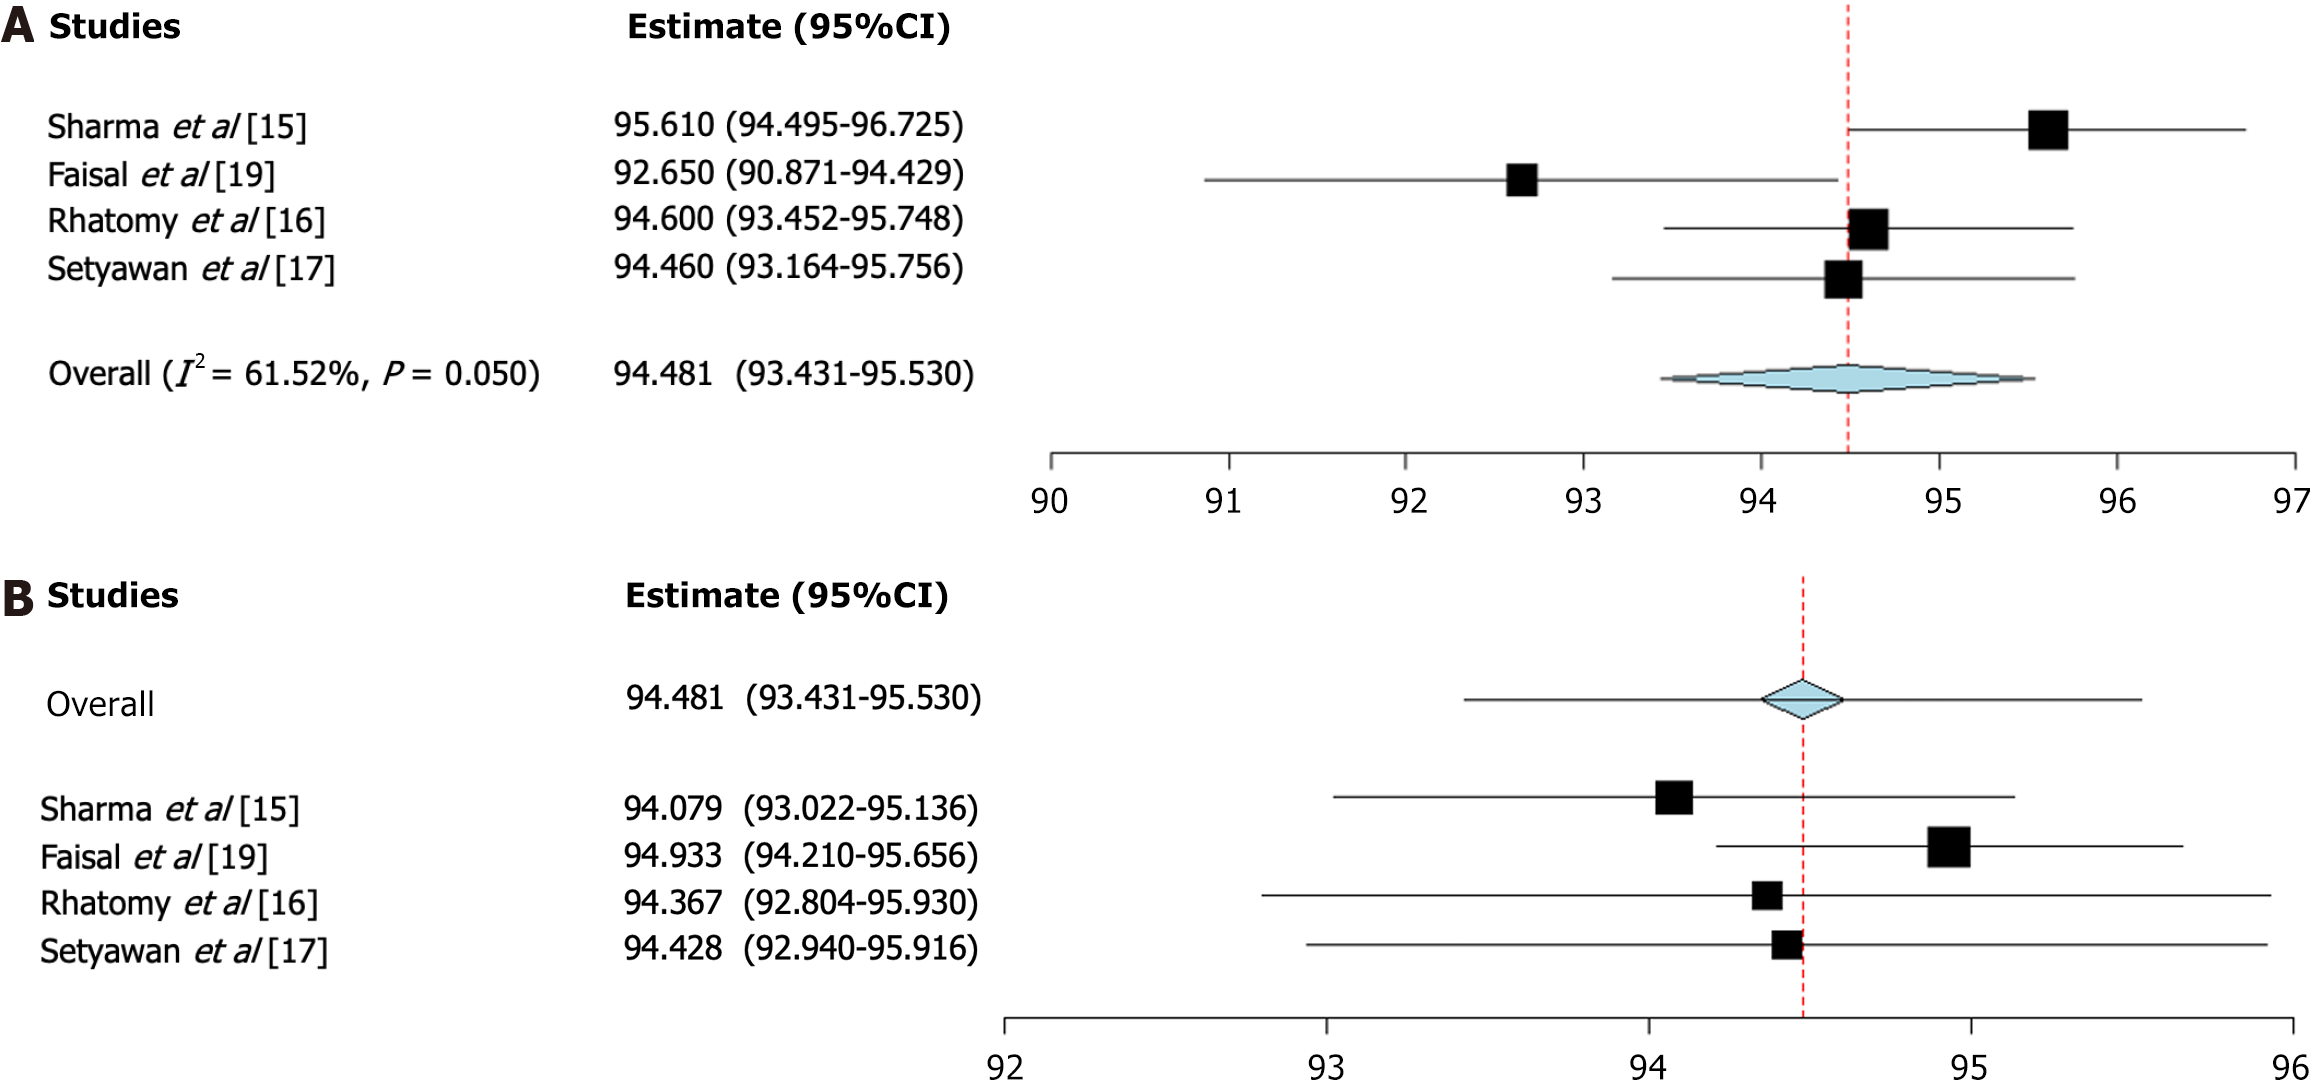
Figure 6 Forest plot and leave-one-out test for postoperative Foot and Ankle Disability Index score.
A: Forest plot for postoperative Foot and Ankle Disability Index (FADI) score outcome; B: Leave-one-out test for postoperative FADI score outcome.
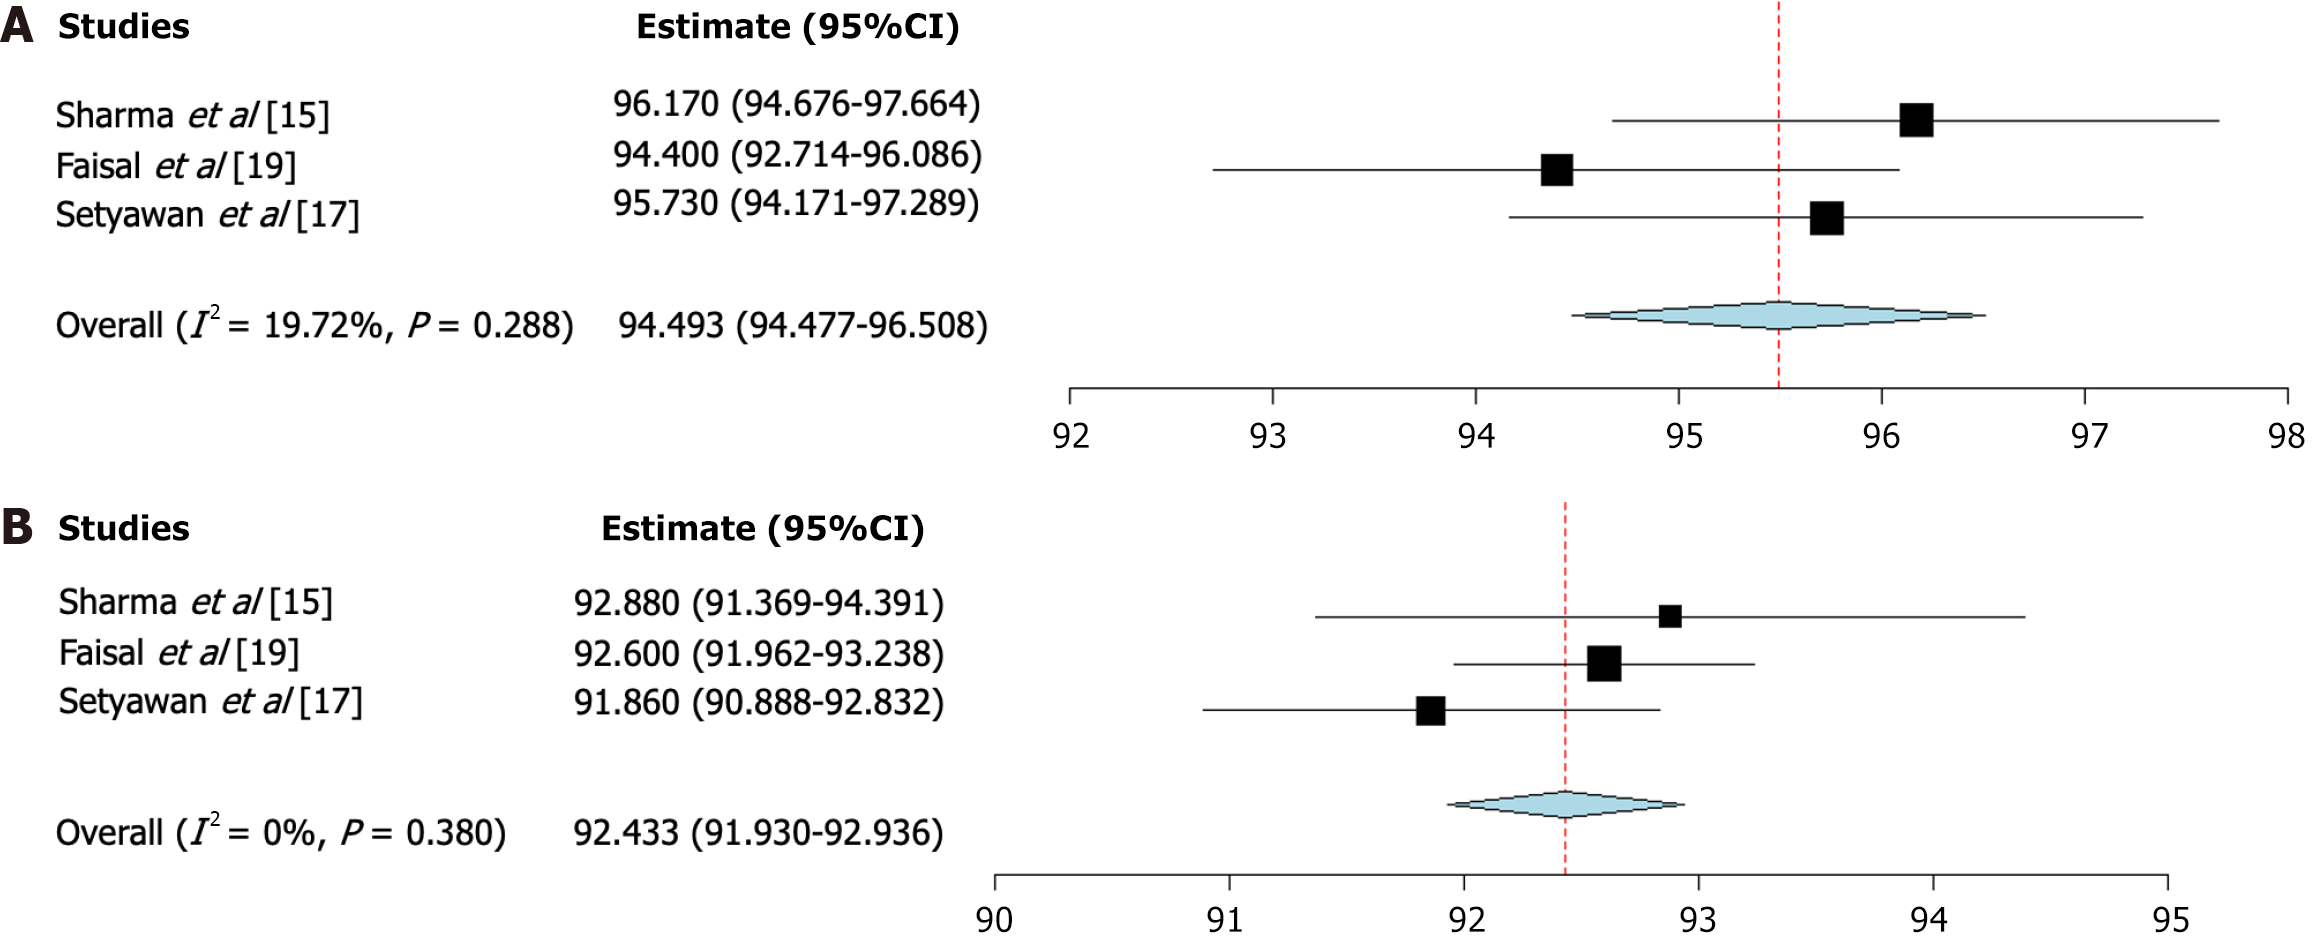
Figure 7 Forest plot for postoperative single-hop test score and postoperative triple-hop test score.
A: Forest plot for postoperative single-hop test score outcome; B: Forest plot for postoperative triple-hop test score outcome.
Figure 8 Forest plot.
A: Forest plot for postoperative thigh circumferences at 10 cm proximal to upper patellar bone in the injury side versus the healthy contralateral side; B: Forest plot for postoperative thigh circumferences at 20 cm proximal to upper patellar bone in the injury side versus the contralateral healthy side.
- Citation: Yousif Mohamed AM, Salih M, Mohamed M, Abbas AE, Elsiddig M, Abdelsalam M, Elhag B, Mohamed N, Ahmed S, Omar D, Ahmed S, Mohamed D. Functional outcomes of peroneus longus tendon autograft for posterior cruciate ligament reconstruction: A meta-analysis. World J Orthop 2025; 16(3): 101841
- URL: https://www.wjgnet.com/2218-5836/full/v16/i3/101841.htm
- DOI: https://dx.doi.org/10.5312/wjo.v16.i3.101841


