©The Author(s) 2024.
World J Orthop. Jan 18, 2024; 15(1): 73-93
Published online Jan 18, 2024. doi: 10.5312/wjo.v15.i1.73
Published online Jan 18, 2024. doi: 10.5312/wjo.v15.i1.73
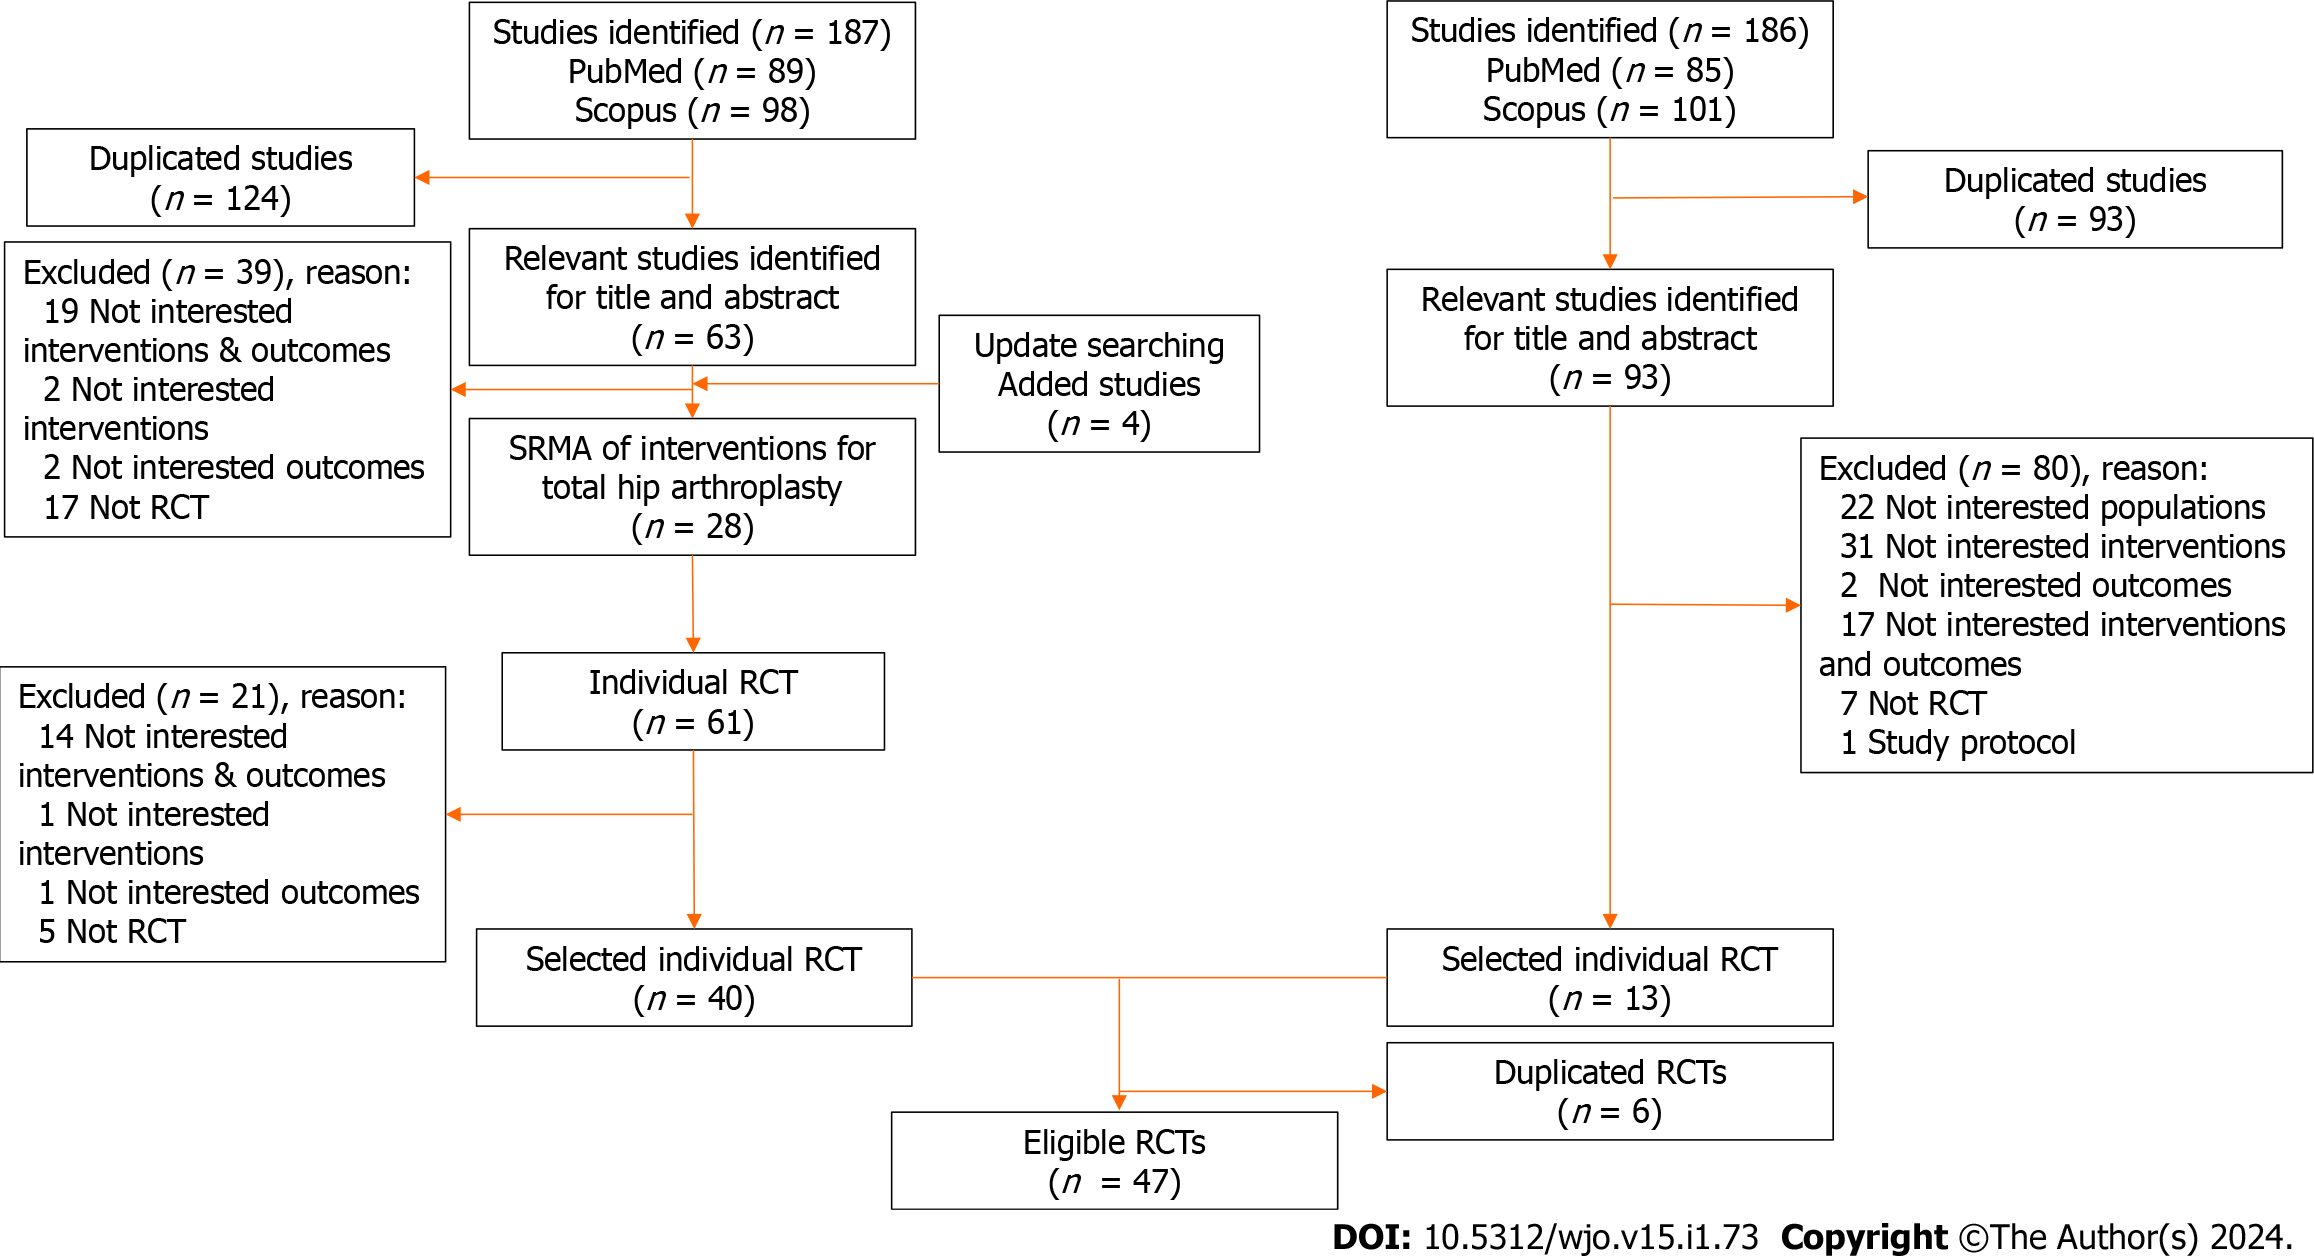
Figure 1 PRISMA flow diagram of the included studies.
RCT: Randomized controlled trial.
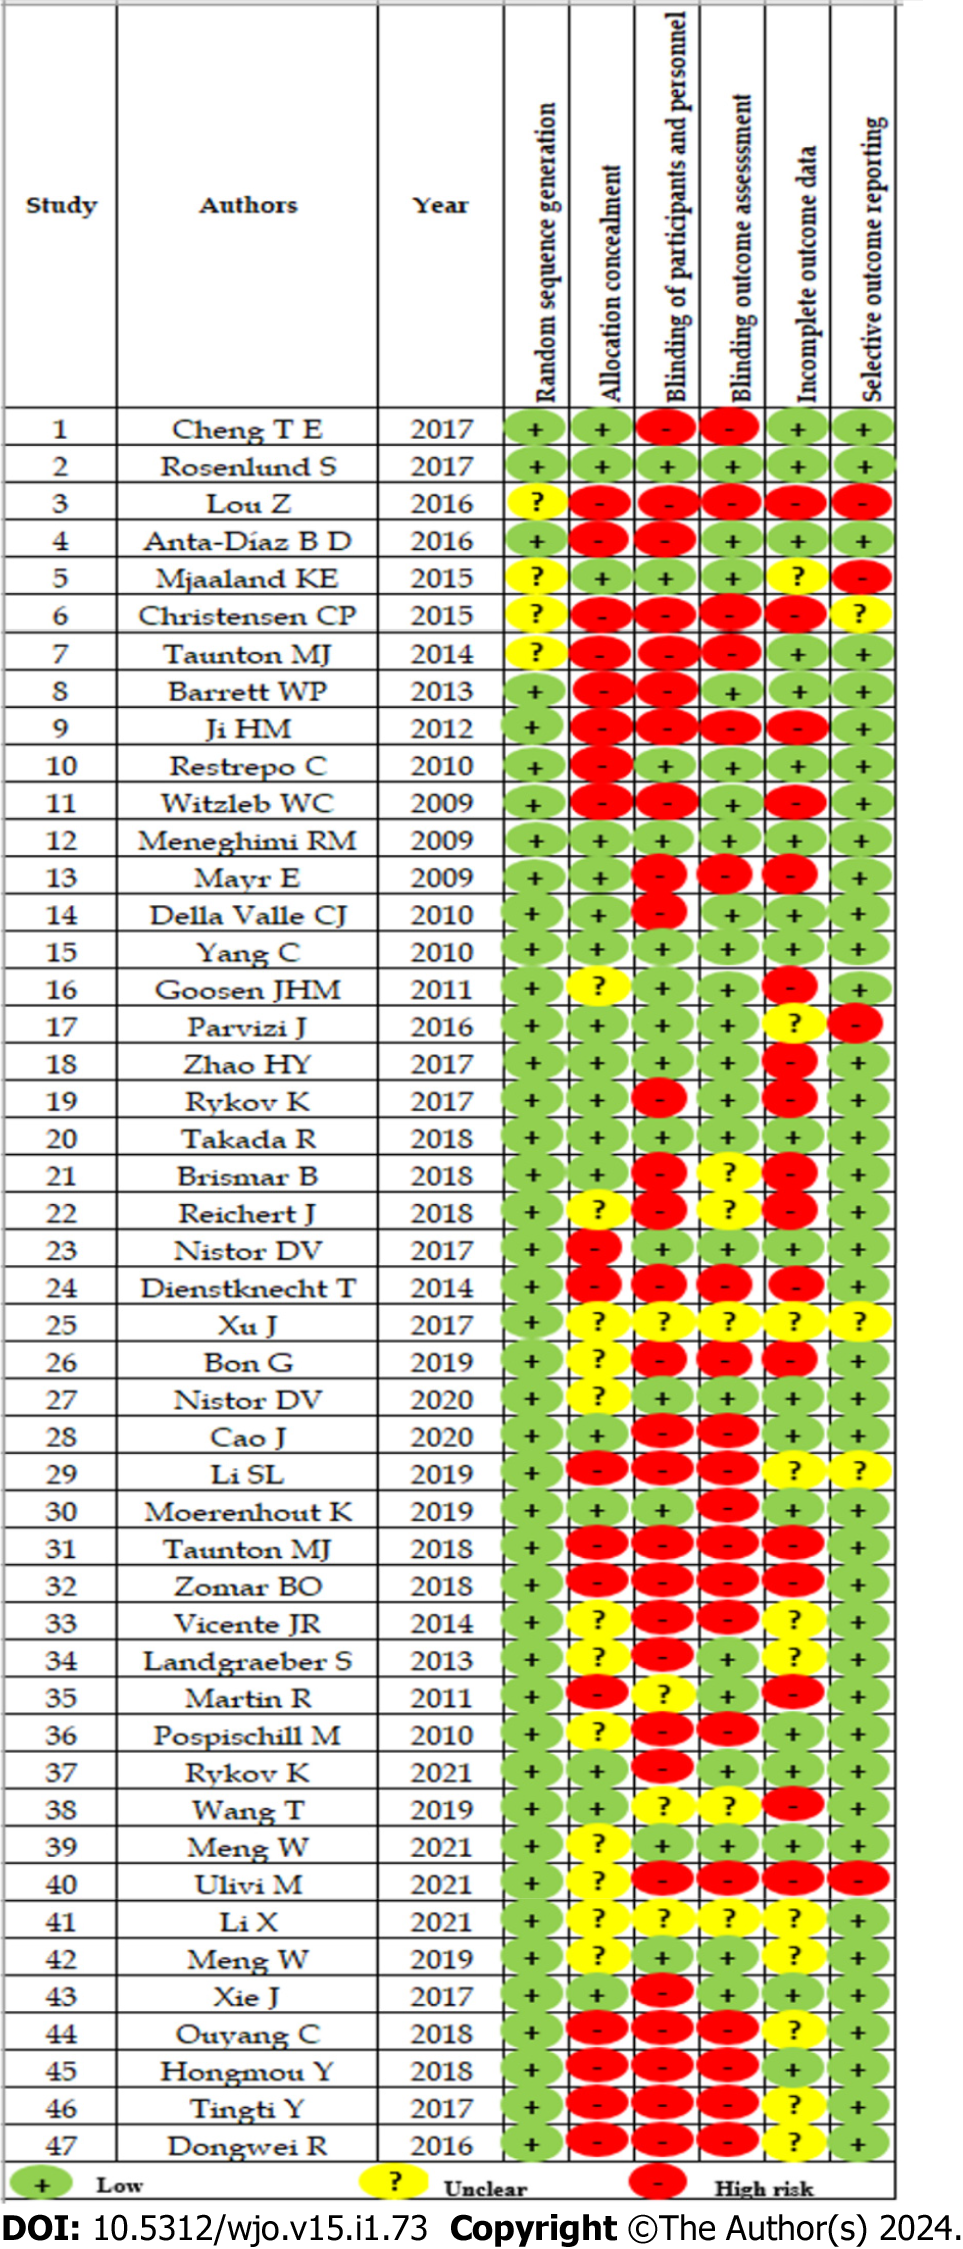
Figure 2 Risk of bias assessment of individual randomized controlled trial.
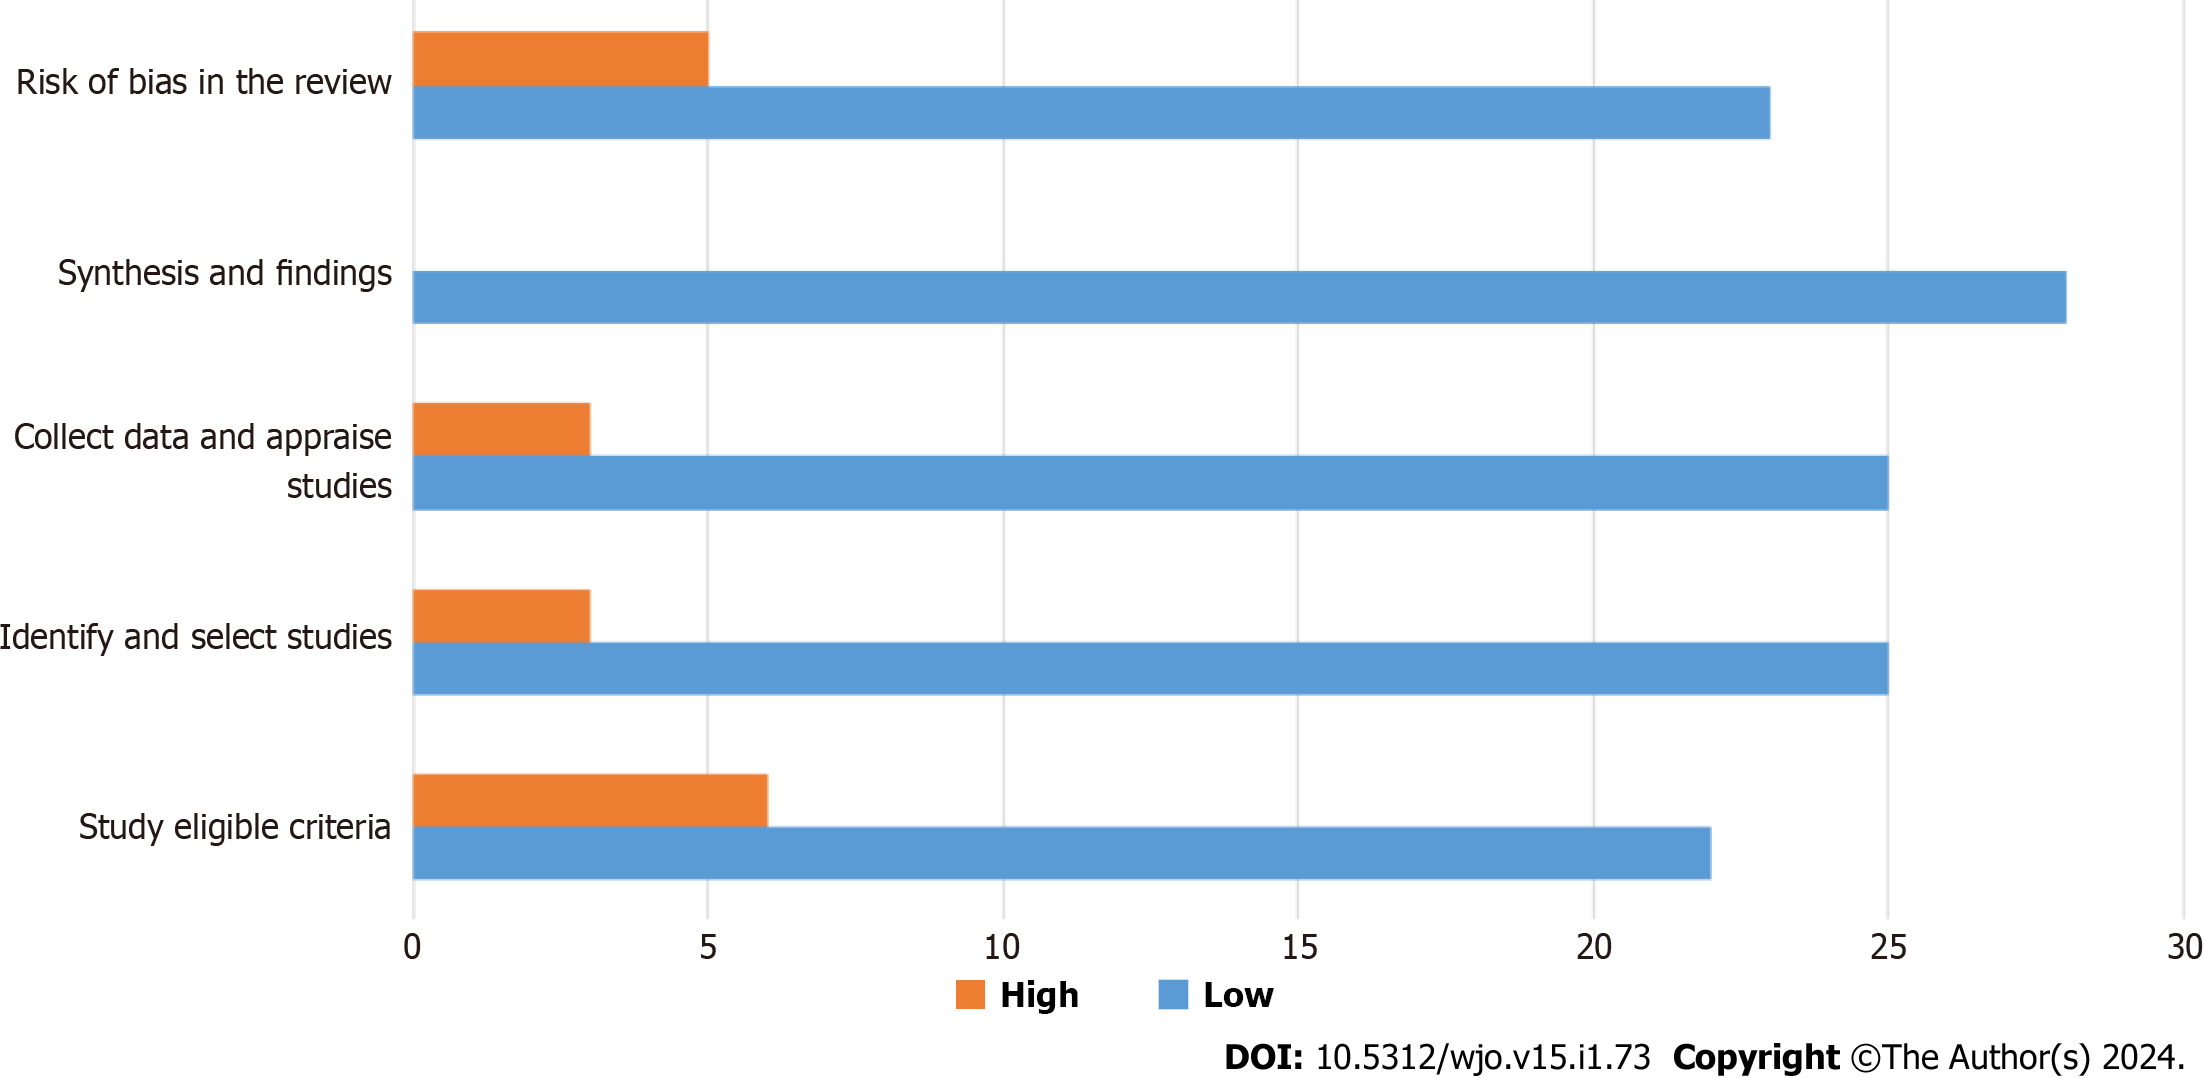
Figure 3 Chart of a Risk of Bias Assessment Tool for Systematic Reviews from multiple reviews.
Figure 4 Network map, the line’s width is proportional to the numbers of studies and the node size is proportional to the sample size.
Numbers along the lines refer to numbers of studies/numbers of patients corresponding to direct comparisons. HHS: Harris Hip Score; DAA: Direct anterior approach; LA: Lateral approach; PA: Posterior approach; DSA/SuperPath: Direct superior approach or Supercapsular percutaneously-assisted total hip; LMIS: Mini-lateral approach; 2-incision: 2 incisions approach.
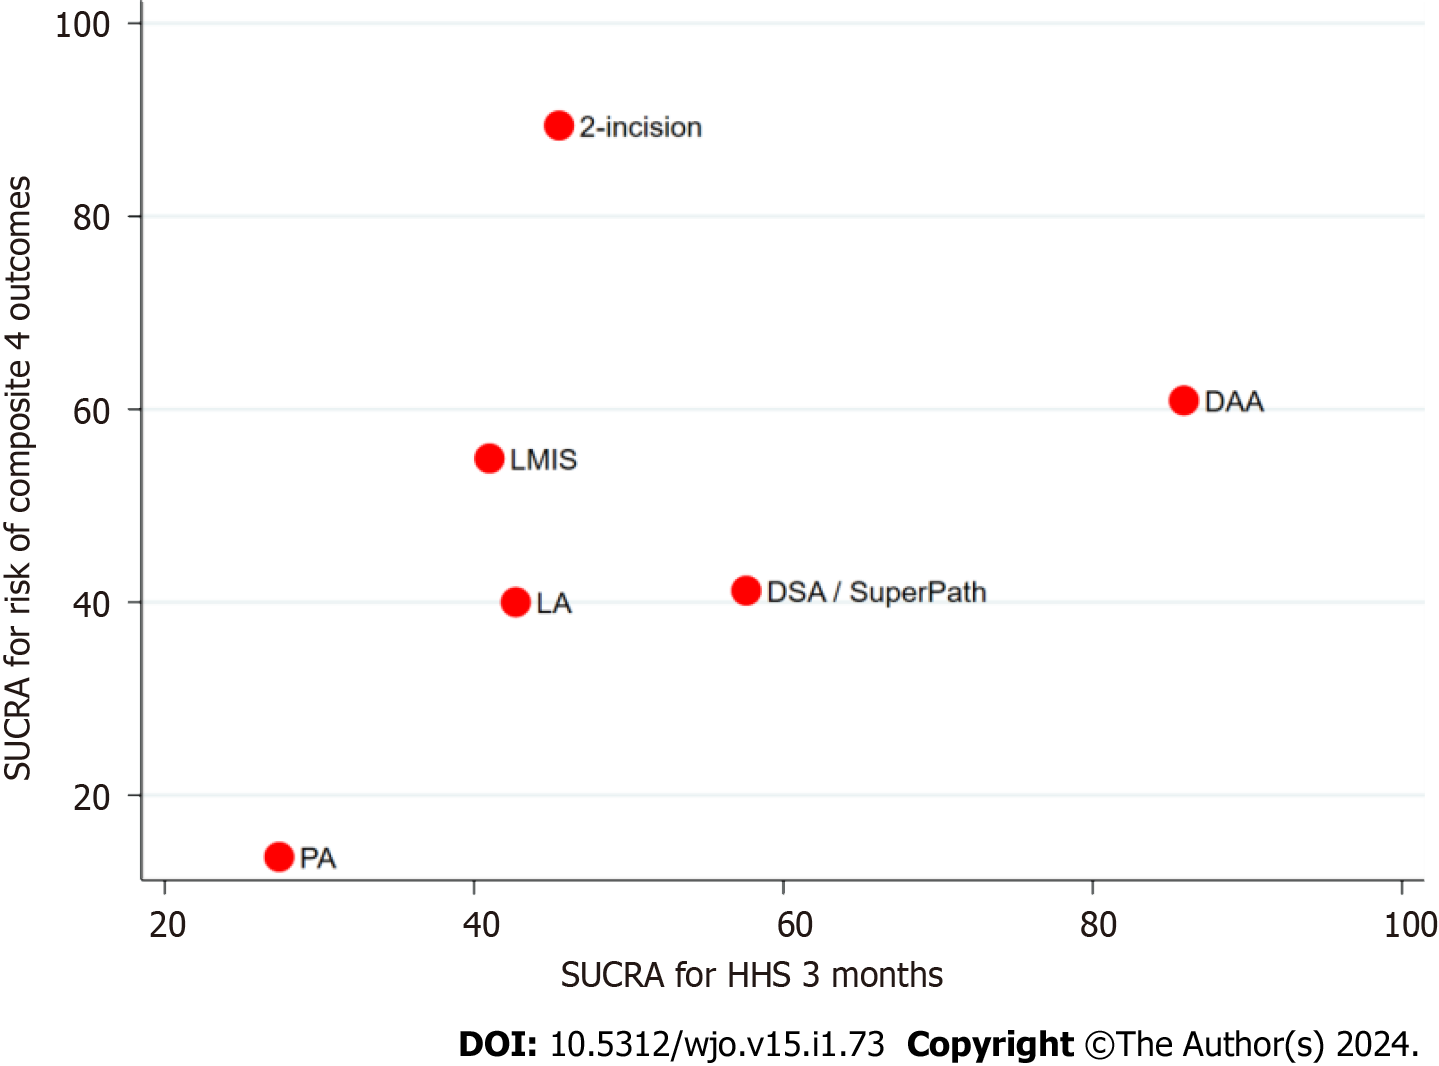
Figure 5 Cluster rank for network meta-analysis.
Cluster rank between Harris Hip Score at 3 mo and composite outcomes of complication (dislocation, intra-operative fracture, wound complication, and nerve injury). HHS: Harris Hip Score; PA: Posterior approach; LA: Lateral approach; DAA: Direct anterior approach; 2-incision: 2 incisions approach; LMIS: Mini-lateral approach; DSA/SuperPath: Direct superior approach or Supercapsular percutaneously-assisted total hip; SUCRA: Surface under the cumulative ranking curve.
- Citation: Nitiwarangkul L, Hongku N, Pattanaprateep O, Rattanasiri S, Woratanarat P, Thakkinstian A. Which approach of total hip arthroplasty is the best efficacy and least complication? World J Orthop 2024; 15(1): 73-93
- URL: https://www.wjgnet.com/2218-5836/full/v15/i1/73.htm
- DOI: https://dx.doi.org/10.5312/wjo.v15.i1.73


