
















Copyright: ©Author(s) 2026.
World J Clin Oncol. Aug 24, 2026; 17(8): 123328
Published online Aug 24, 2026. doi: 10.5306/wjco.123328
Published online Aug 24, 2026. doi: 10.5306/wjco.123328
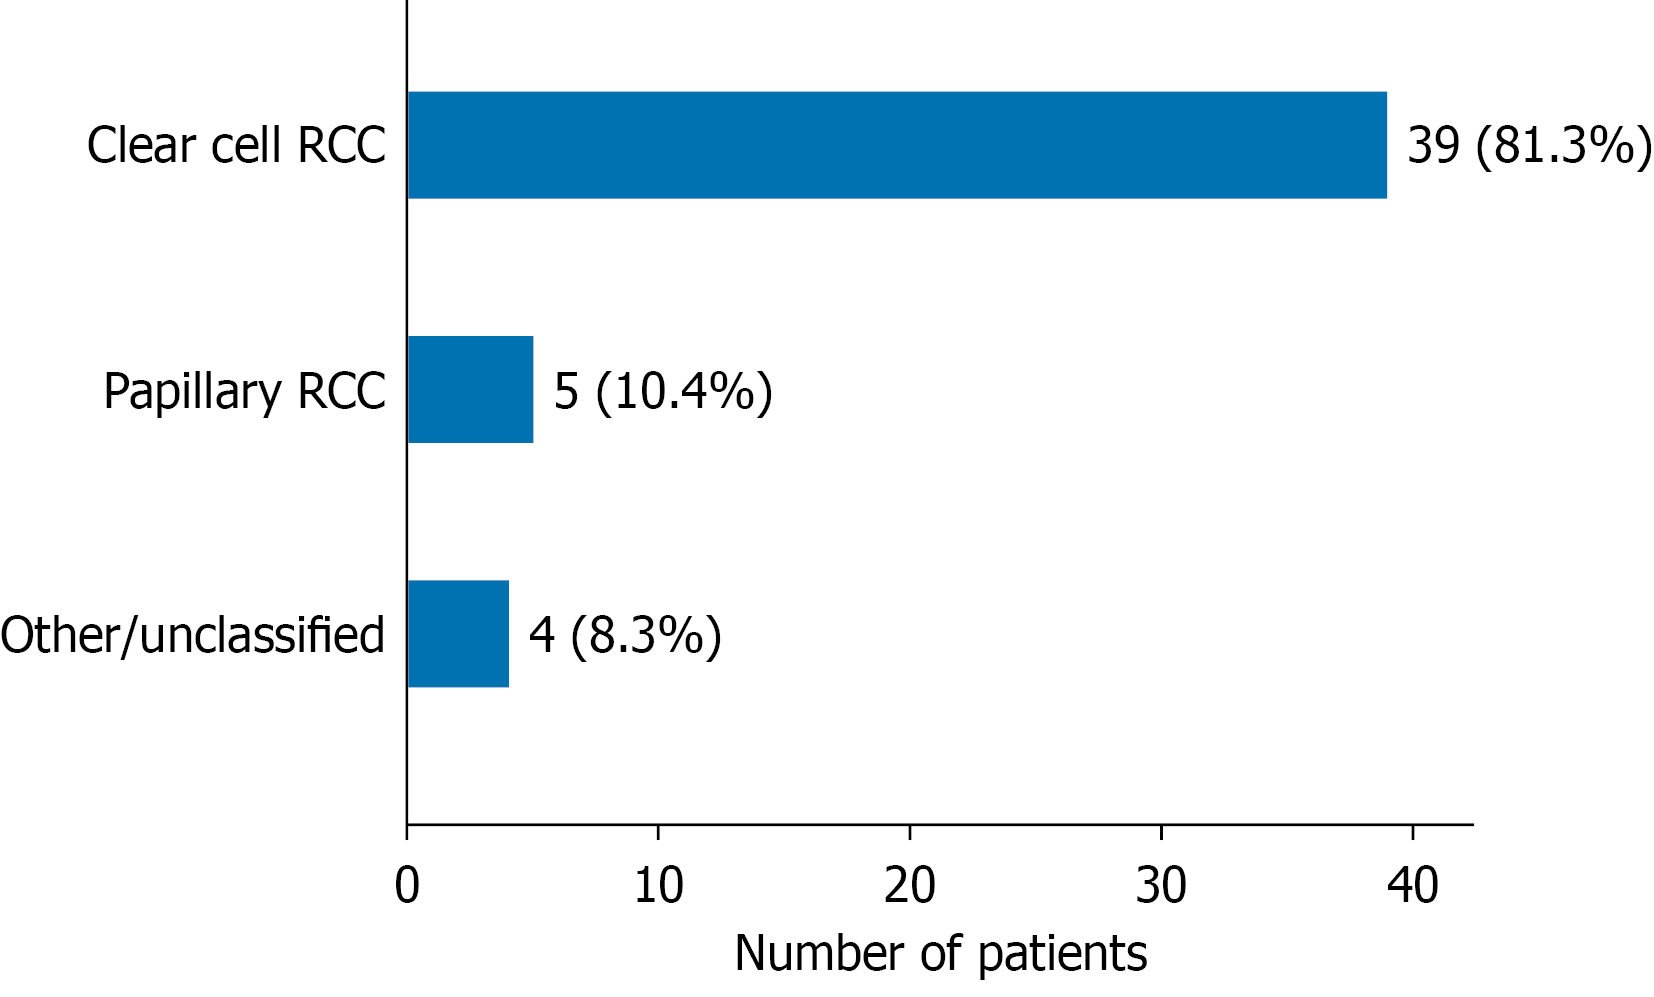
Figure 1 Distribution of histological subtypes in the study cohort.
Bar chart showing the distribution of histological subtypes among the 48 patients with renal cell carcinoma (RCC). Clear-cell RCC was the predominant histological subtype, followed by papillary RCC and other histological variants. RCC: Renal cell carcinoma.
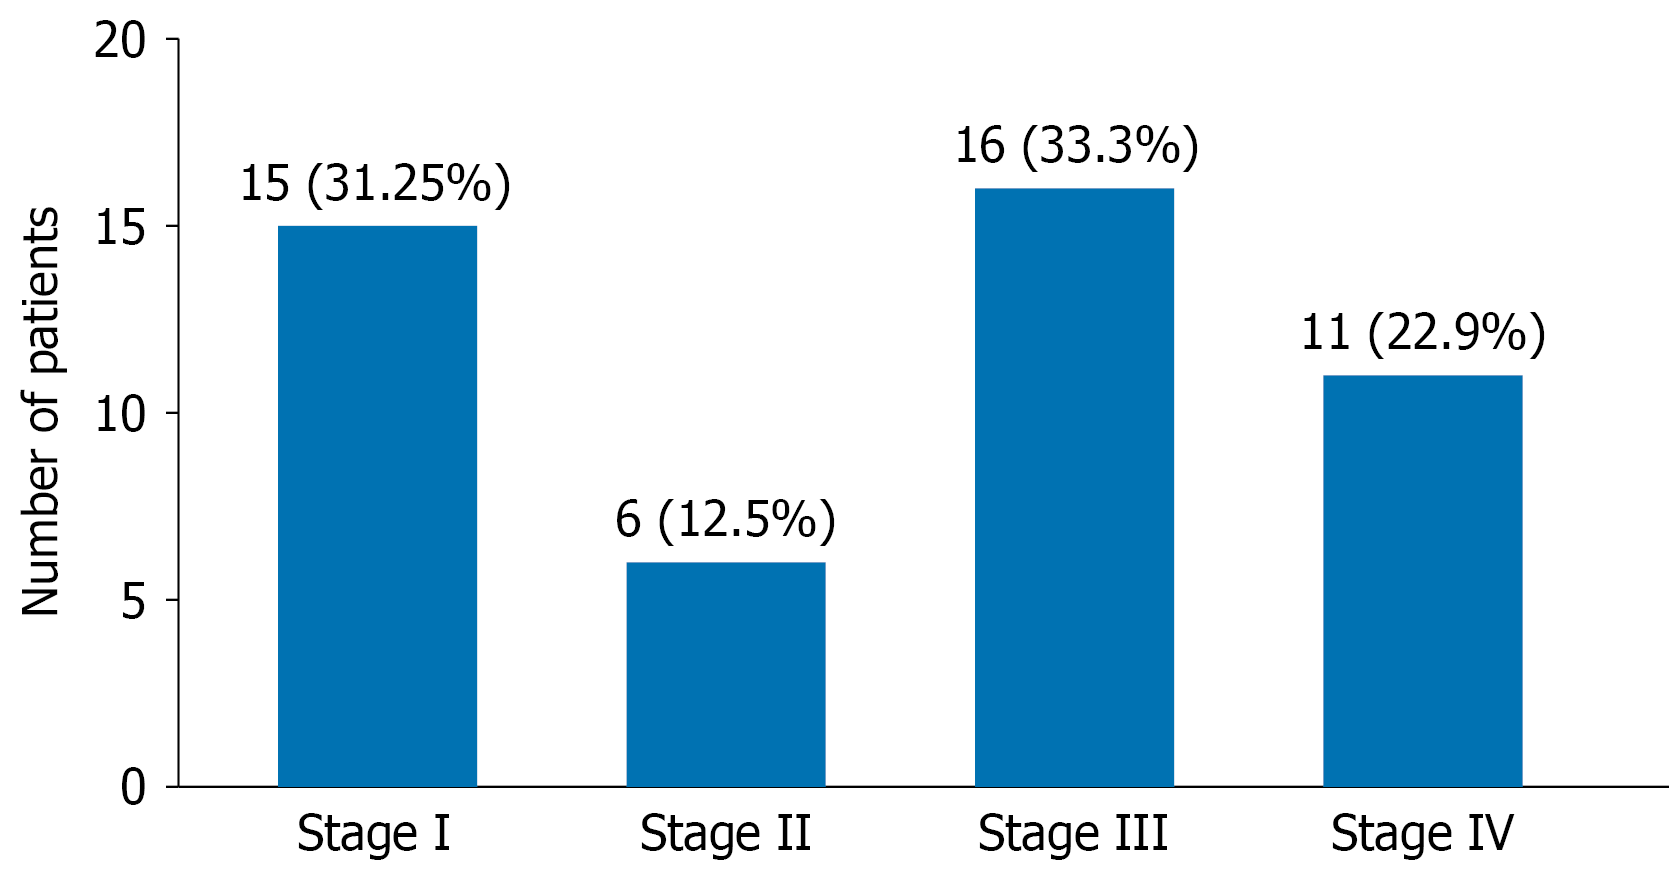
Figure 2 Clinical stage distribution of the study cohort.
Bar chart illustrating the distribution of patients according to the American Joint Committee on Cancer clinical stage at diagnosis. Most patients presented with stage III-IV.
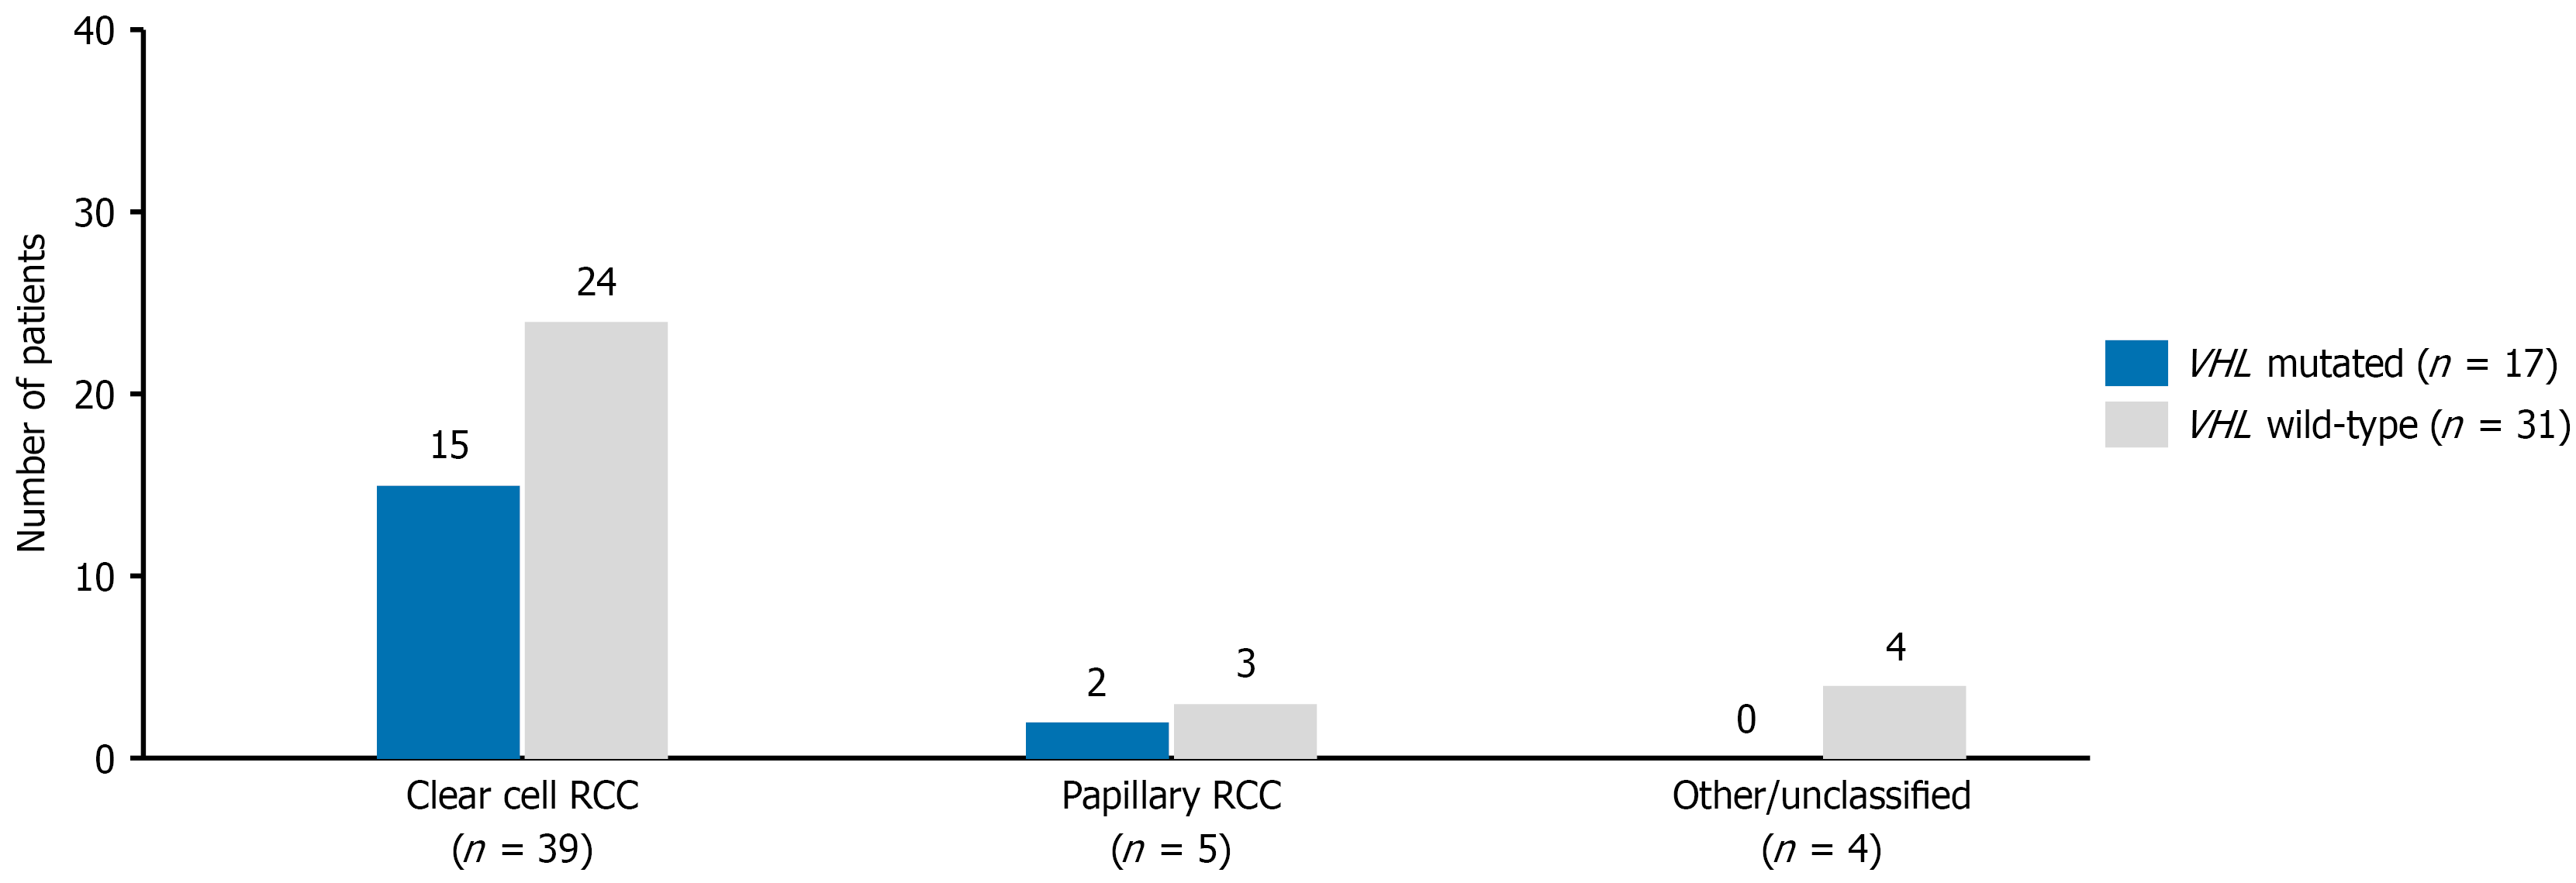
Figure 3 Distribution of VHL mutation status according to histological subtype.
Stacked bar chart showing the distribution of VHL-mutated (VHL+) and VHL wild-type (VHL-) tumors according to renal cell carcinoma histological subtype. VHL mutations were predominantly identified in clear-cell renal cell carcinoma (RCC), whereas relatively few mutations were observed in non-clear-cell RCC. RCC: Renal cell carcinoma.
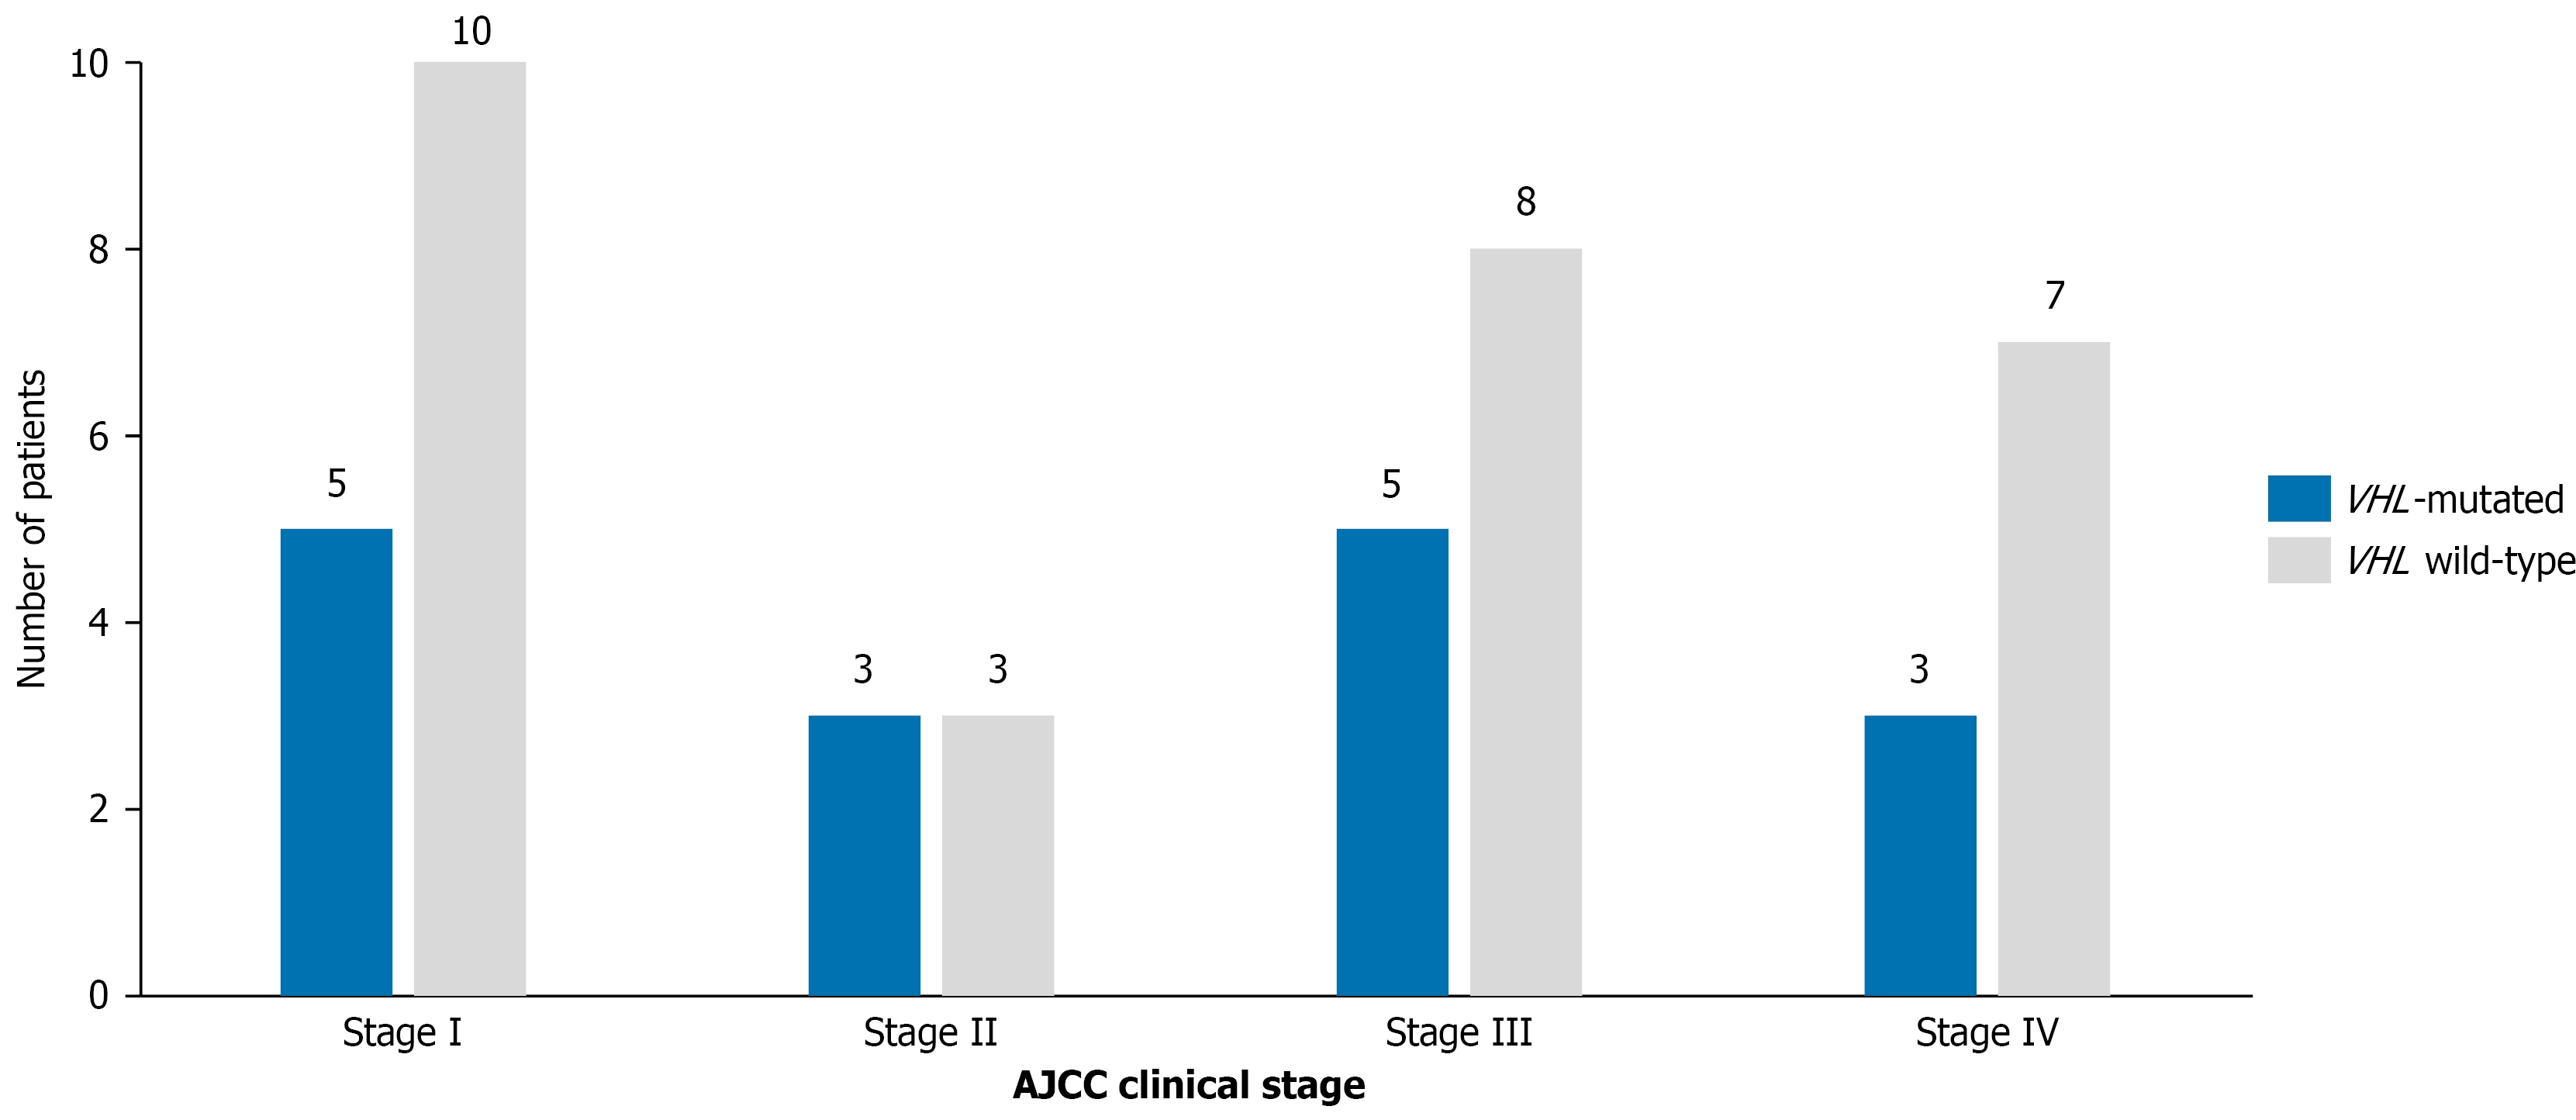
Figure 4 Clinical stage distribution according to VHL mutation status.
Grouped bar chart demonstrating the relationship between VHL mutation status and clinical stage at diagnosis. Tumors harboring VHL mutations were identified across all clinical stages, whereas VHL wild-type tumors were more frequently observed in stage I and advanced-stage disease.
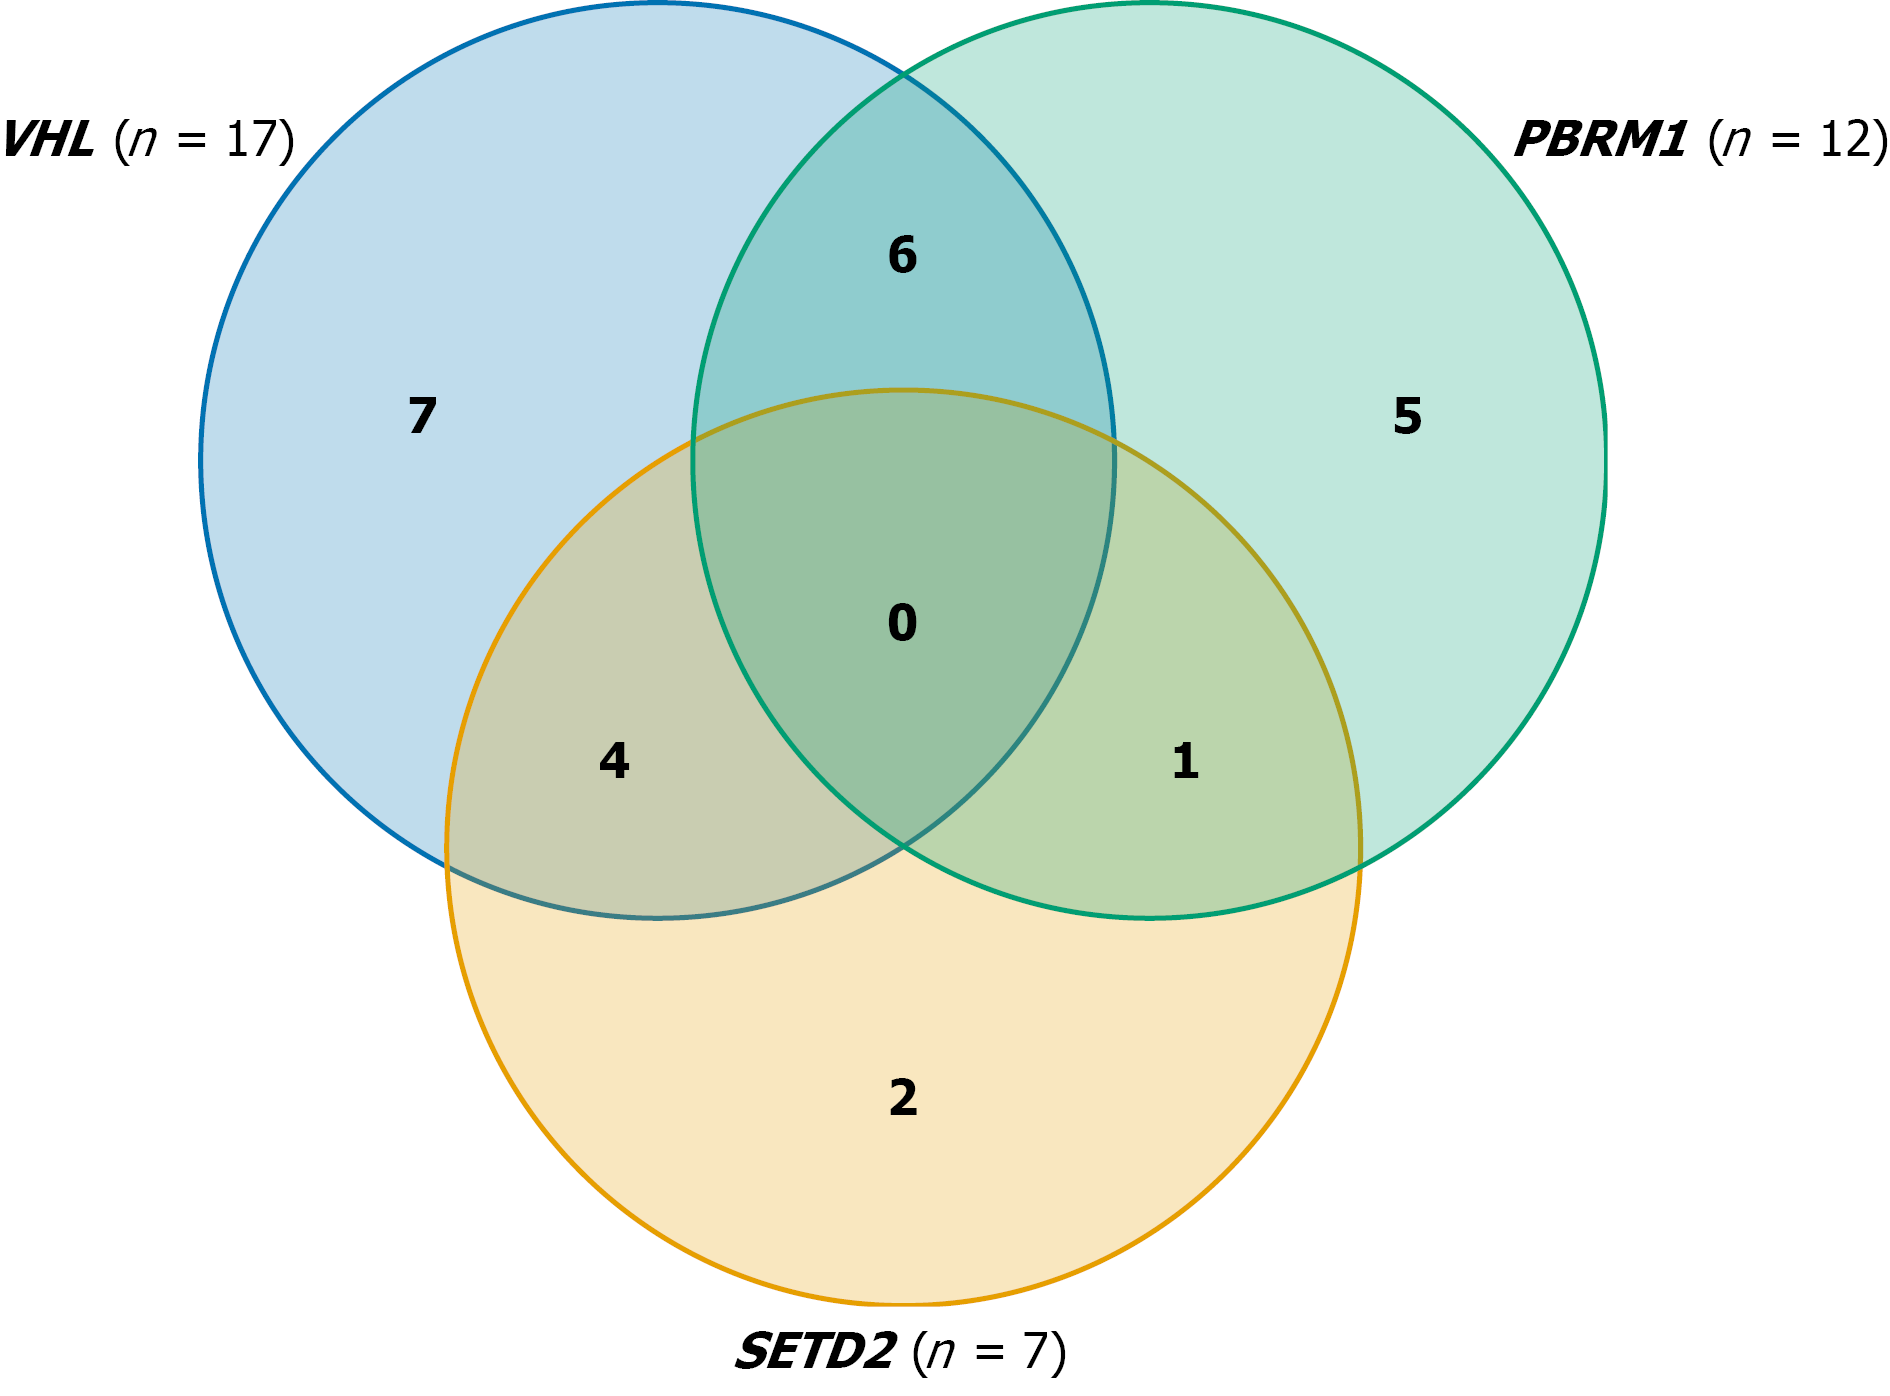
Figure 5 Co-occurrence of chromatin-remodeling gene alterations in the study cohort.
Venn diagram illustrating the overlap among pathogenic alterations in VHL, PBRM1, and SETD2. The most frequent co-occurring alteration involved VHL and PBRM1, followed by VHL and SETD2.
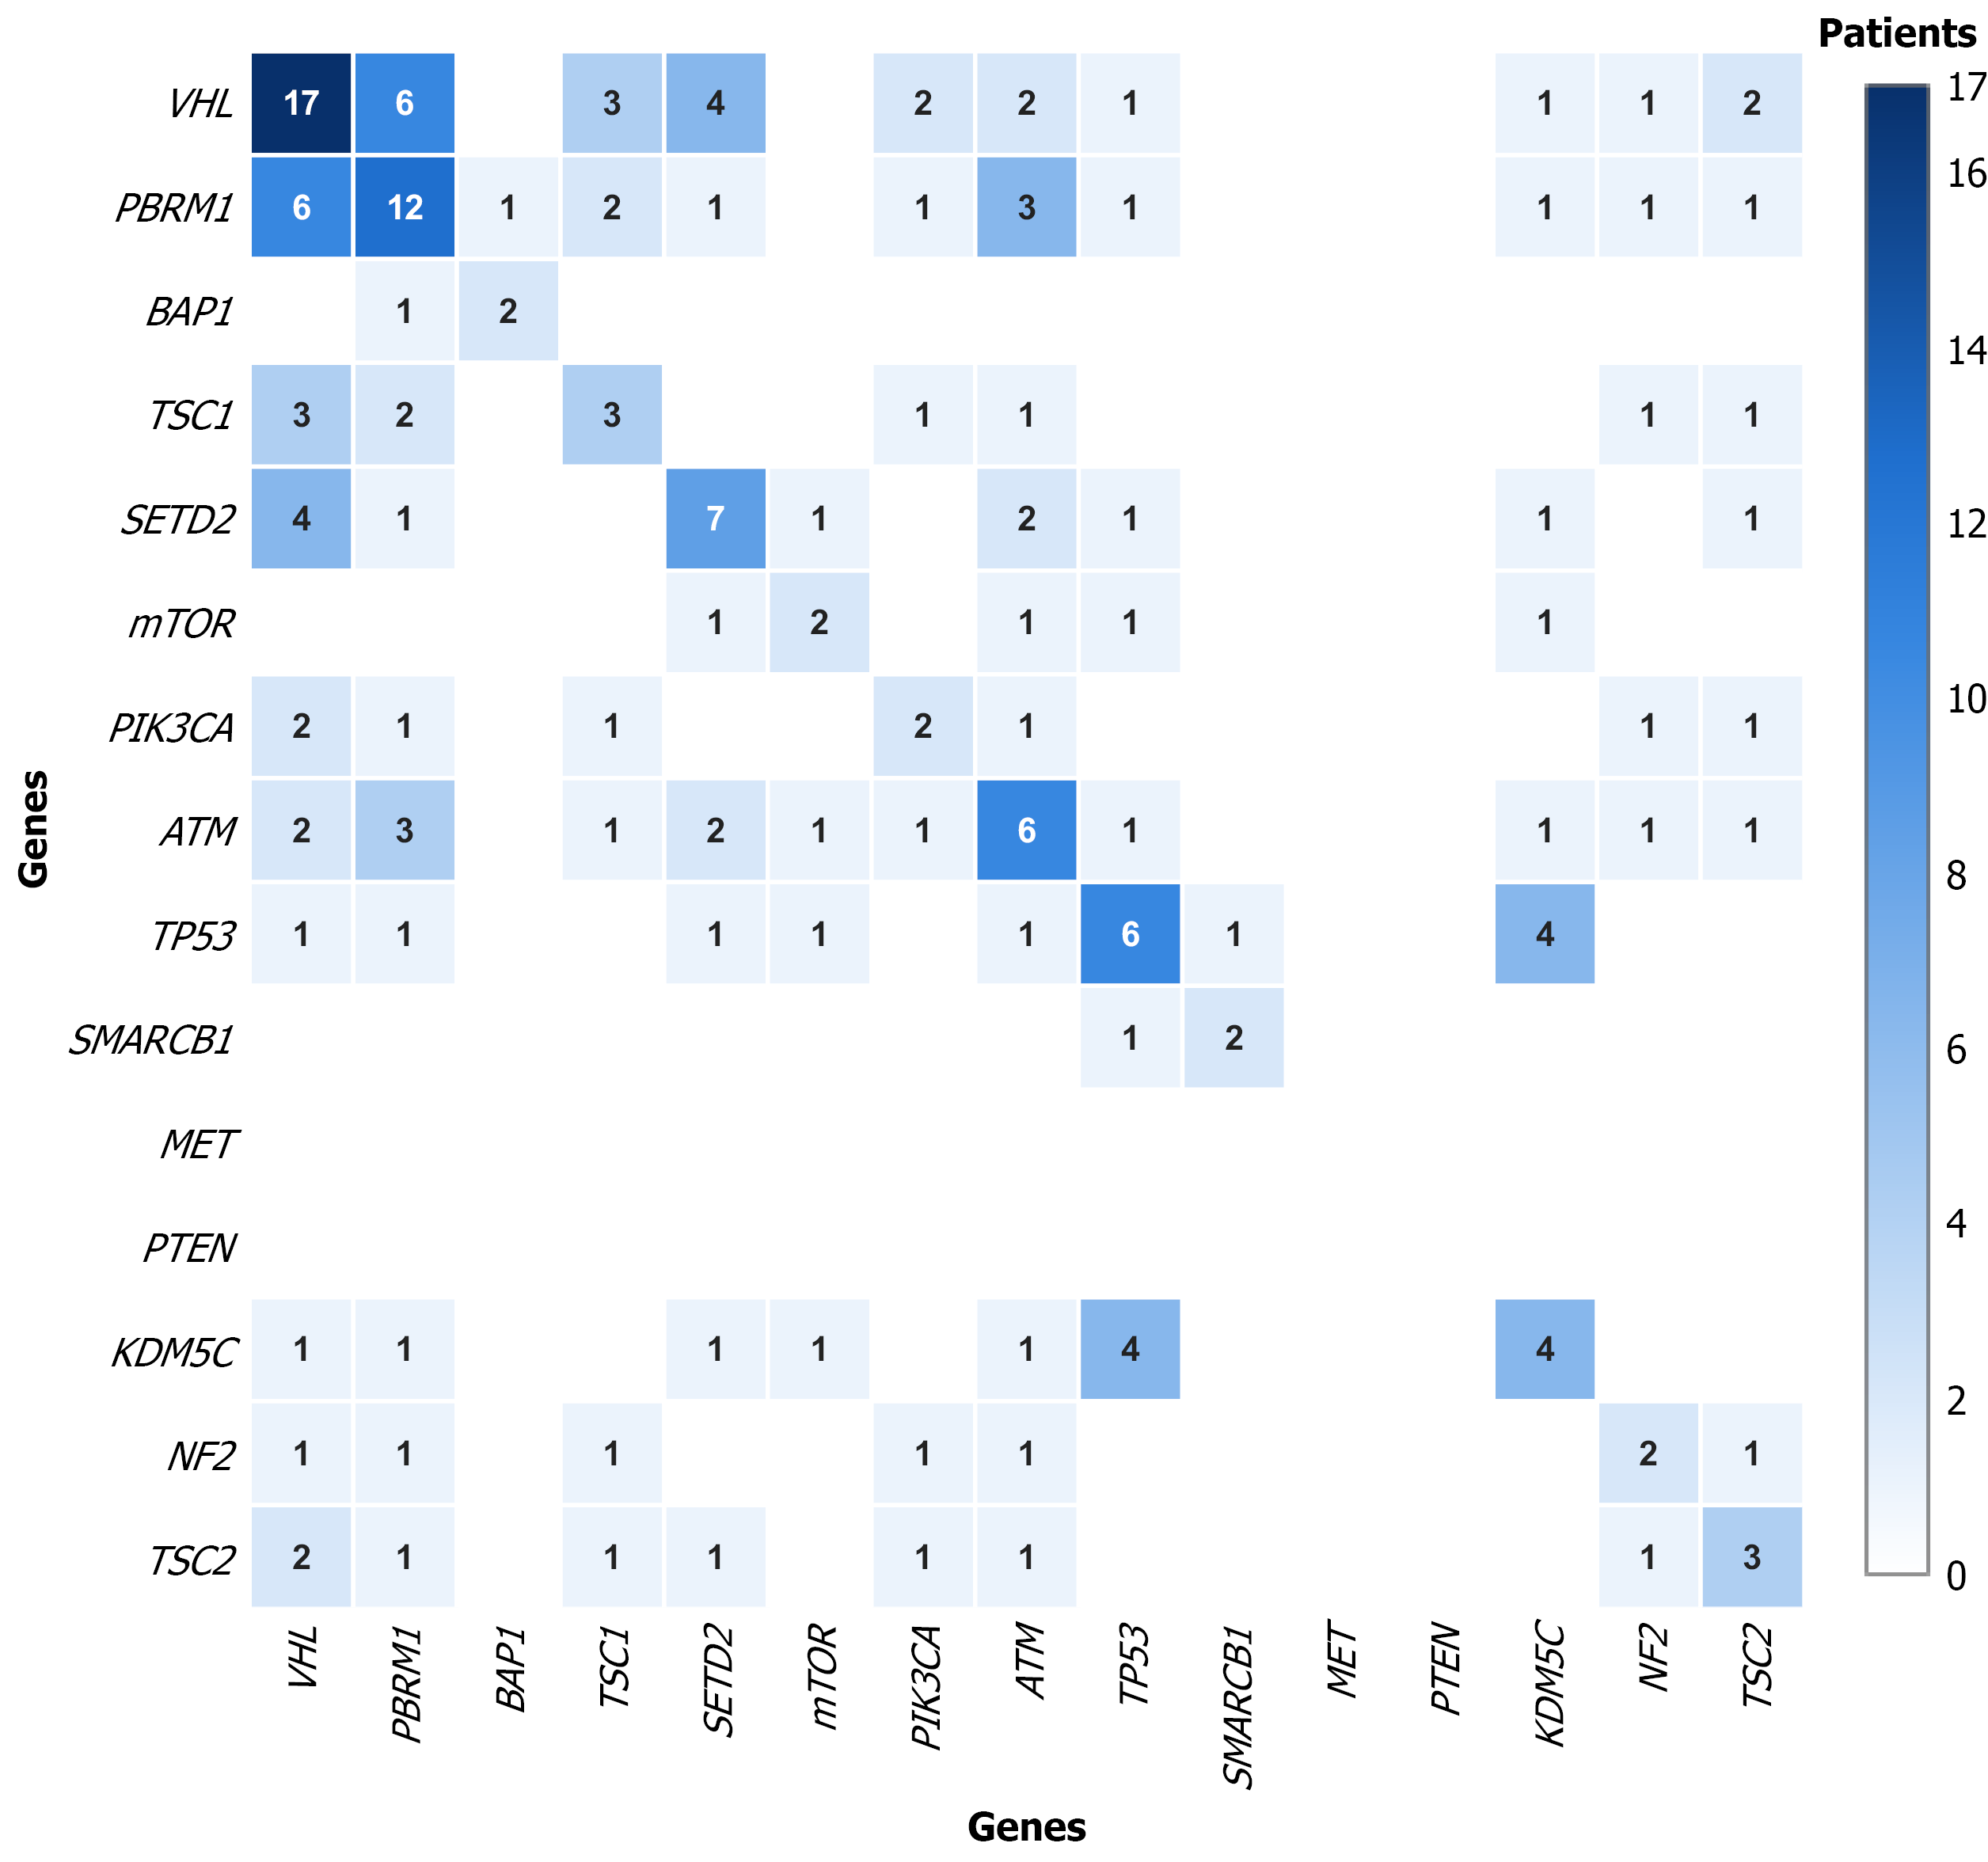
Figure 6 Heatmap of pairwise somatic mutation co-occurrence.
Heatmap illustrating the frequency of pairwise co-occurring genomic alterations among the most frequently mutated genes in the study cohort. Darker colors represent higher frequencies of co-occurrence, with the strongest association observed between VHL and PBRM1.
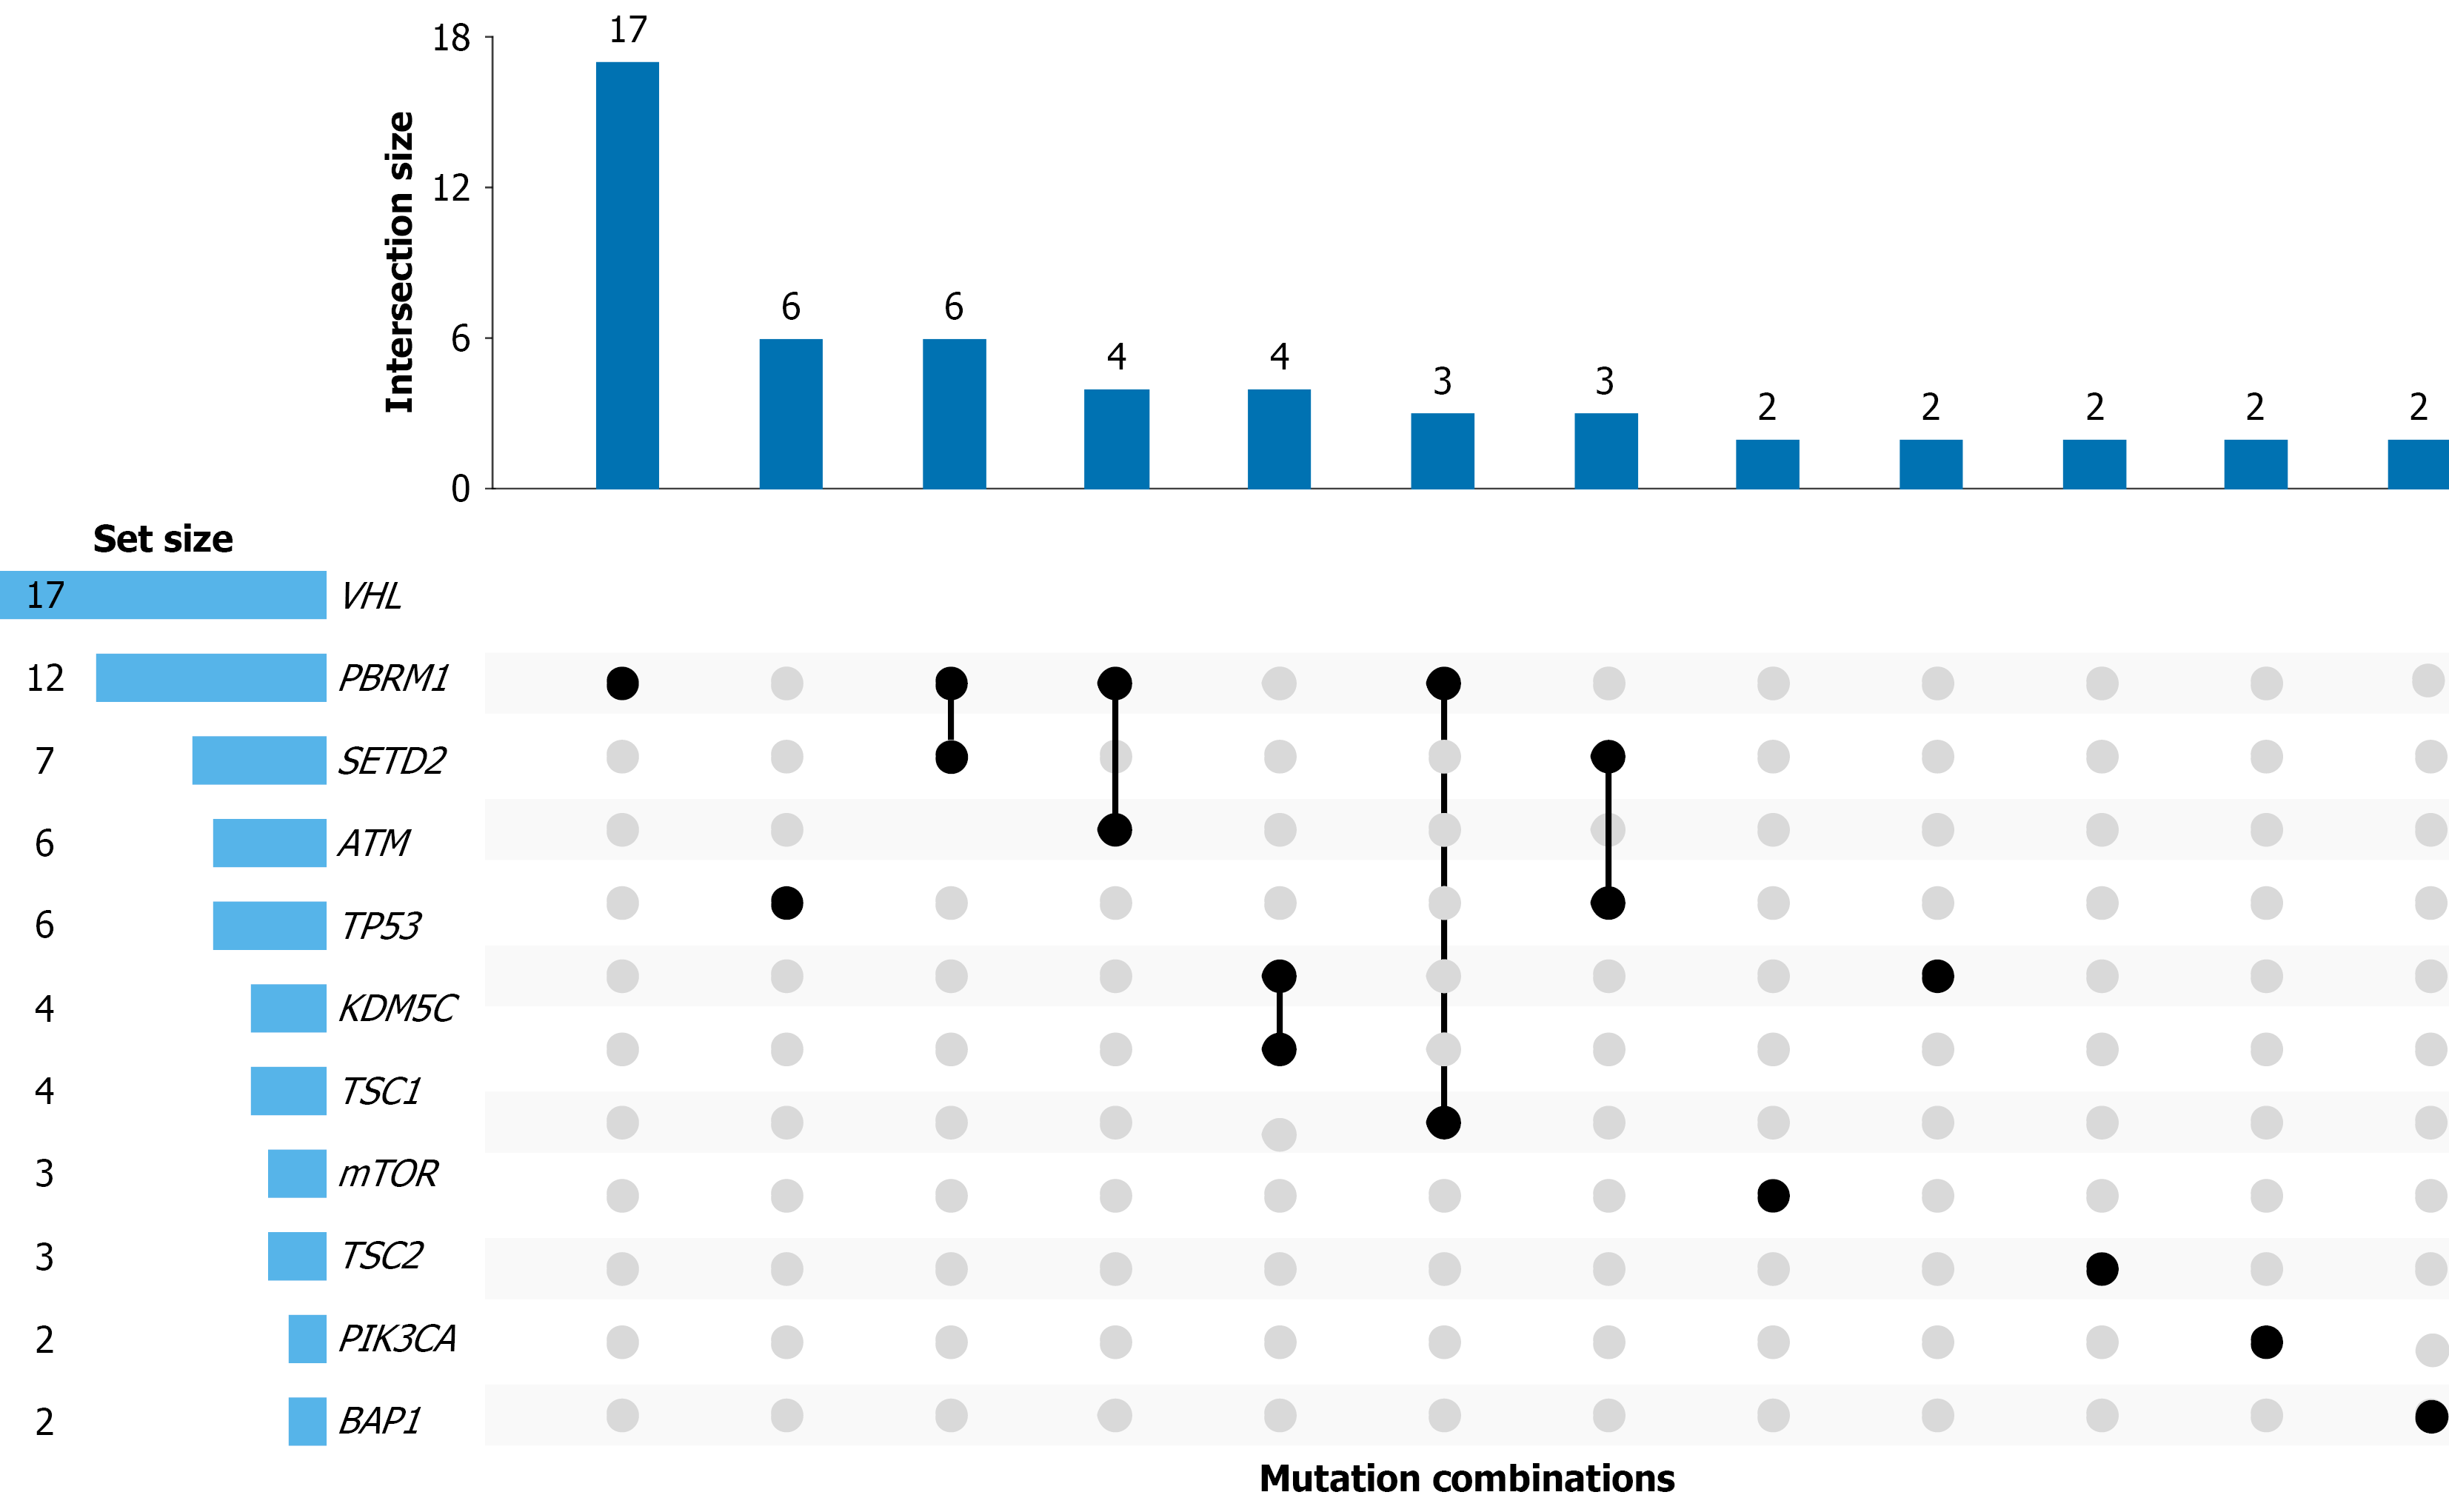
Figure 7 Combinatorial mutation patterns identified by UpSet analysis.
UpSet plot demonstrating the distribution of single-gene and co-occurring genomic alterations among the five most frequently mutated genes (VHL, PBRM1, SETD2, ATM, and TP53). The upper panel shows the number of tumors within each mutational intersection, whereas the lower panel shows the total number of tumors harboring alterations in each gene.
- Citation: Talwar V, Jain A, Goel V, Agarwal B, Gupta P, Tripathi R, Rawal S, Mehta A. Genomic landscape and clinical actionability of renal cell carcinoma in an Indian cohort: A real-world targeted next-generation sequencing study. World J Clin Oncol 2026; 17(8): 123328
- URL: https://www.wjgnet.com/2218-4333/full/v17/i8/123328.htm
- DOI: https://dx.doi.org/10.5306/wjco.123328