
















Copyright: ©Author(s) 2026.
World J Clin Oncol. Jul 24, 2026; 17(7): 121262
Published online Jul 24, 2026. doi: 10.5306/wjco.121262
Published online Jul 24, 2026. doi: 10.5306/wjco.121262
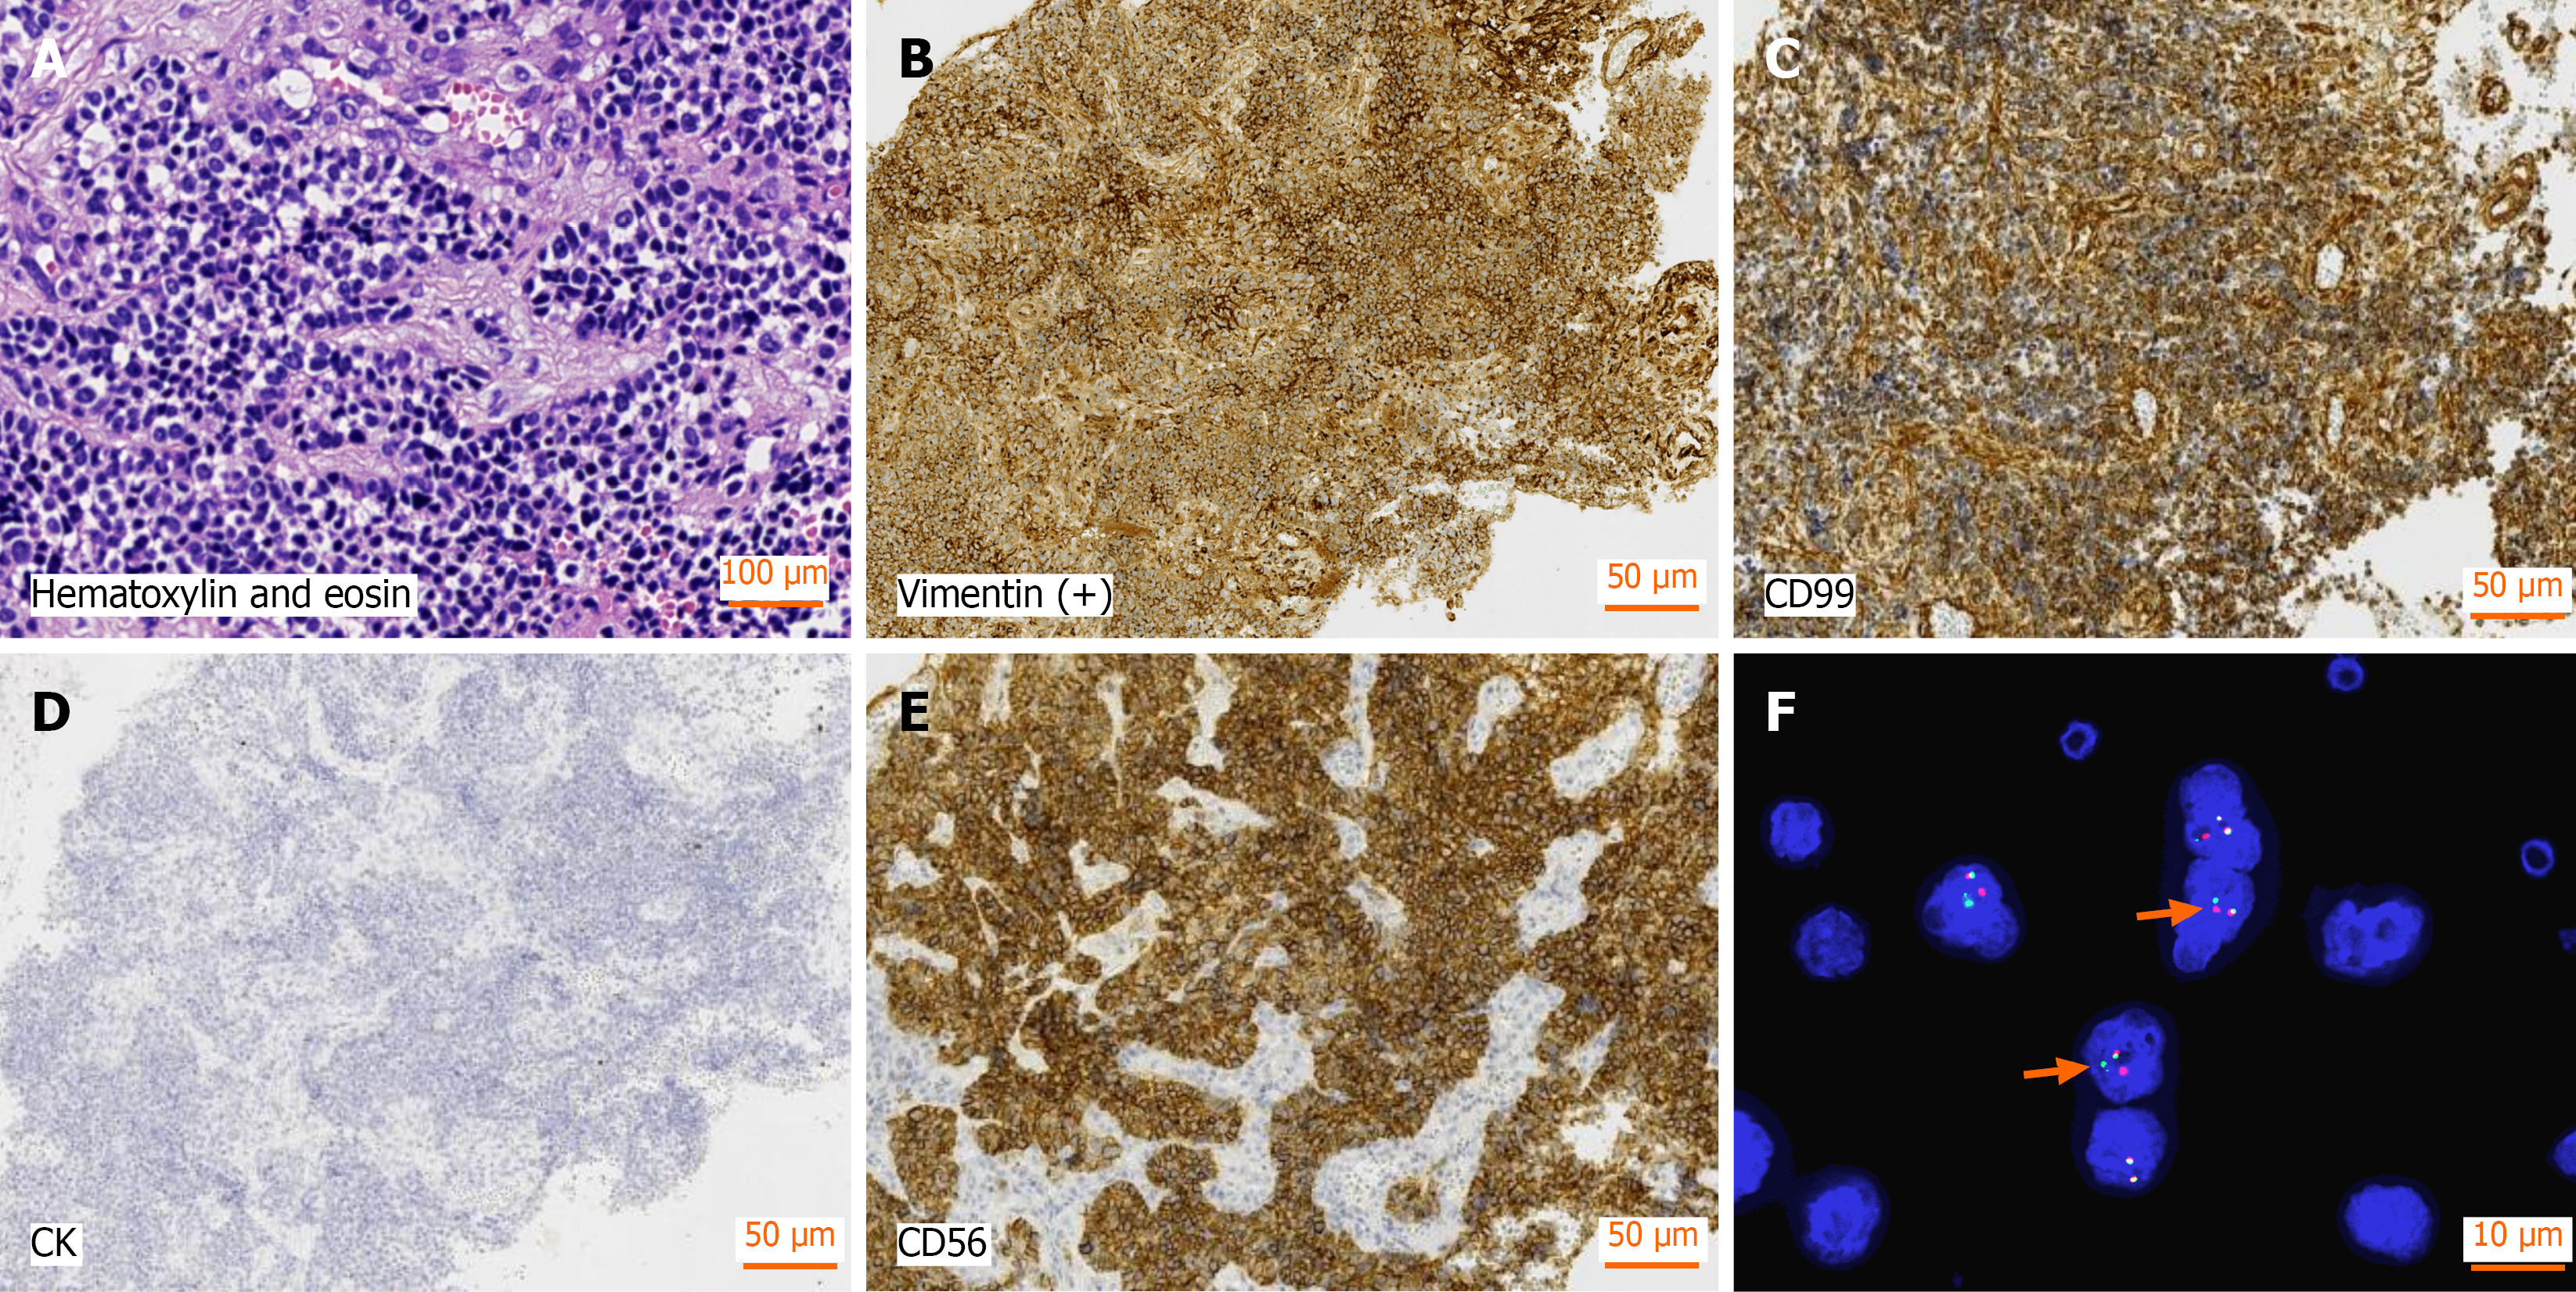
Figure 1 Immunohistochemical evaluation of the proband pathological sections.
A: Hematoxylin and eosin staining; B: Vimentin (+) staining, C: CD99 (+) staining, D: CK (-) staining; E: CD56 (+) staining; F: Fluorescence in situ hybridization imaging. A: Magnification × 100; B-E: Magnification × 200; F: Magnification × 1000.
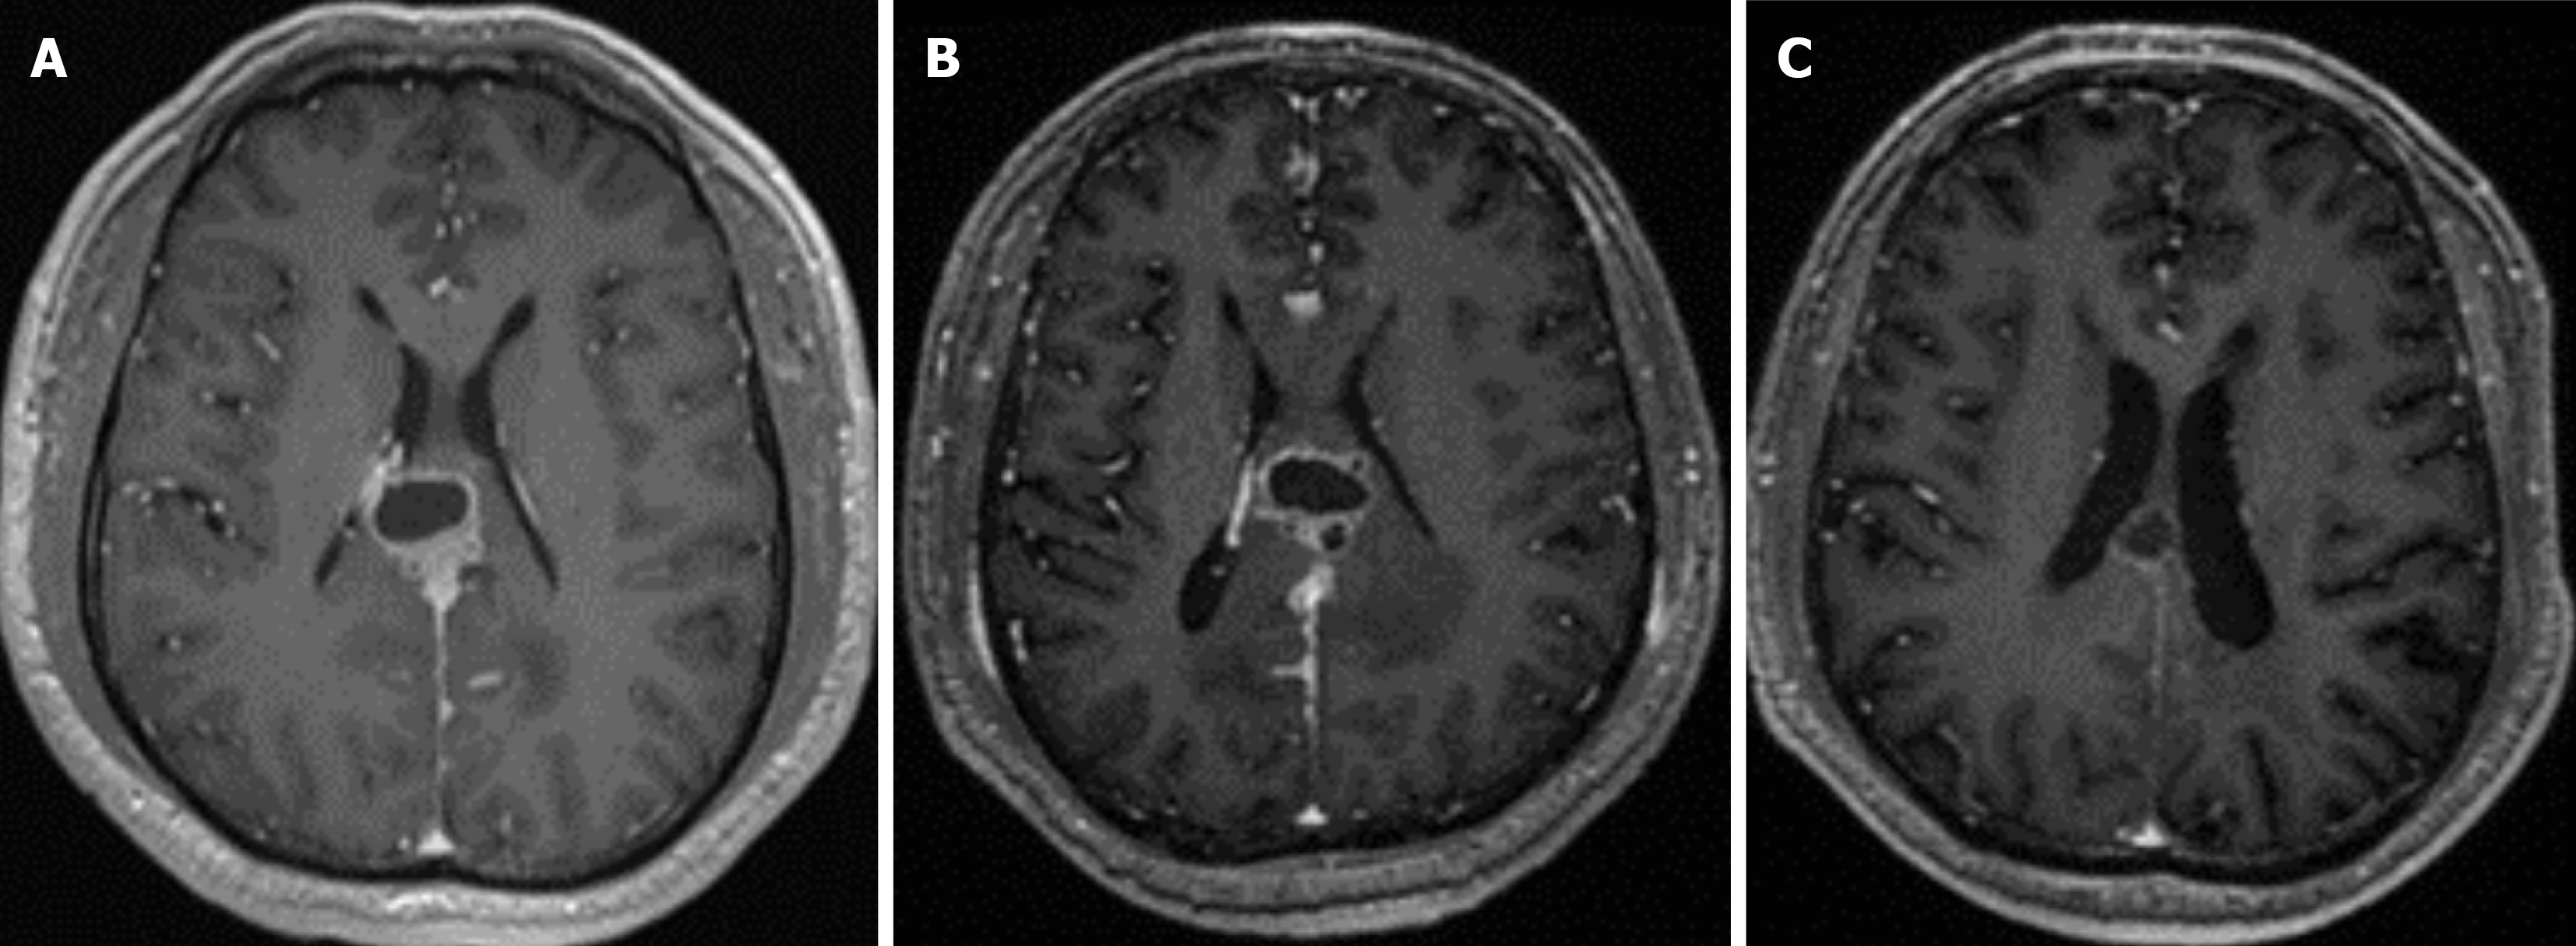
Figure 2 Brain magnetic resonance imaging scan.
A: Preoperative brain magnetic resonance imaging (MRI) of the patient; B: Postoperative brain MRI; C: Brain MRI following radio and chemotherapy.
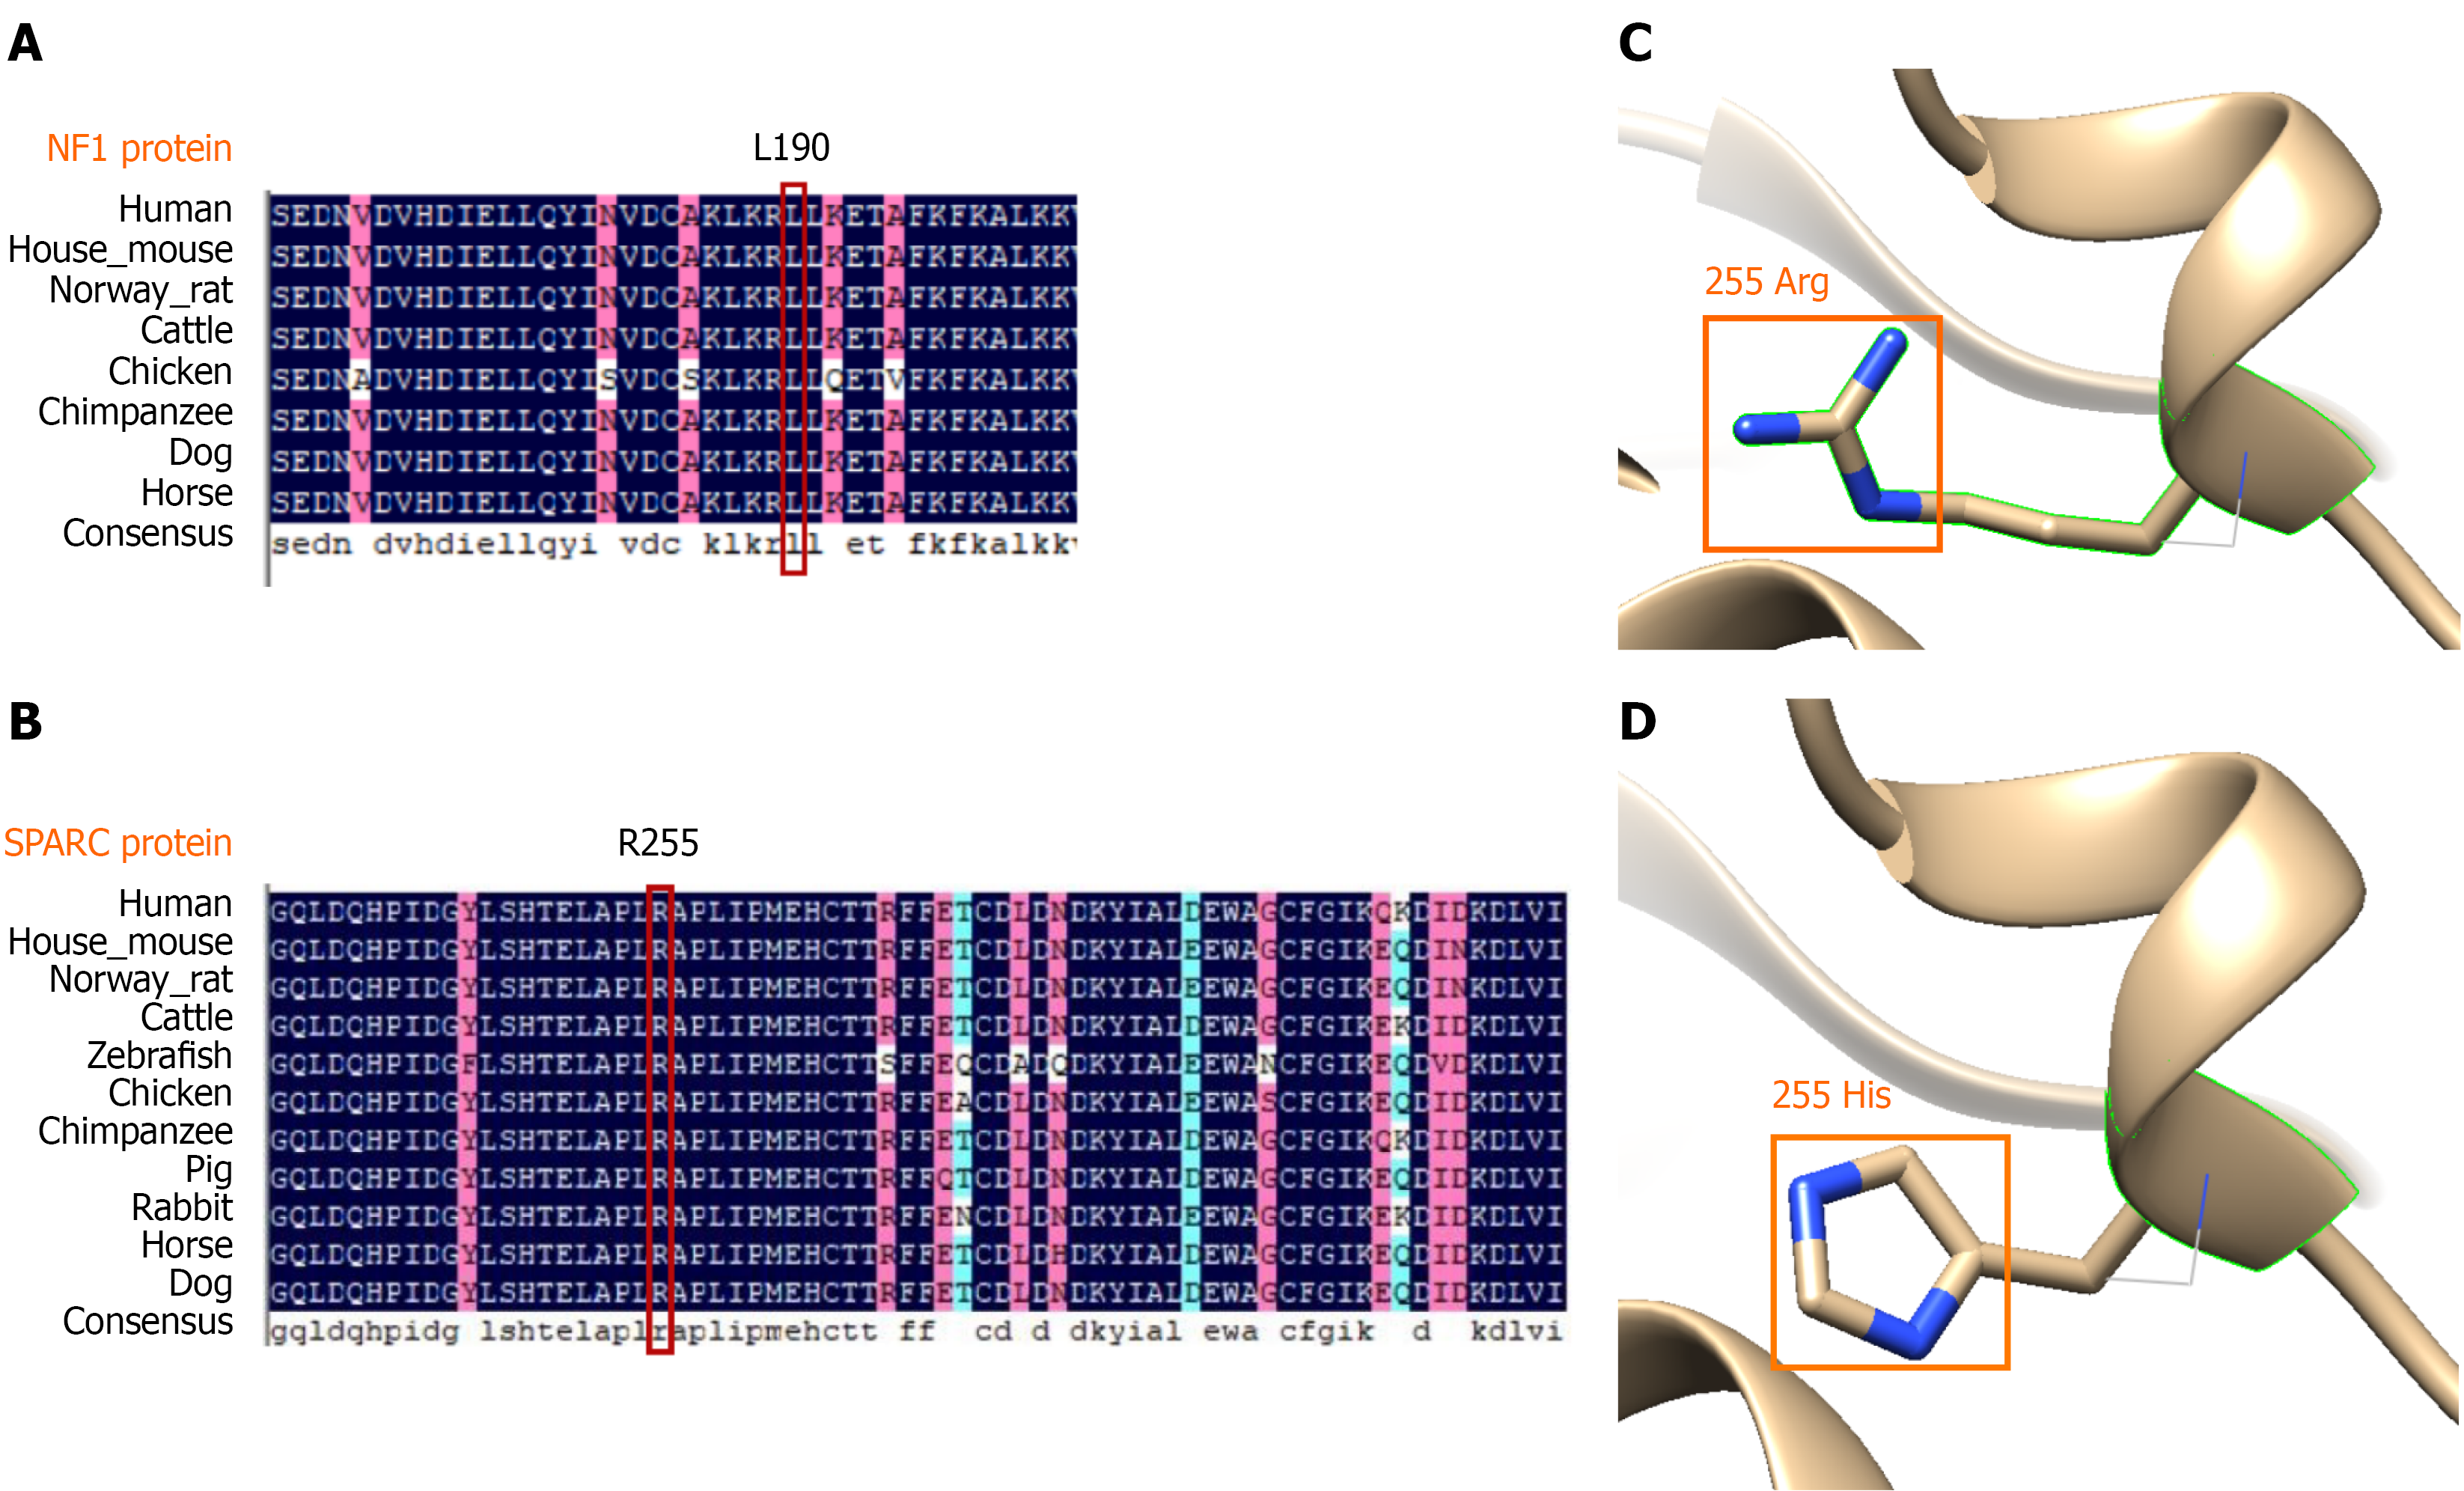
Figure 3 Biological analysis of risk variants.
A and B: Neurofibromin 1 Leu 190 (A) and secreted protein acidic and rich in cysteine (SPARC) Arg 255 (B) across species; C and D: Schematic diagrams of the 3D SPARC protein structure prior to and after C > D mutation, which altered the amino acid at position 255 from an arginine to a histidine.
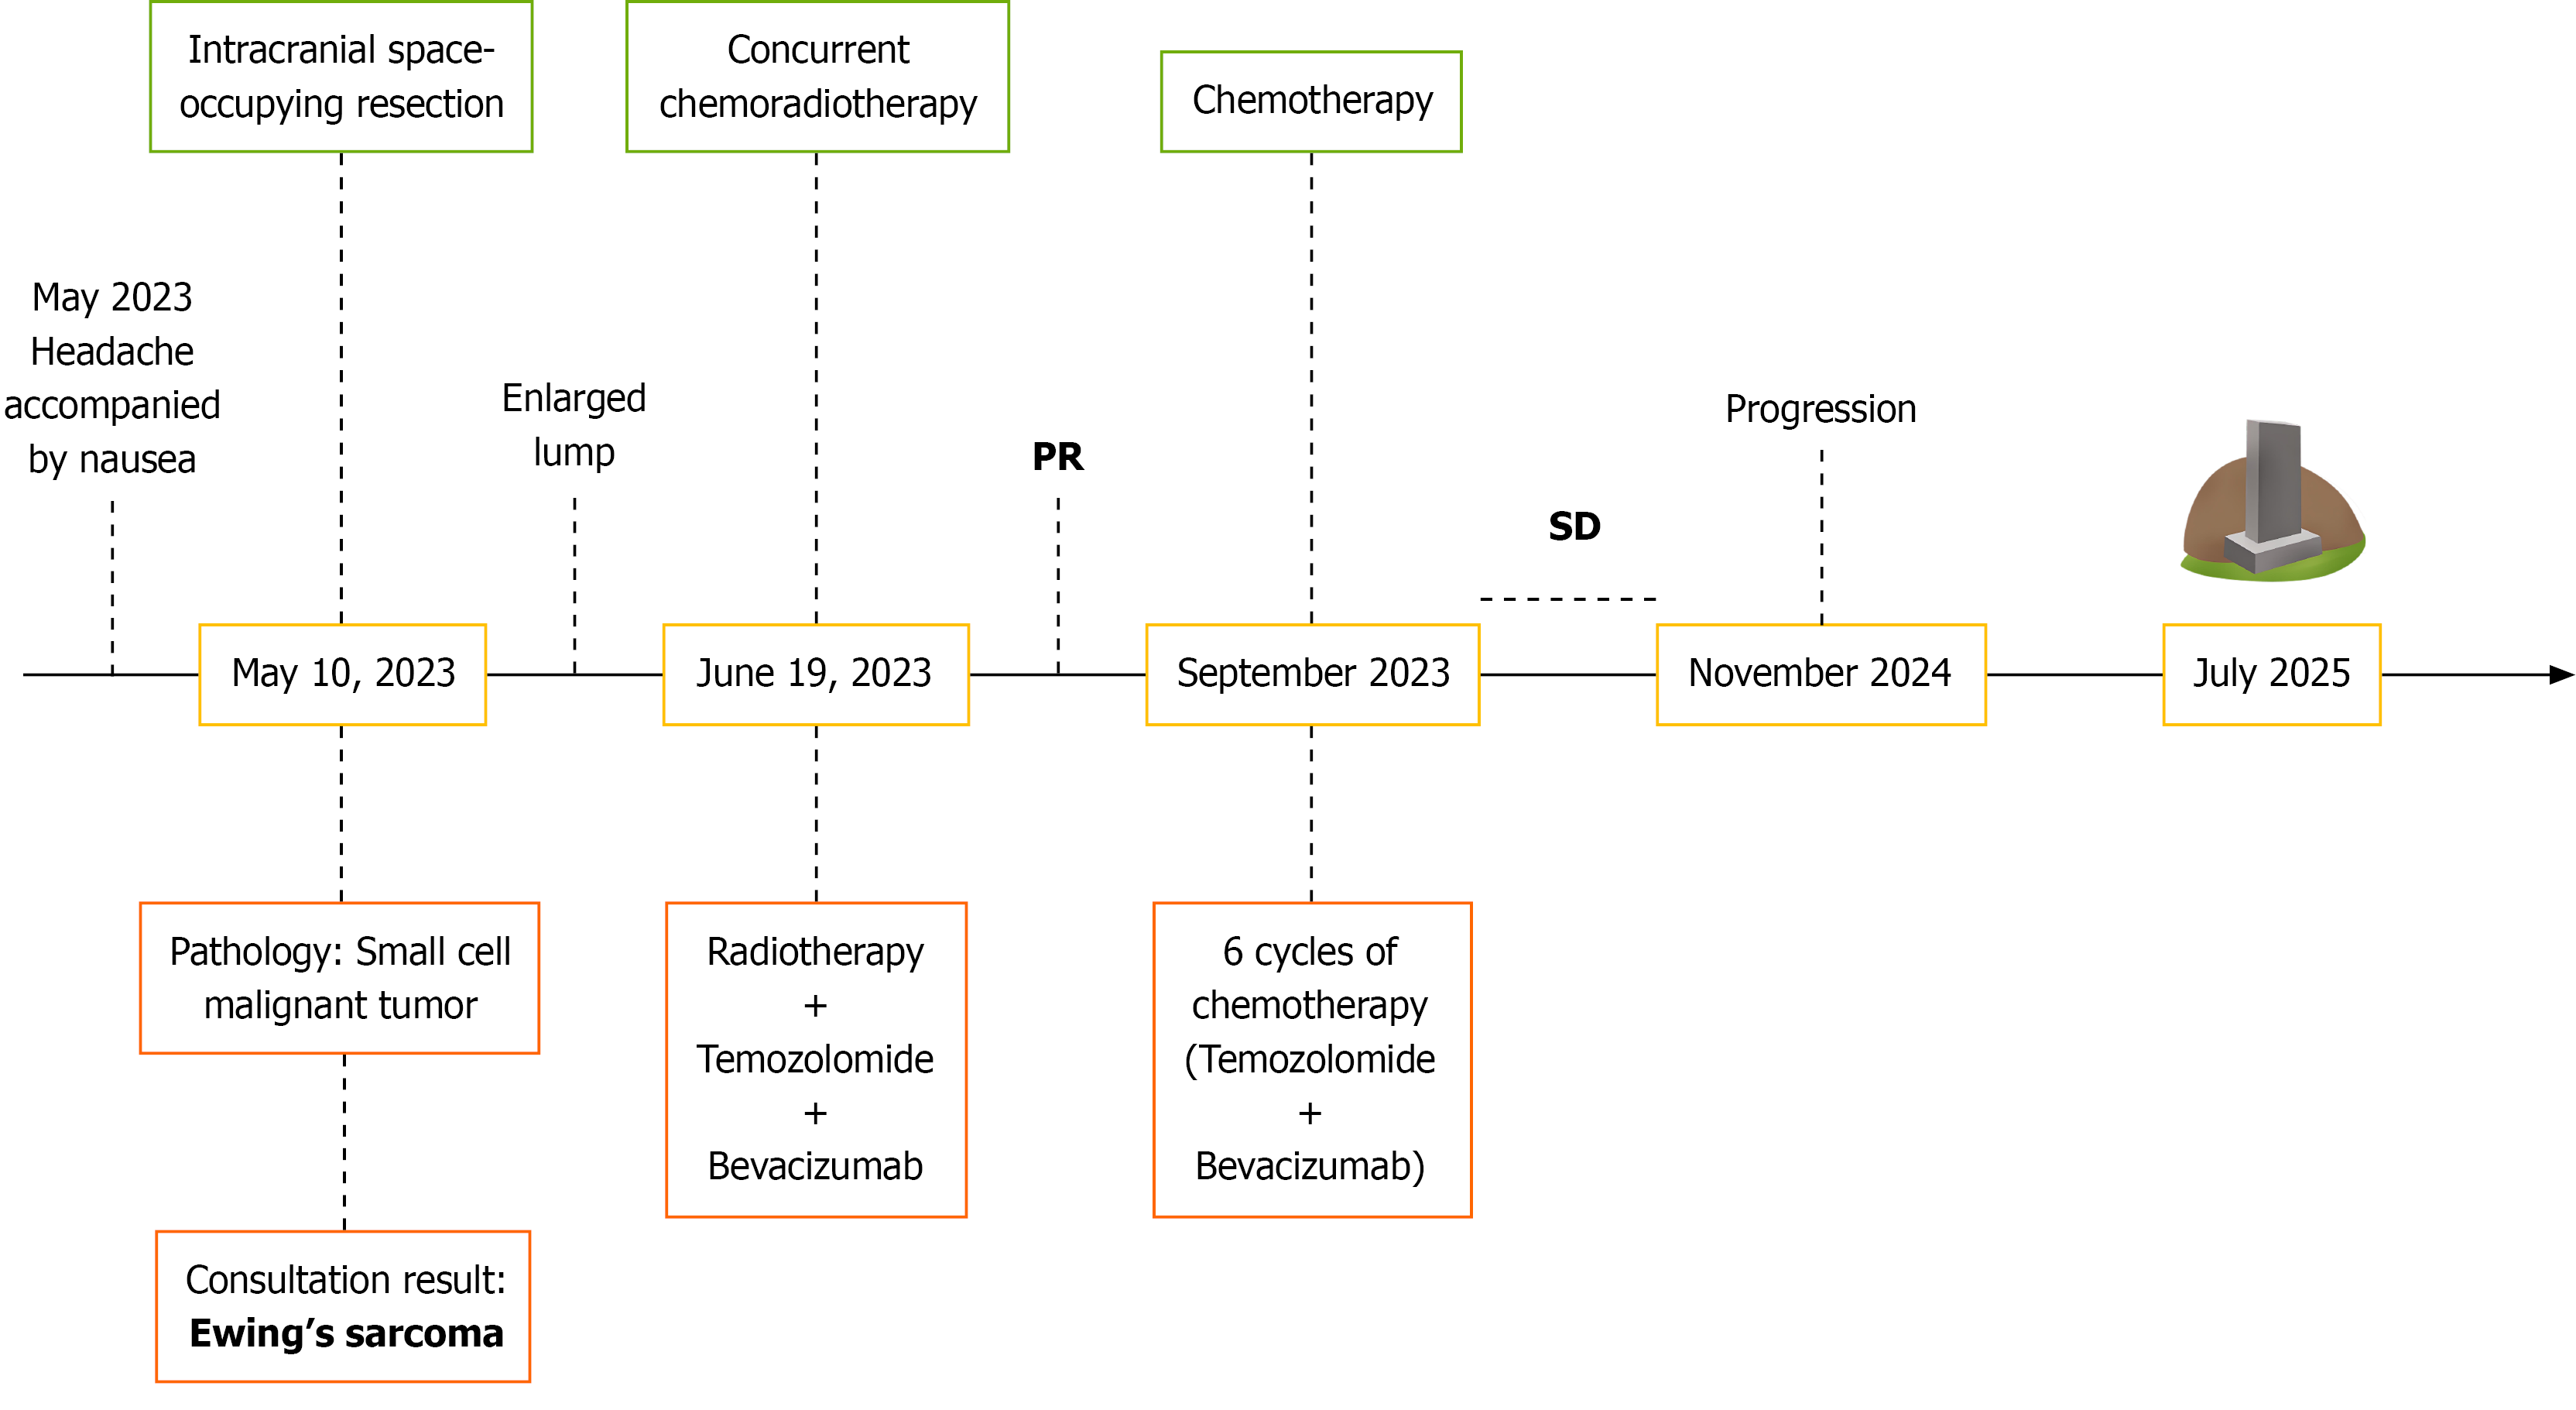
Figure 4 Timeline of the patient’s clinical course.
PR: Partial response; SD: Stable disease.
- Citation: Cheng Y, Yu X, Song ZN, Li MJ, Zhao XR, Jia XD, Liu Z, Yu Z, Zhang FY. Whole-exome sequencing identification of the risk variants in a middle-aged adult with intracranial Ewing’s sarcoma: A case report. World J Clin Oncol 2026; 17(7): 121262
- URL: https://www.wjgnet.com/2218-4333/full/v17/i7/121262.htm
- DOI: https://dx.doi.org/10.5306/wjco.121262