
















Copyright: ©Author(s) 2026.
World J Clin Oncol. Oct 24, 2026; 17(10): 126647
Published online Oct 24, 2026. doi: 10.5306/wjco.126647
Published online Oct 24, 2026. doi: 10.5306/wjco.126647
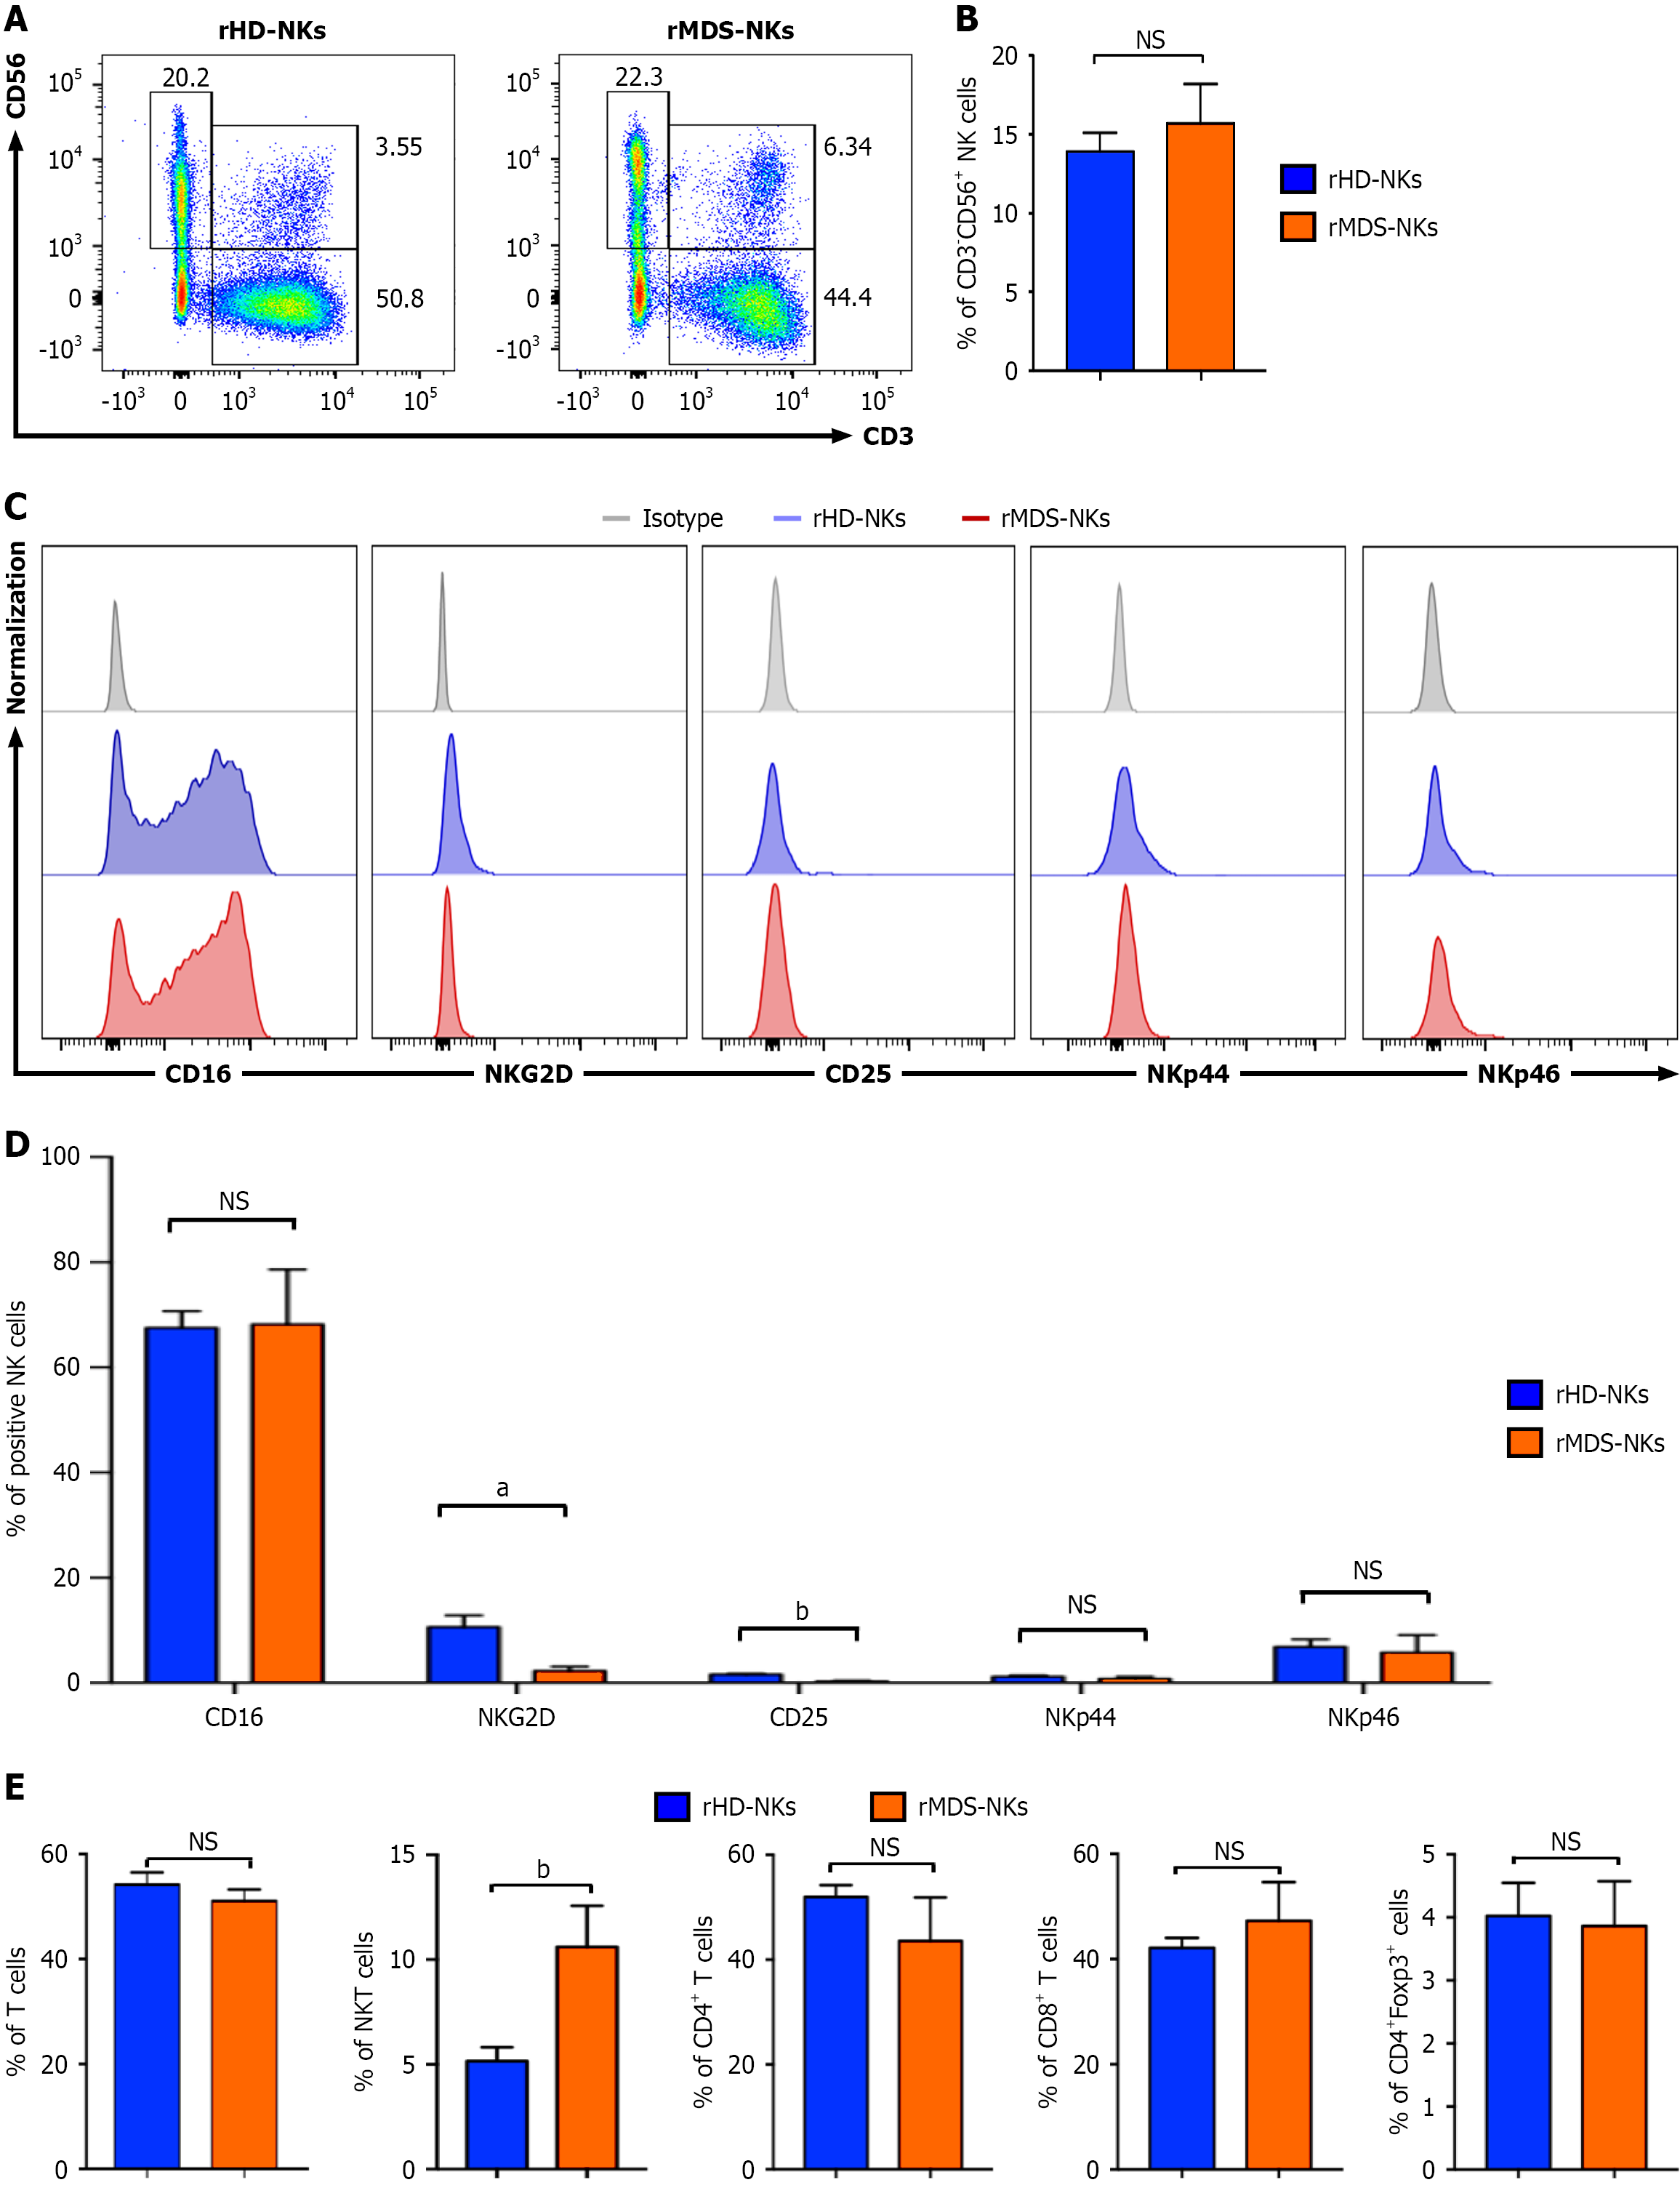
Figure 1 Comparison of the immunophenotype and components between resident myelodysplastic syndrome natural killers and resident healthy donor natural killers.
A and B: Representative flow cytometry diagrams (A) and statistical analysis (B) of CD3-CD56+ total natural killers (NK) cells in the indicated groups [resident myelodysplastic syndrome NKs (rMDS-NKs), resident healthy donor NKs (rHD-NKs)]; C and D: Representative flow cytometry diagrams (C) and statistical analyses (D) of total activated CD3-CD56+CD16+ NK cells and the indicated subsets (NKG2D+, CD25+, NKp44+, and NKp46+) in the indicated groups (rMDS-NKs, rHD-NKs); E: Statistical analyses of CD3+ total T lymphocytes, CD3+CD56+ NKT cells, and the T cell subsets (CD3+CD4+, CD3+CD8+, and CD4+FoxP3+ T cells) in the indicated groups (rMDS-NKs, rHD-NKs). Data were shown as mean ± SEM (n = 3 repetitions for each sample). aP < 0.05, bP < 0.01, NS: Not significant. rMDS-NKs: Resident myelodysplastic syndrome natural killers; rHD-NKs: Resident healthy donor natural killers; NK: Natural killer.
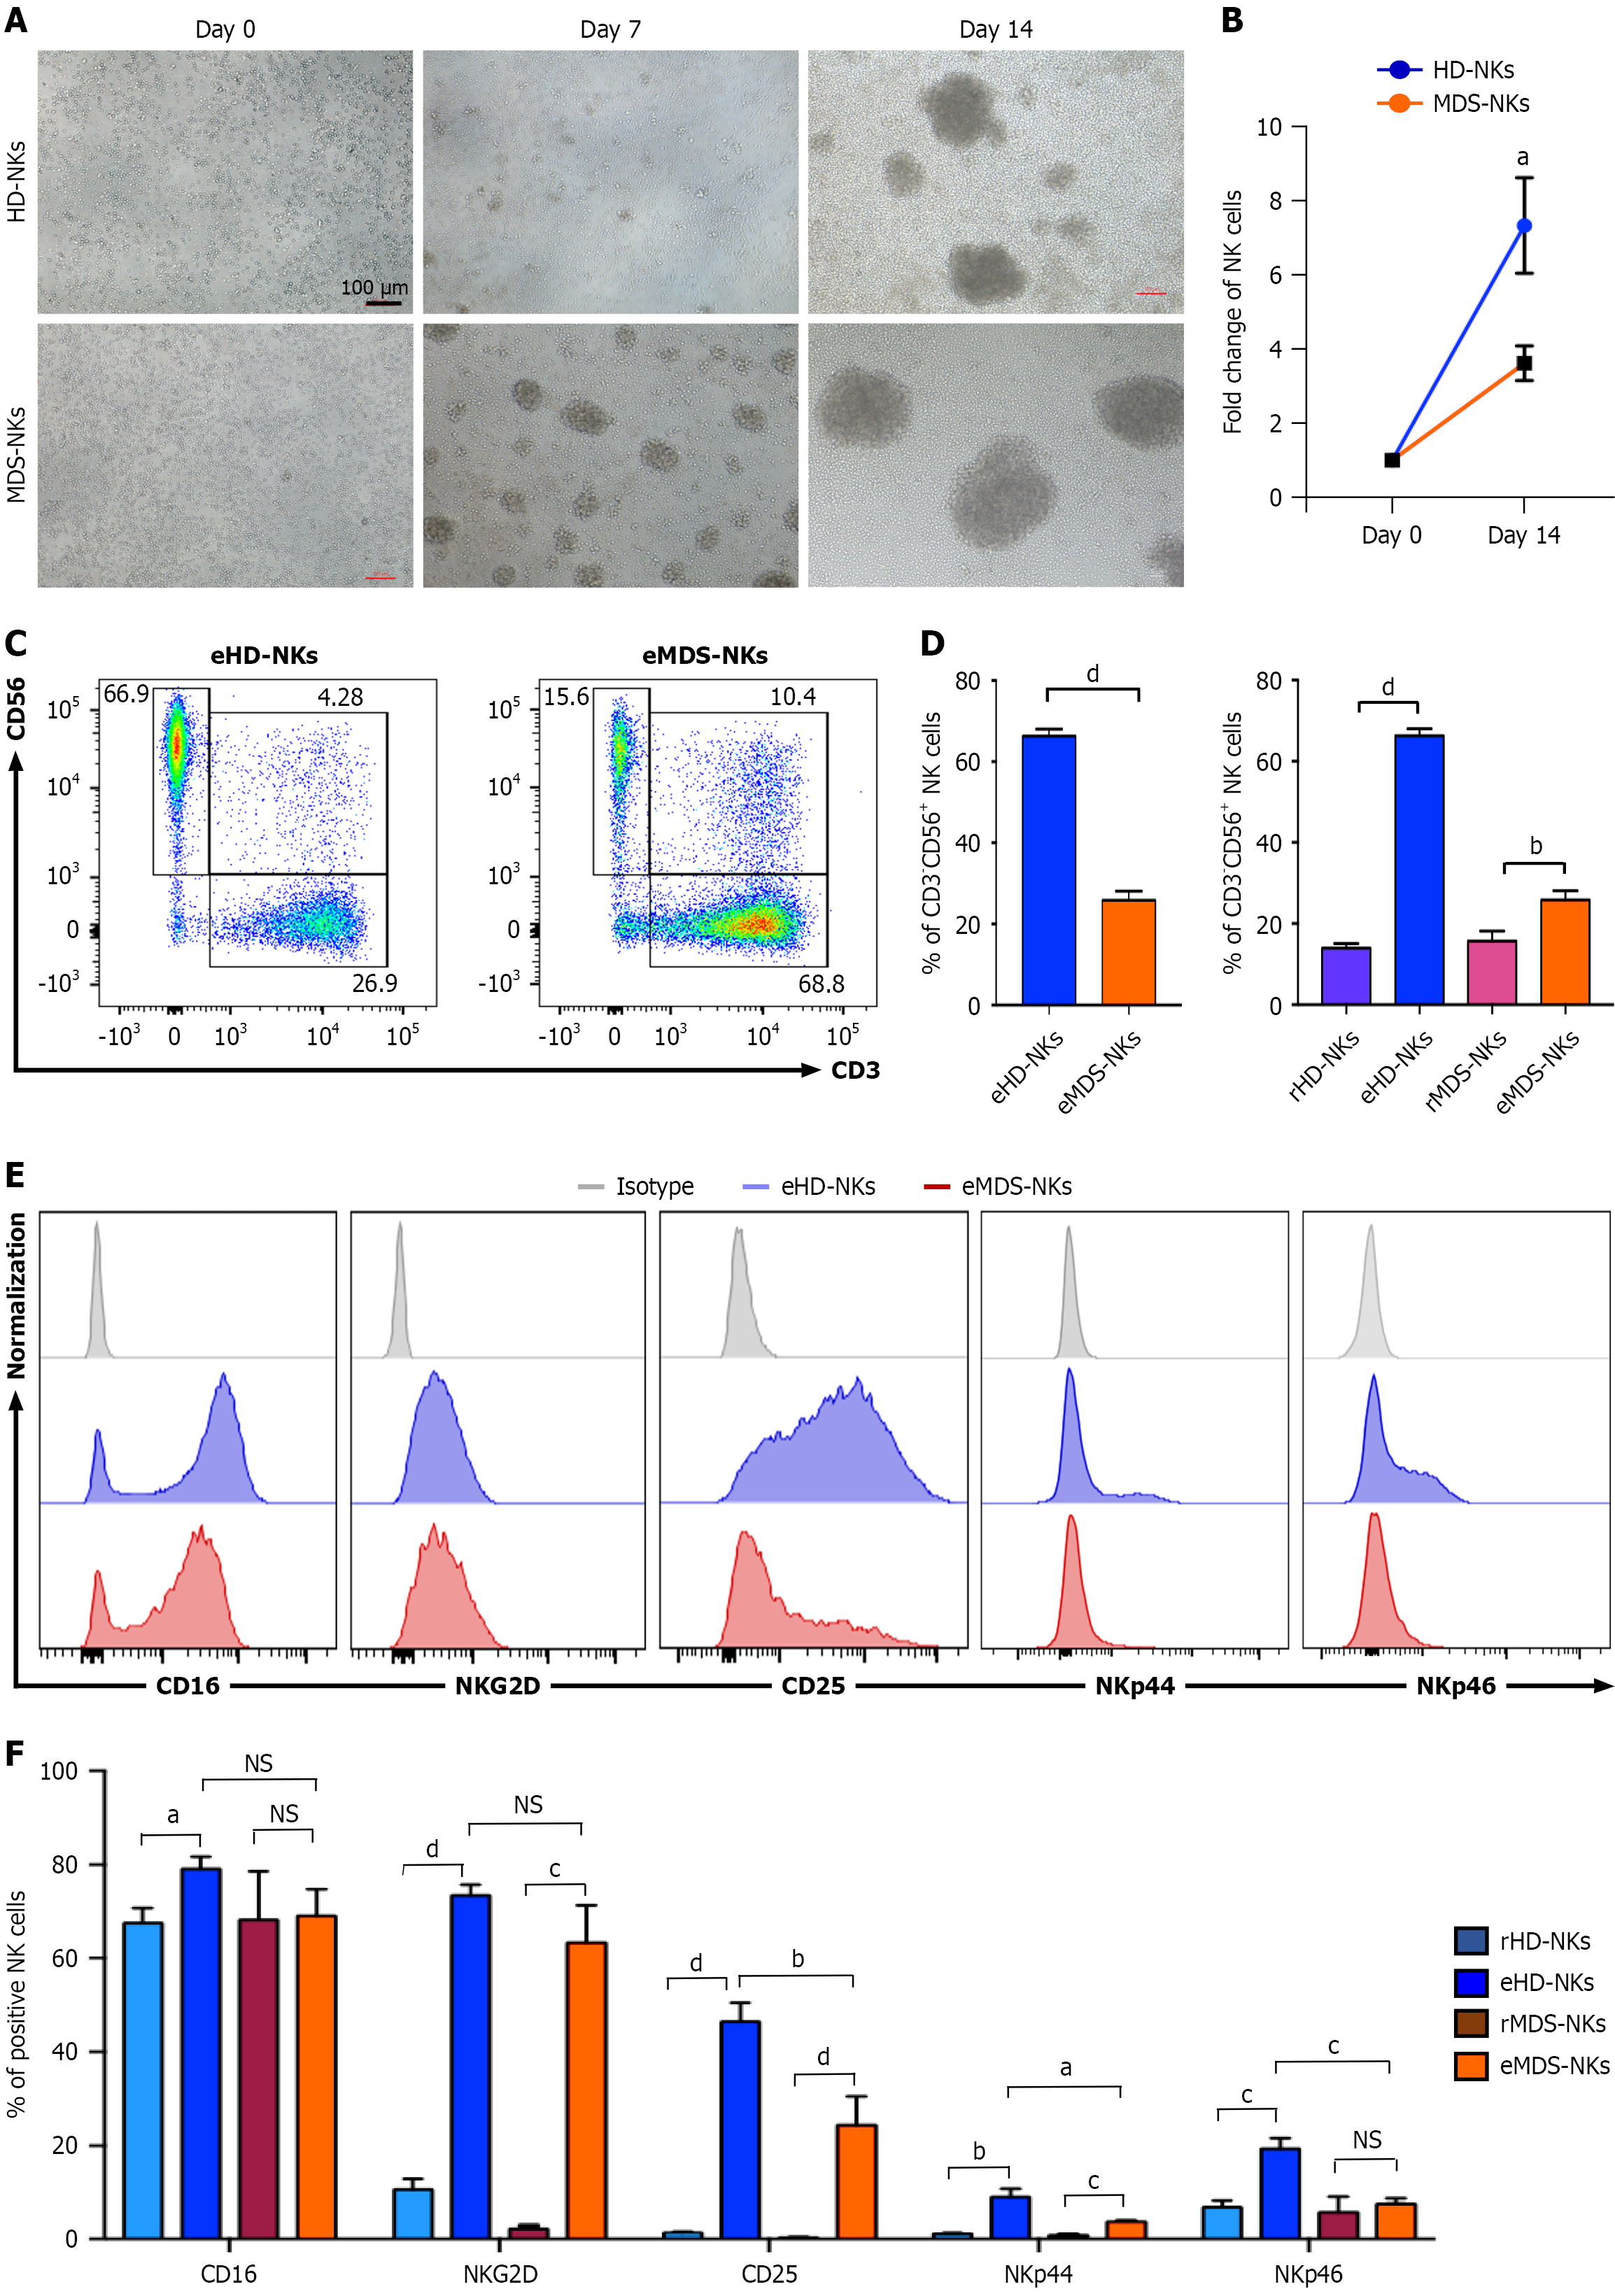
Figure 2 Comparison of the immunophenotype and components between expanded myelodysplastic syndrome natural killers and expanded healthy donor natural killers.
A: Representative phase contrast images of myelodysplastic syndrome natural killers (MDS-NKs) and healthy donor natural killers (HD-NKs) at the indicated time points (day 0, 7, 14) during the 14-day’s ex vivo expansion and activation. Scale bar = 100 μm; B: Fold change of total natural killers (NK) cells in the MDS-NKs and HD-NKs groups; C: Representative flow cytometry diagrams of CD3-CD56+ total NK cells in the MDS-NKs and HD-NKs groups; D: Statistical analyses of CD3-CD56+ total NK cells between the indicated groups (resident MDS-NKs vs resident HD-NKs, expanded MDS-NKs vs expanded HD-NKs); E and F: Representative flow cytometry diagrams (E) and statistical analyses (F) of total activated CD3-CD56+CD16+ NK cells and the indicated subsets (NKG2D+, CD25+, NKp44+, and NKp46+) in the indicated groups. Data were shown as mean ± SEM (n = 3 repetitions for each sample). aP < 0.05, bP < 0.01, cP < 0.001, dP < 0.0001, NS: Not significant. MDS-NKs: Myelodysplastic syndrome natural killers; HD-NKs: Healthy donor natural killers; NK: Natural killer; eMDS-NKs: Expanded myelodysplastic syndrome natural killers; eHD-NKs: Expanded healthy donor natural killers; rMDS-NKs: Resident myelodysplastic syndrome natural killers; rHD-NKs: Resident healthy donor natural killers.
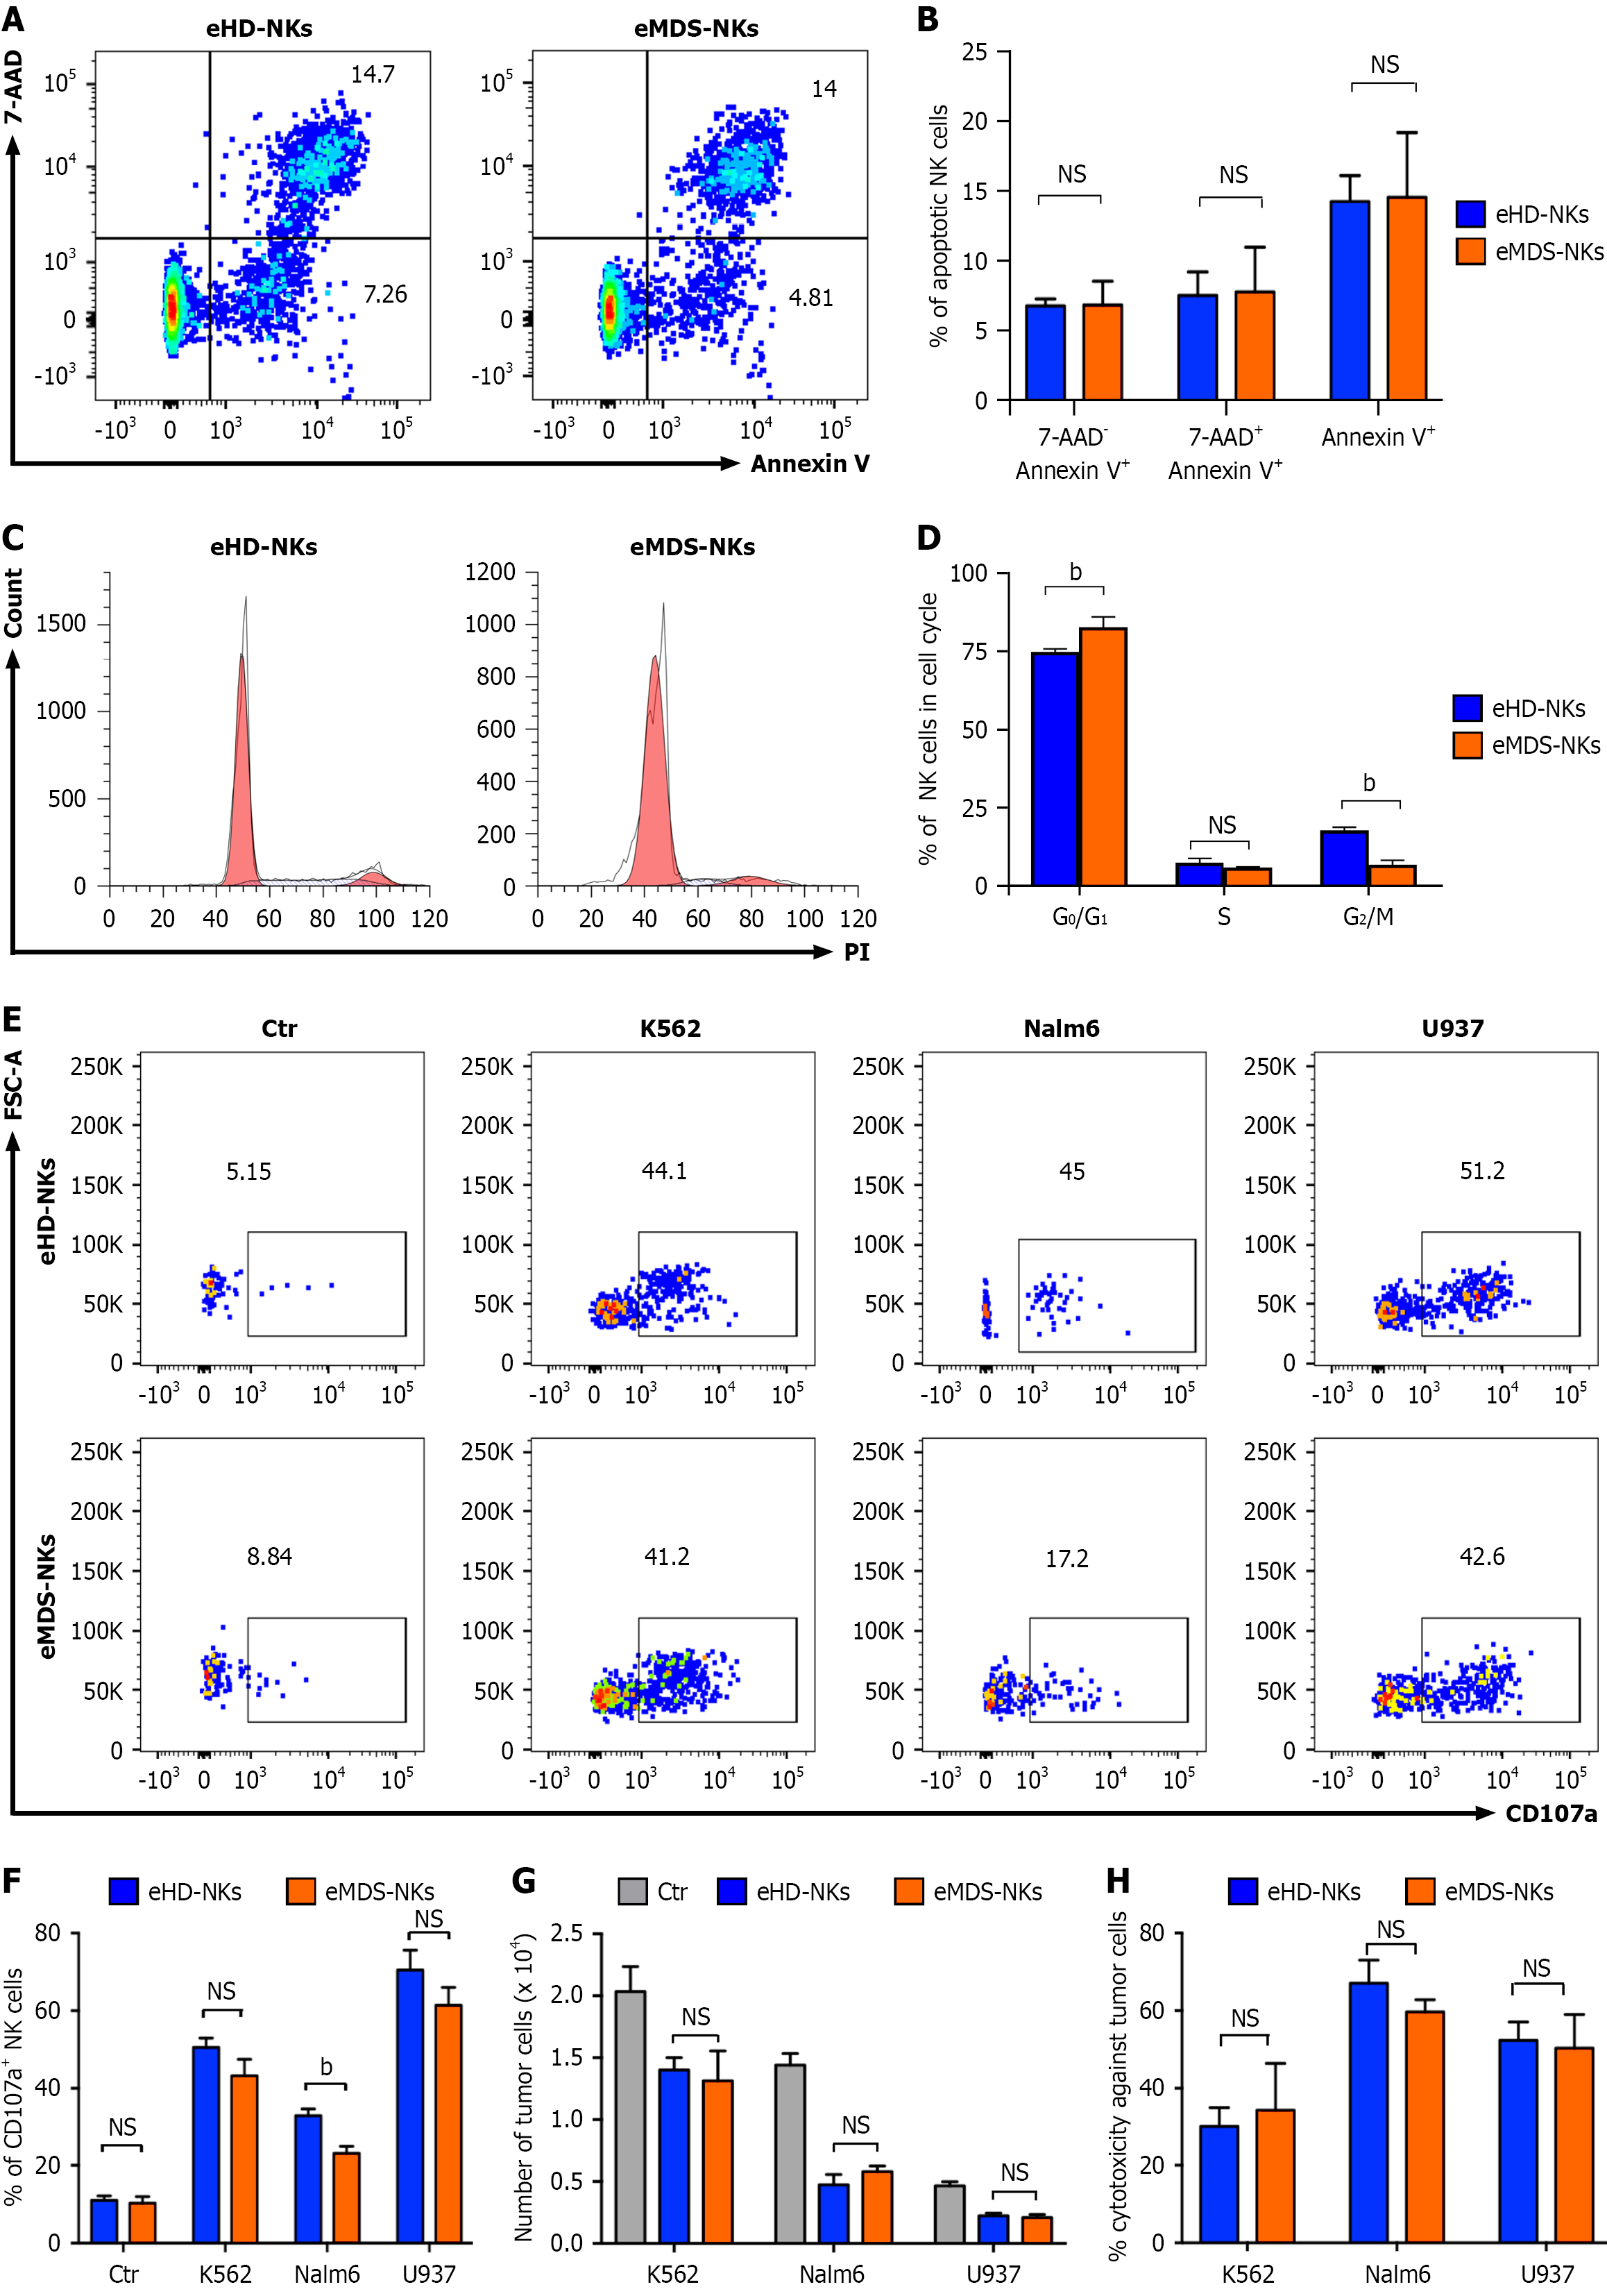
Figure 3 Cellular viability and cytotoxicity of expanded myelodysplastic syndrome natural killers and expanded healthy donor natural killers upon tumor cell lines.
A and B: Representative flow cytometry diagrams (A) and statistical analyses (B) of the apoptotic subsets in expanded myelodysplastic syndrome natural killers (eMDS-NKs) and expanded healthy donor natural killers (eHD-NKs); C and D: Representative flow cytometry diagrams (C) and statistical analyses (D) of cell cycle-related sub-stage distribution (G0/G1, S, G2/M) eMDS-NKs and eHD-NKs; E and F: Representative diagrams (E) and statistical analyses (F) of CD107a+ natural killer cells in the indicated groups (Ctr, K562, Nalm6, U937) at an effector-to-target ratio (1:5); G and H: The ex vivo cytotoxicity of eMDS-NKs and eHD-NKs according to the BV421-based fluorescence of the remaining surviving tumor cells. Data were shown as mean ± SEM (n = 3 repetitions for each sample). bP < 0.01, NS, not significant. eMDS-NKs: Expanded myelodysplastic syndrome natural killers; eHD-NKs: Expanded healthy donor natural killers.
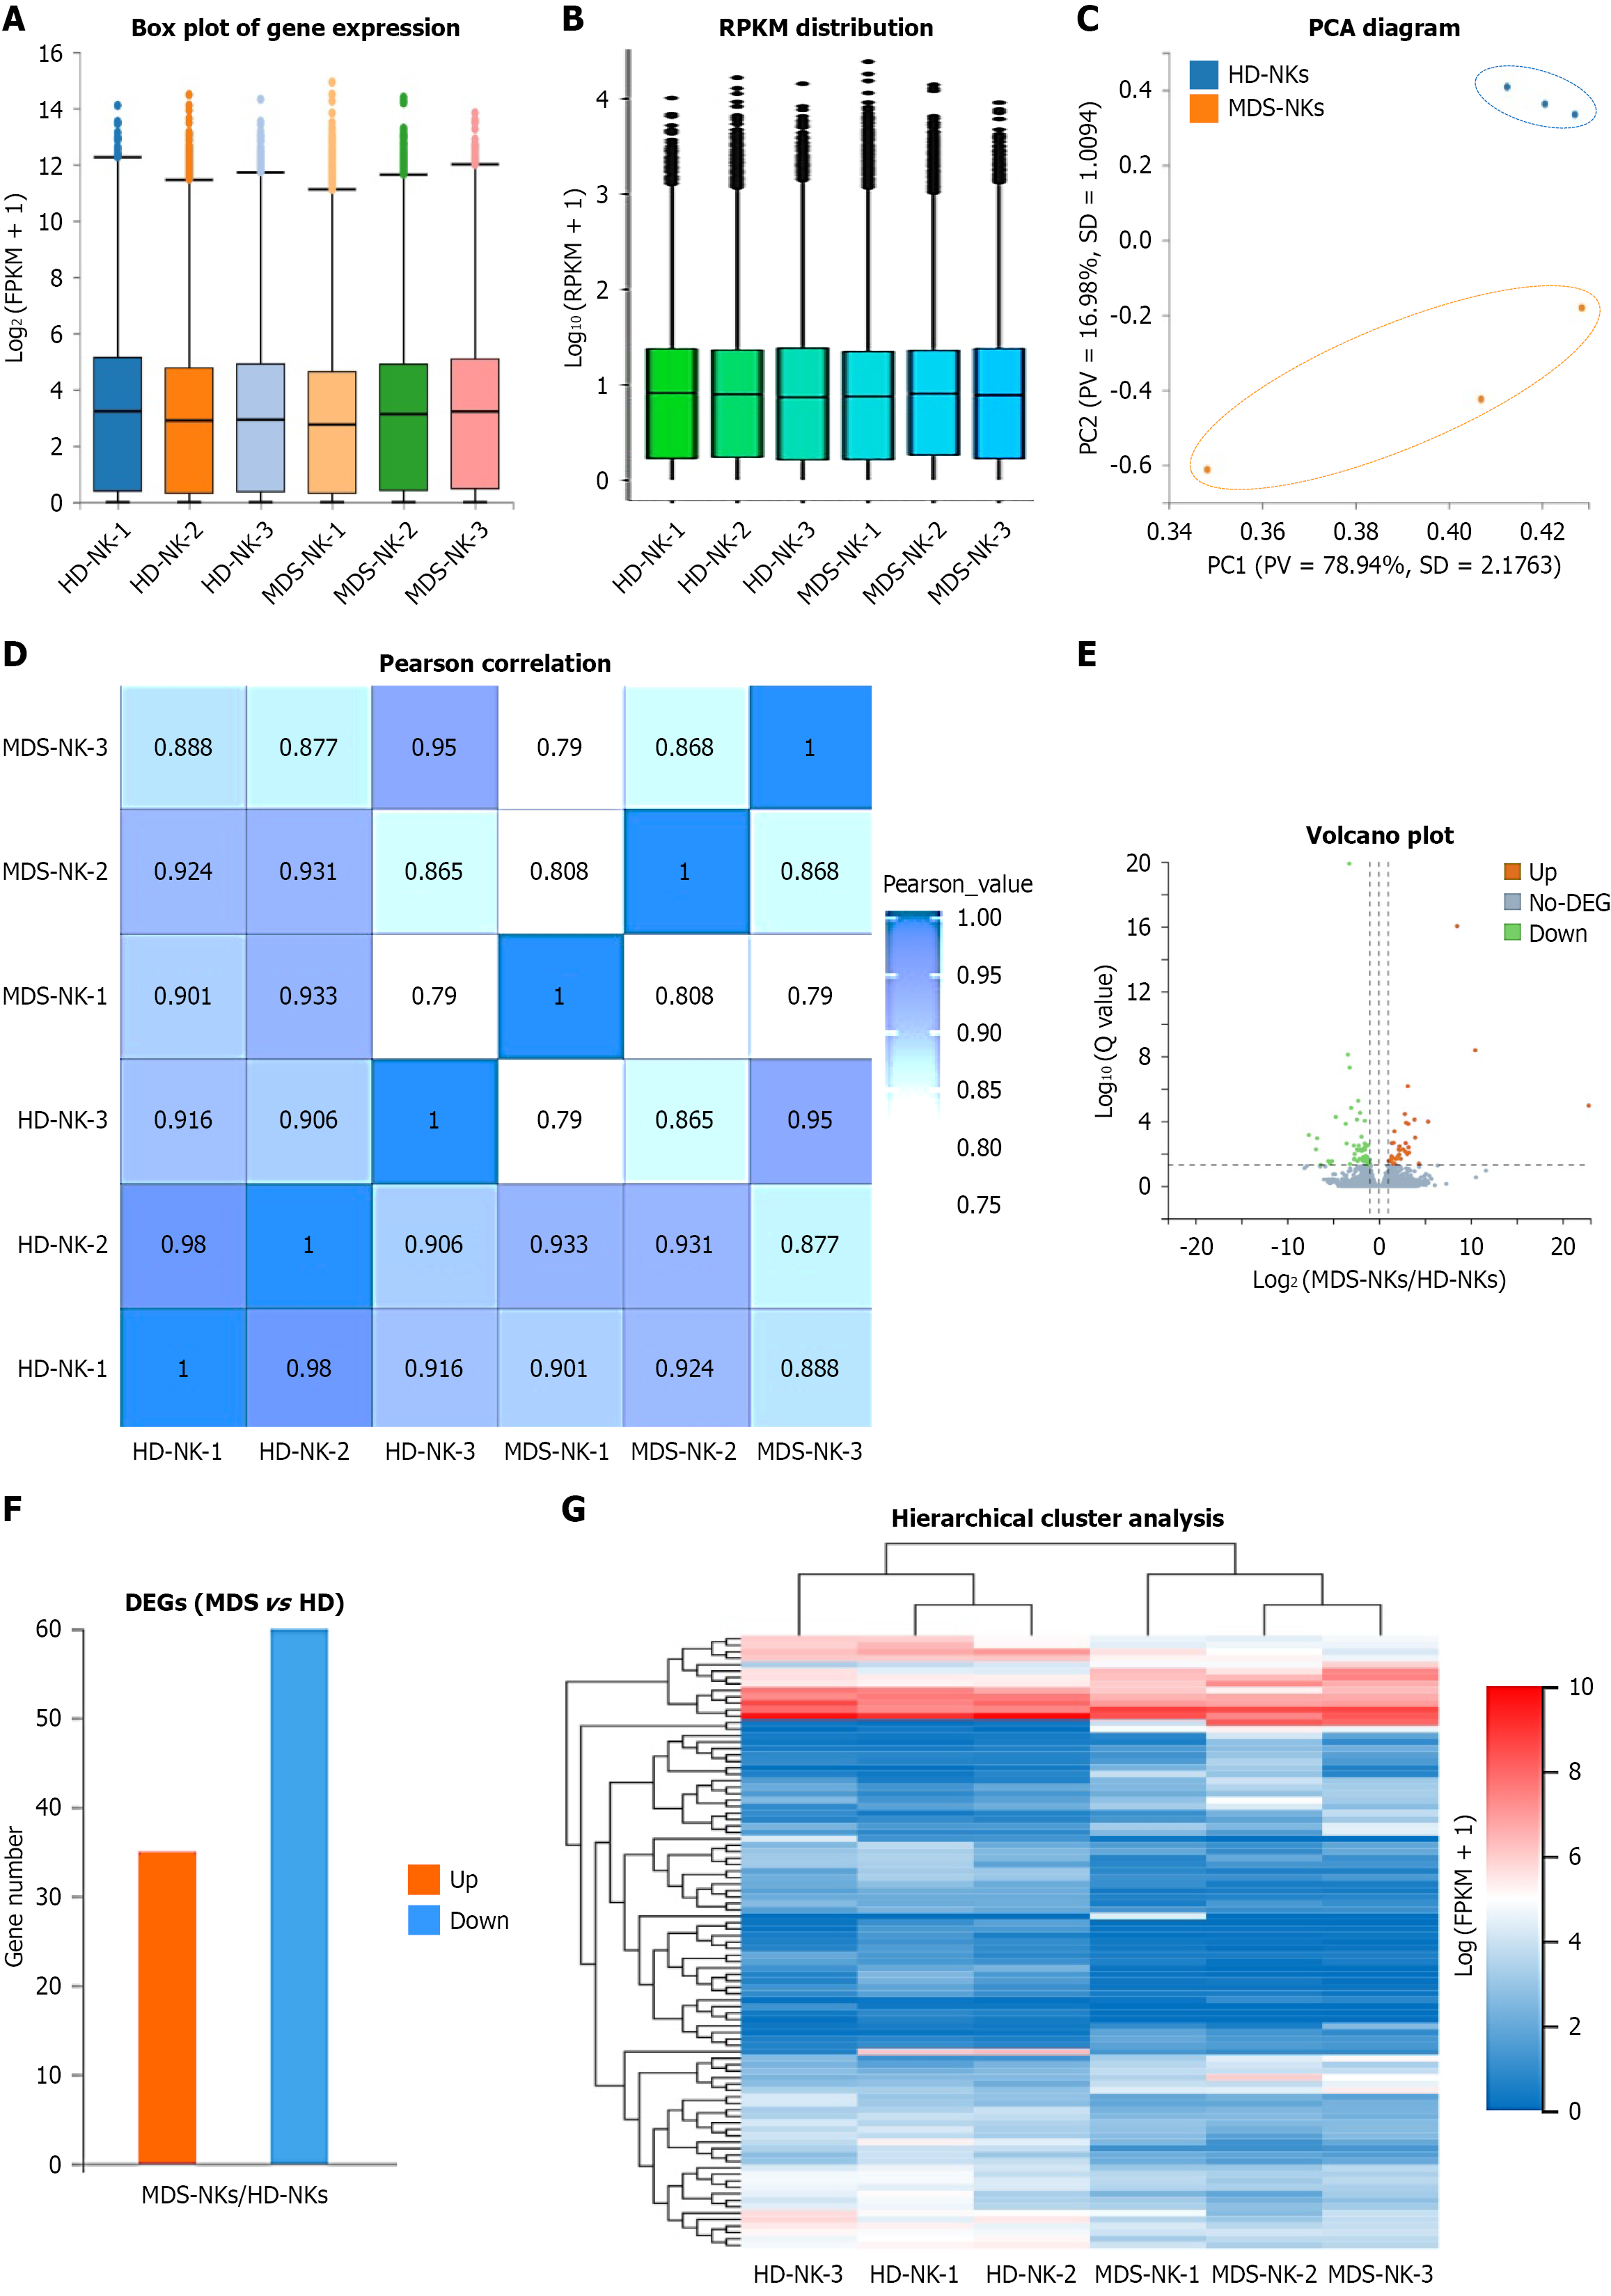
Figure 4 The gene expression pattern of expanded myelodysplastic syndrome natural killers and expanded healthy donor natural killers.
A and B: Box plot (A) and RPKM (short for Reads per Kilobase per Million mapped reads) diagram (B) showed the distribution of genes expression pattern in expanded myelodysplastic syndrome natural killers [myelodysplastic syndrome natural killers-1 (MDS-NKs-1), MDS-NK-2, MDS-NK-3] and expanded healthy donor natural killers [healthy donor natural killers-1 (HD-NK-1), HD-NK-2, HD-NK-3]; C and D: Principal components analysis (short for principal component analysis) and Pearson correlation analysis (D) of the indicated NK cells; E and F: Volcano plot diagram (E) and bar chart (F) showed the down-regulated differentially expressed genes (DEGs) (down), the up-regulated DEGs (up), and the non DEGs (no-DEG) between expanded myelodysplastic syndrome natural killers and expanded HD-NKs; G: HeatMap diagram revealed the hierarchical cluster pattern of DEGs between expanded myelodysplastic syndrome natural killers and expanded HD-NKs. MDS-NKs: Myelodysplastic syndrome natural killers; HD-NKs: Healthy donor natural killers; DEG: Differentially expressed genes.
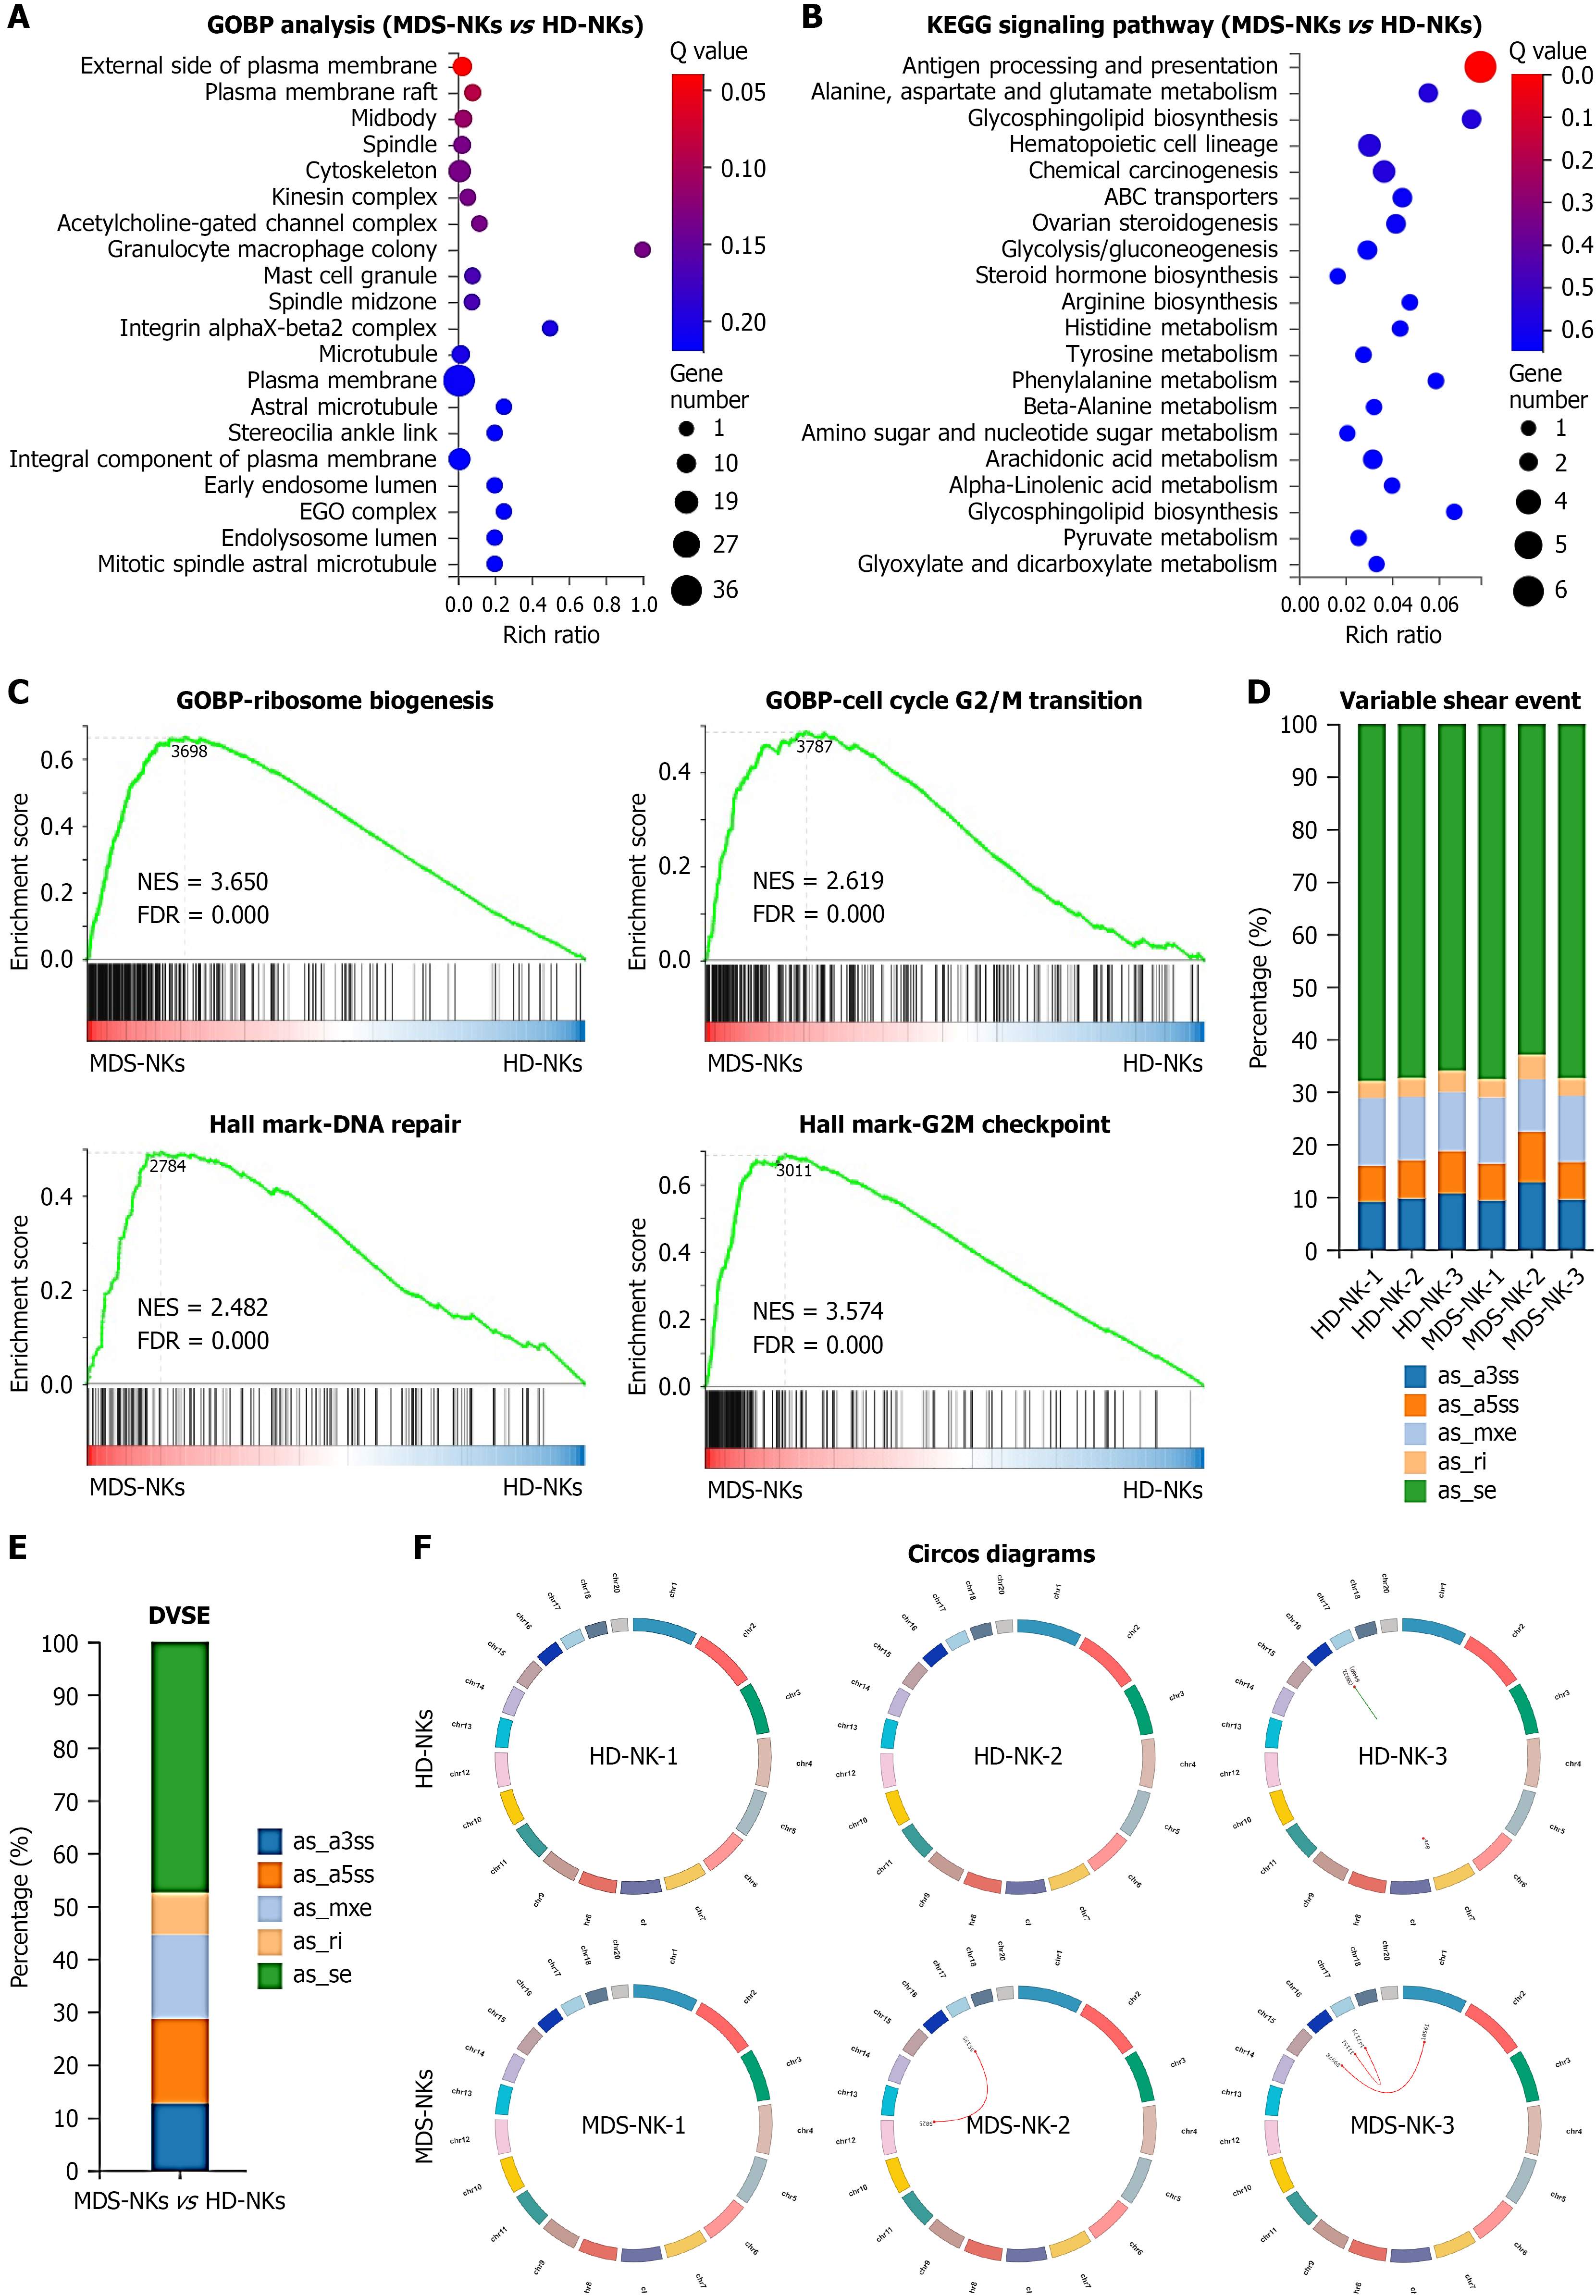
Figure 5 differentially expressed gene-based bioprocesses and somatic variations between expanded myelodysplastic syndrome natural killers and expanded healthy donor natural killers.
A and B: GOBP (short for gene ontology biological process) analysis (A) and KEGG (short for Kyoto encyclopedia of genes and genomes) signaling pathway analysis (B) of the differentially expressed genes between expanded myelodysplastic syndrome natural killers and expanded healthy donor natural killers according to the website (https://www.kegg.jp/); C: GSEA (short for gene set enrichment analysis) showed the enriched gene sets involved in the indicated bioprocesses; D and E: The distribution of genes with the indicated somatic variations, including variable shear events (D) and differentially variable shear events (E); F: Circos diagrams showed the distribution of genes with somatic variations in chromosomes of expanded myelodysplastic syndrome natural killers and expanded healthy donor natural killers. MDS-NKs: Myelodysplastic syndrome natural killers; HD-NKs: Healthy donor natural killers; GOBP: Short for gene ontology biological process; KEGG: Short for Kyoto encyclopedia of genes and genomes; NES: Normalized enrichment score; FDR: False discovery rate.
- Citation: Liu SY, Feng XM, Chen ZY, Chen ZQ, Shang YR, Linnebacher M, Wang YX, Zhang SS, Cai M, Zhang LS. Characterization of the cellular and transcriptomic landscapes of natural killer cells in hematopoietic microenvironment of myelodysplastic syndrome. World J Clin Oncol 2026; 17(10): 126647
- URL: https://www.wjgnet.com/2218-4333/full/v17/i10/126647.htm
- DOI: https://dx.doi.org/10.5306/wjco.126647