Copyright
©The Author(s) 2022.
World J Clin Oncol. Oct 24, 2022; 13(10): 835-847
Published online Oct 24, 2022. doi: 10.5306/wjco.v13.i10.835
Published online Oct 24, 2022. doi: 10.5306/wjco.v13.i10.835
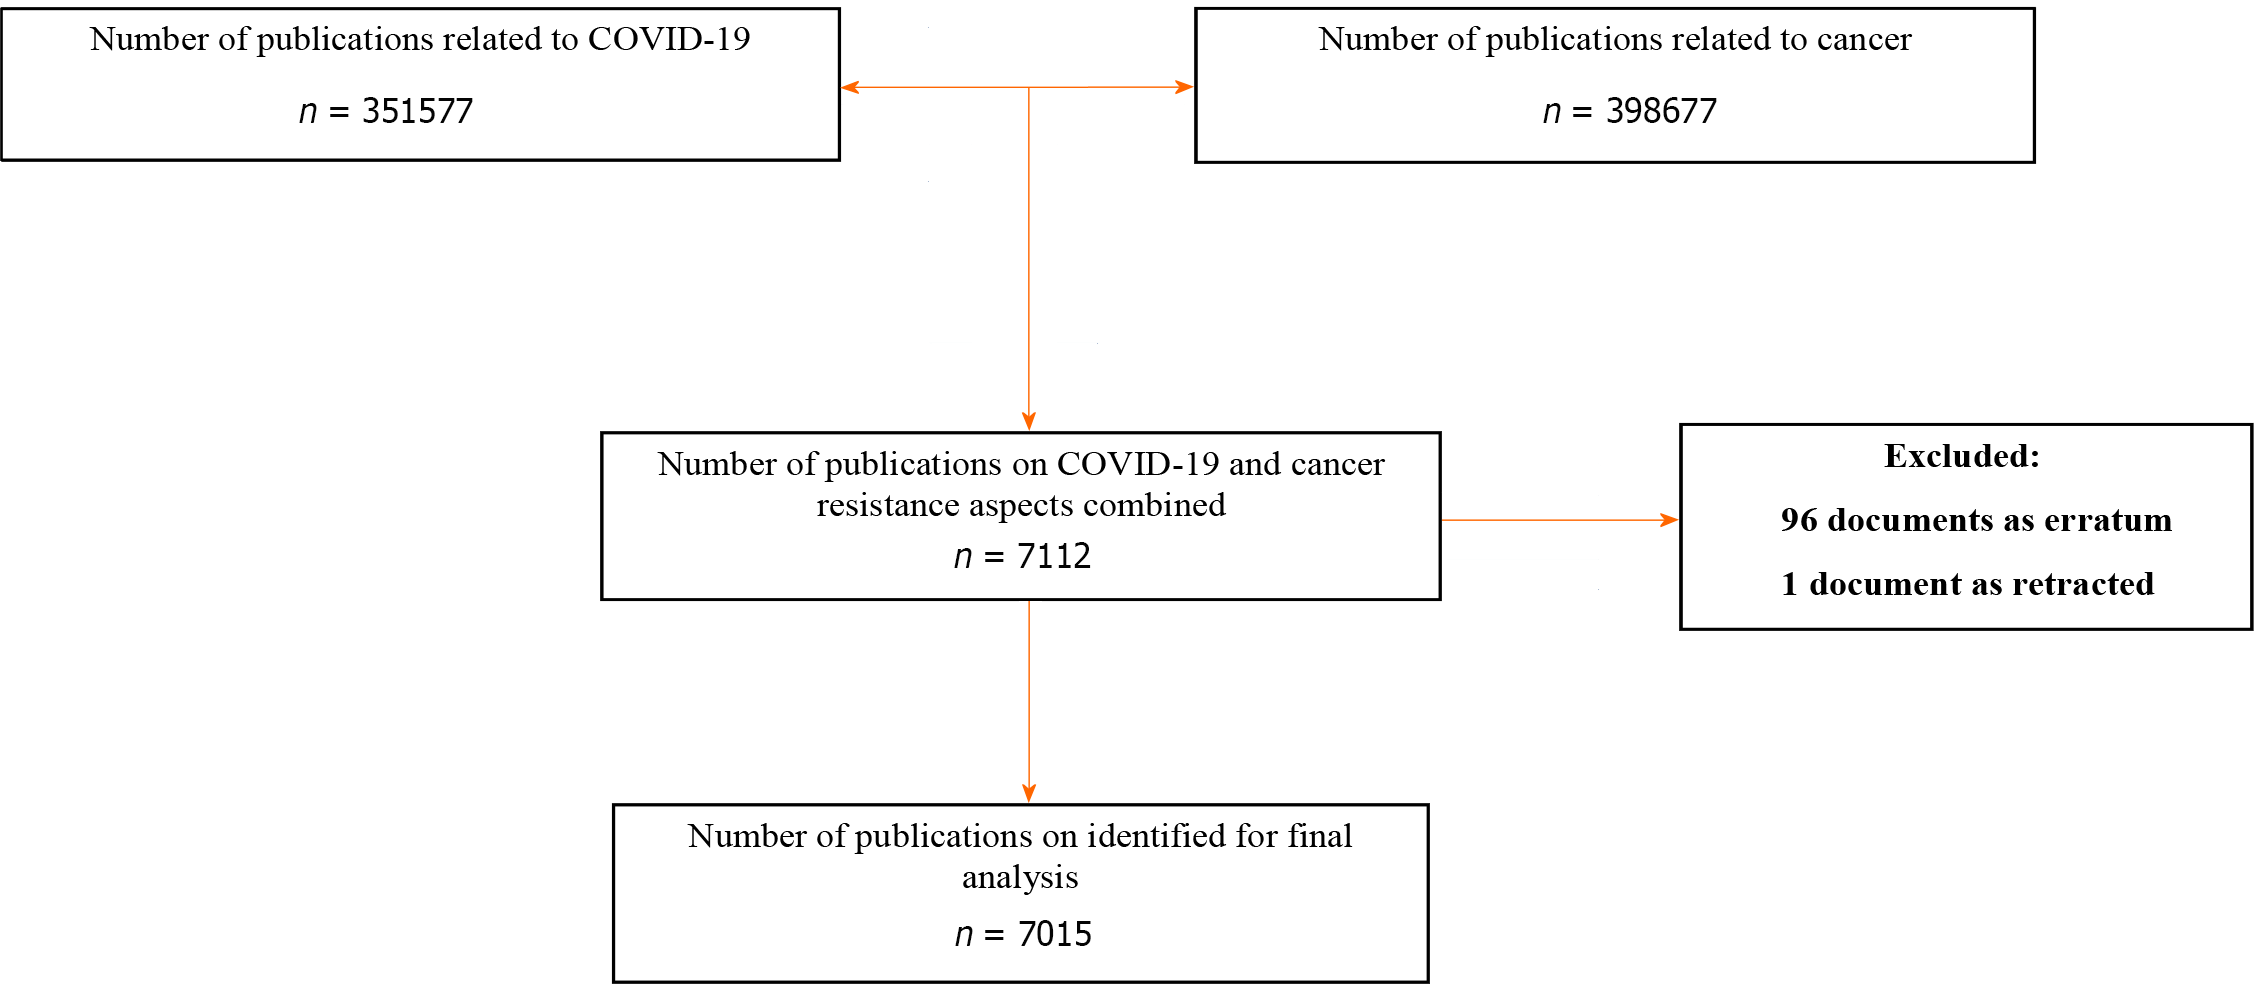
Figure 1 Flowchart for including and excluding literature studies.
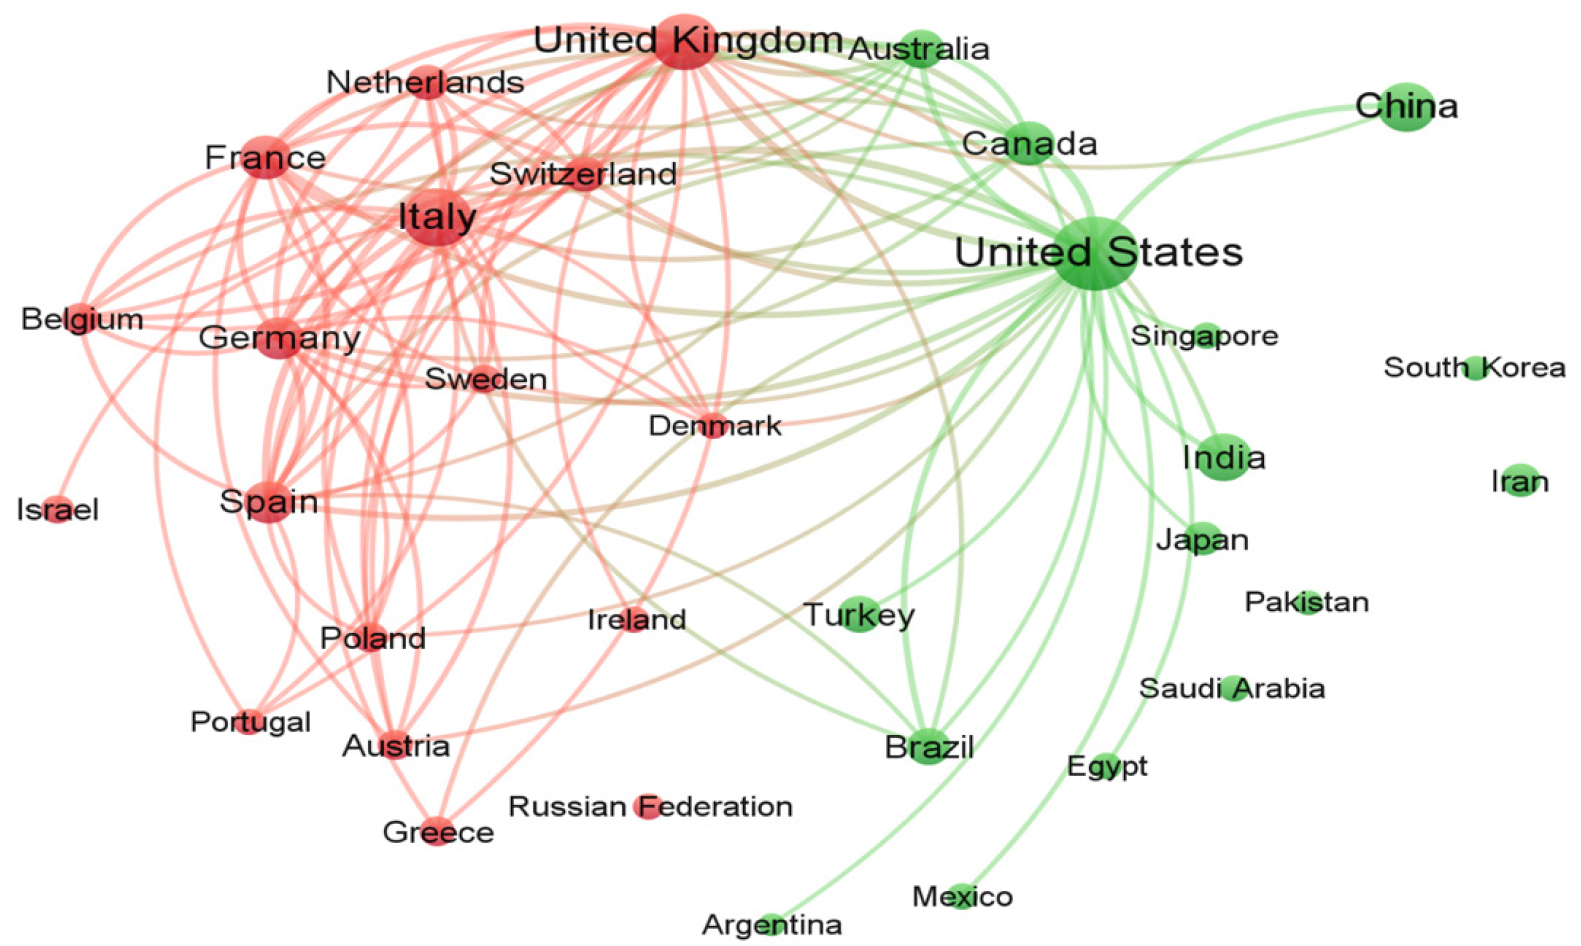
Figure 2 International collaboration in cancer and coronavirus disease 2019-related literature is visualized as a network map among the most active countries.
This graphical collaboration map was created after a minimum of 50 publications were placed in each country. Of 143 countries working in this field, 33 met this threshold. The node size denotes the number of publications for that country.
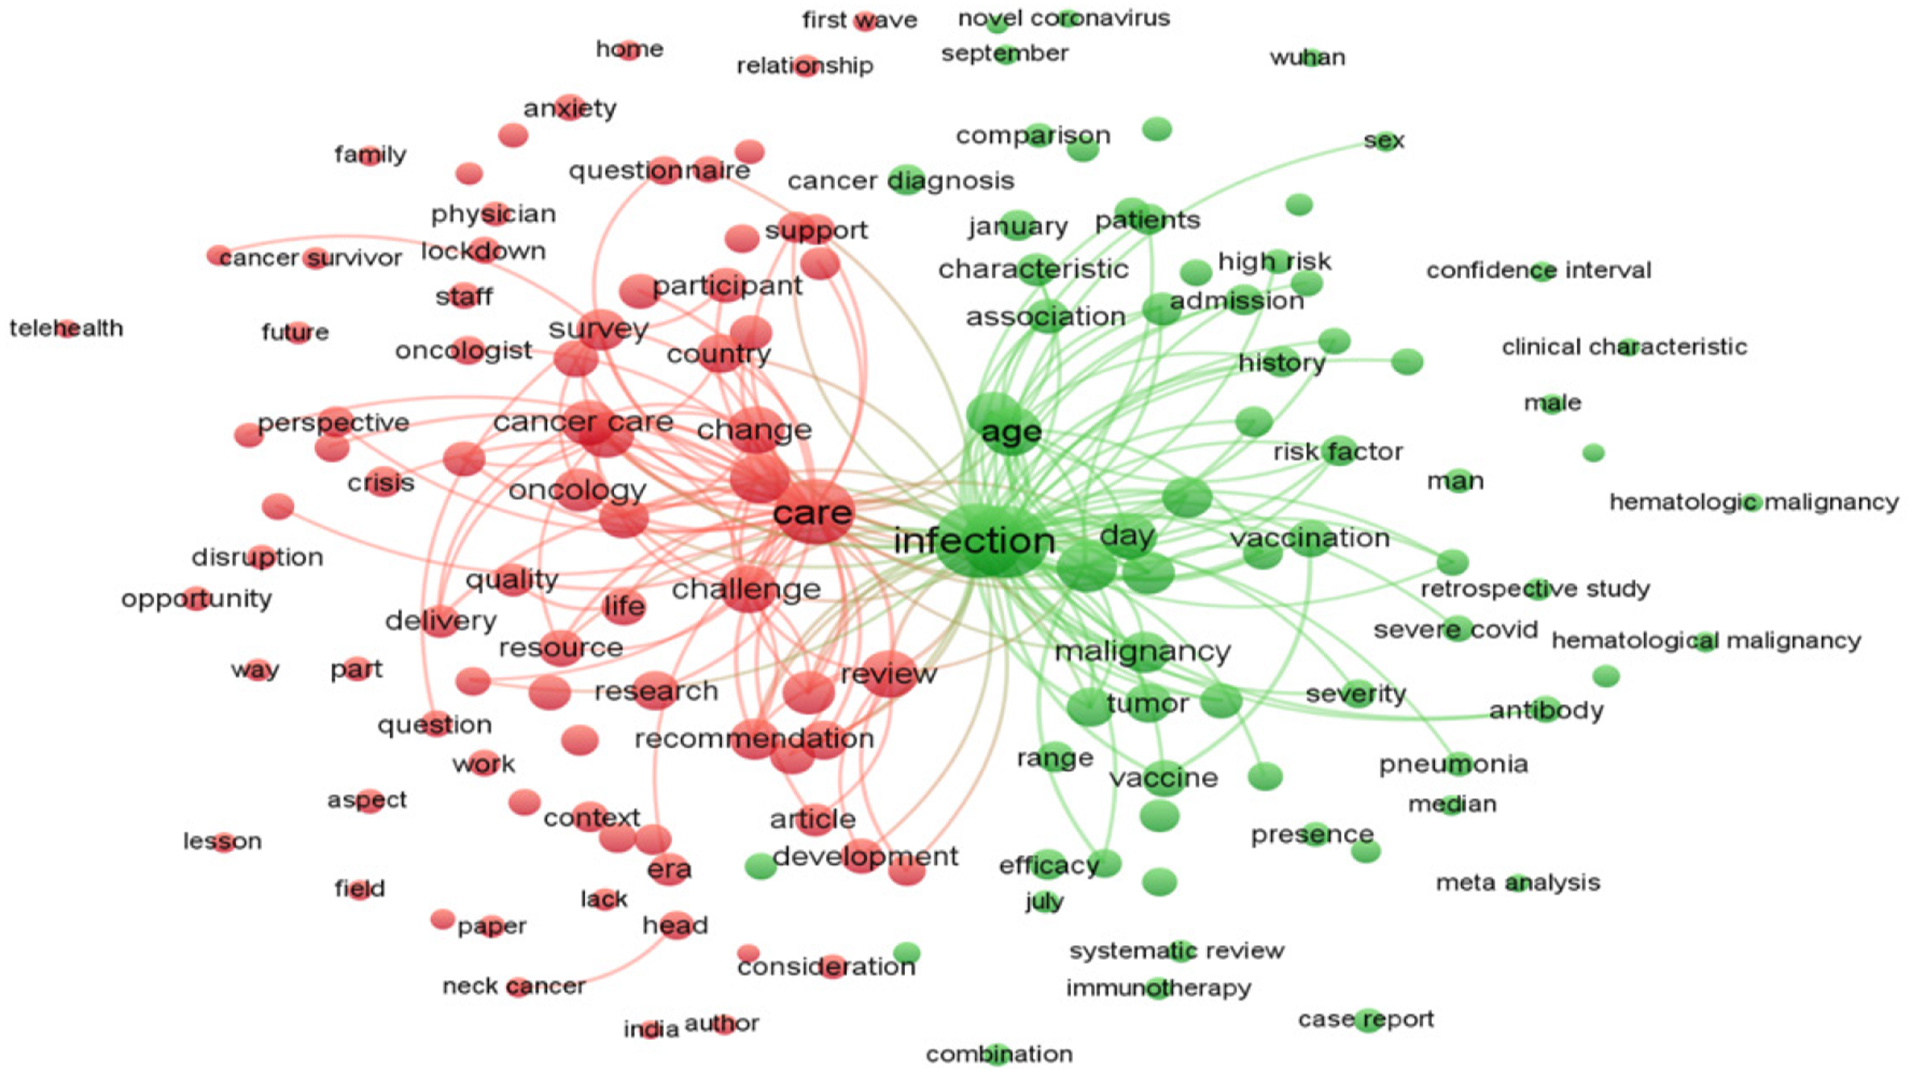
Figure 3 Map of terms in the title/abstract fields of papers relating to cancer and coronavirus disease 2019 as a network visualization.
This graphical map of terms was created by placing the minimum number of term occurrences at least 100 times. Out of 75191 terms in this field, 253 terms met this criterion, grouped into three clusters and colored differently. The node size denotes the number of articles that contain that term.
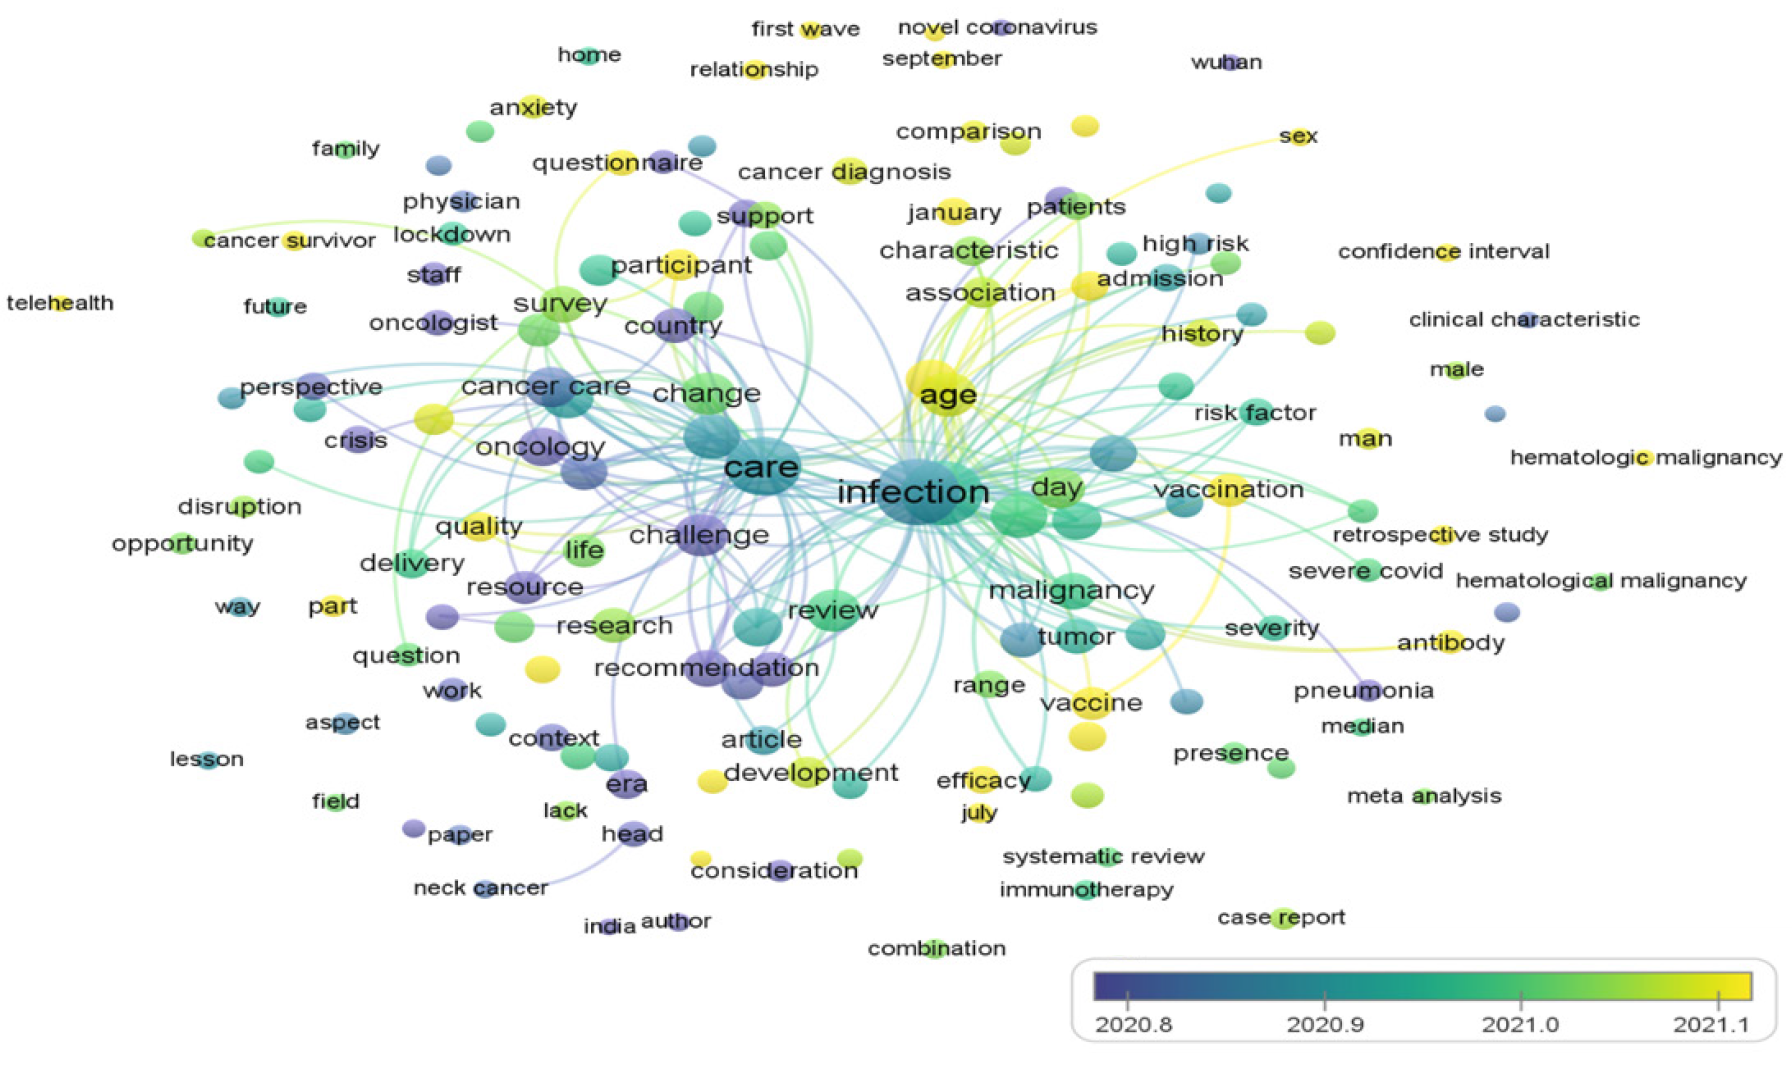
Figure 4 Overlay visualization of terms co-occurrence cluster analysis.
The color of the nodes, which denotes the average publication year, changes from dark blue to yellow, representing the average publication year of the keyword from 2000 to 2022.
- Citation: Zyoud SH, Koni A, Al-Jabi SW, Amer R, Shakhshir M, Al Subu R, Salameh H, Odeh R, Musleh S, Abushamma F, Abu Taha A. Current global research landscape on COVID-19 and cancer: Bibliometric and visualization analysis. World J Clin Oncol 2022; 13(10): 835-847
- URL: https://www.wjgnet.com/2218-4333/full/v13/i10/835.htm
- DOI: https://dx.doi.org/10.5306/wjco.v13.i10.835


