Copyright
©The Author(s) 2018.
World J Gastrointest Pharmacol Ther. Aug 7, 2018; 9(3): 22-30
Published online Aug 7, 2018. doi: 10.4292/wjgpt.v9.i3.22
Published online Aug 7, 2018. doi: 10.4292/wjgpt.v9.i3.22
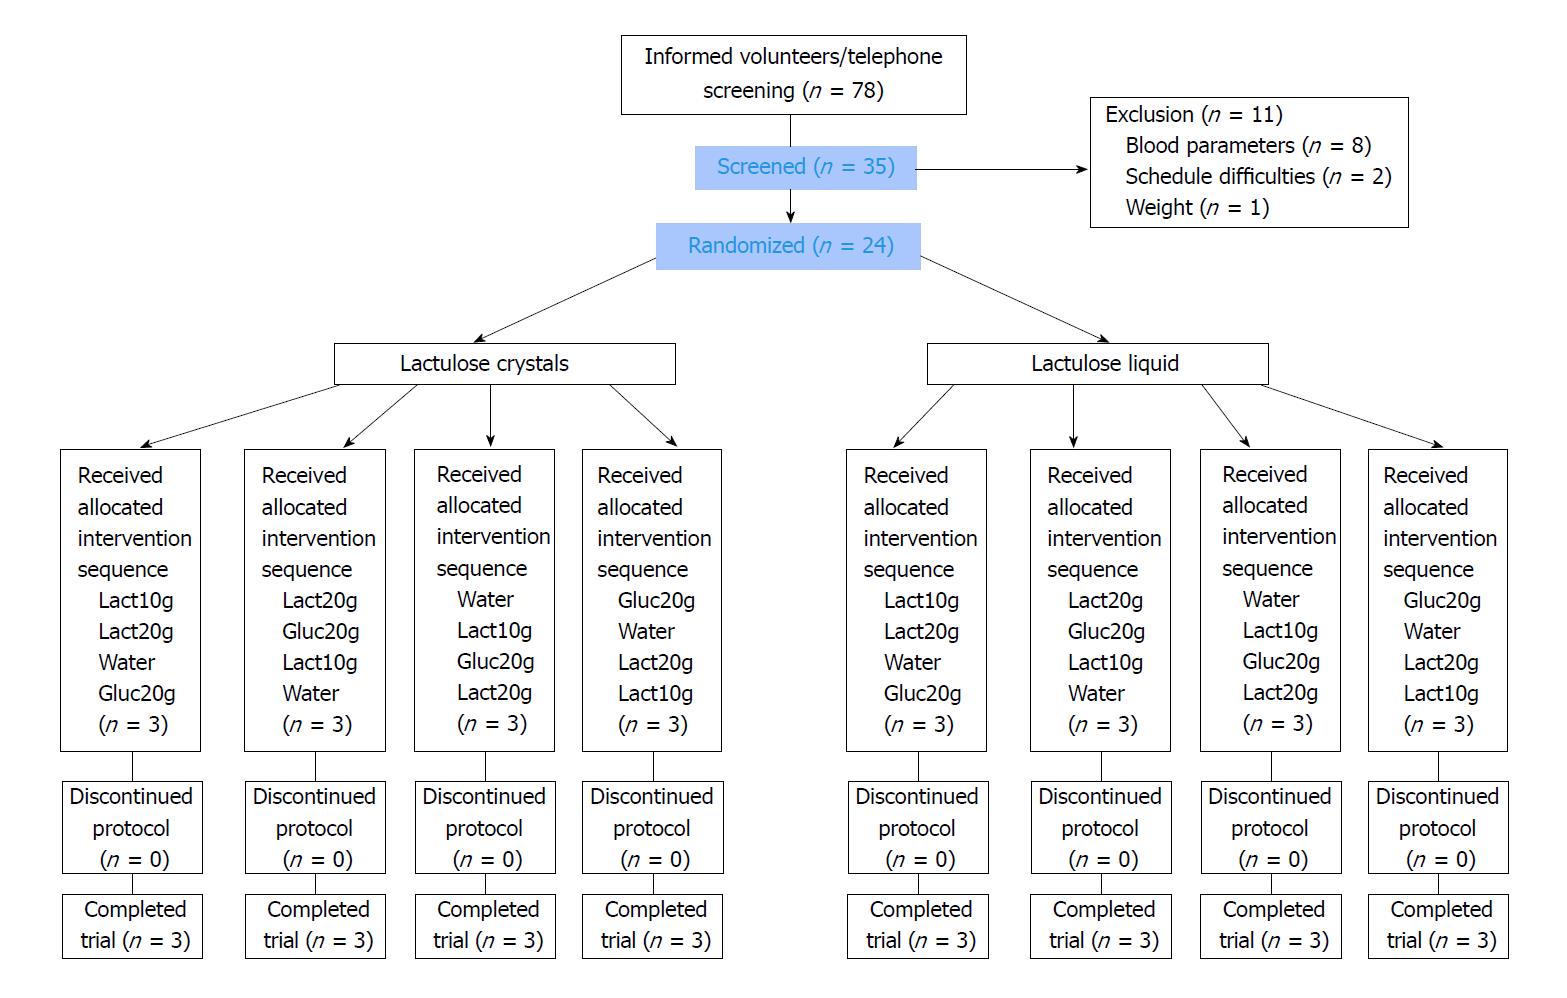
Figure 1 Flowchart demonstrating patient recruitment.
Lact10g: Lactulose 10 g; Lact20g: Lactulose 20 g; Gluc20g: Glucose 20 g.
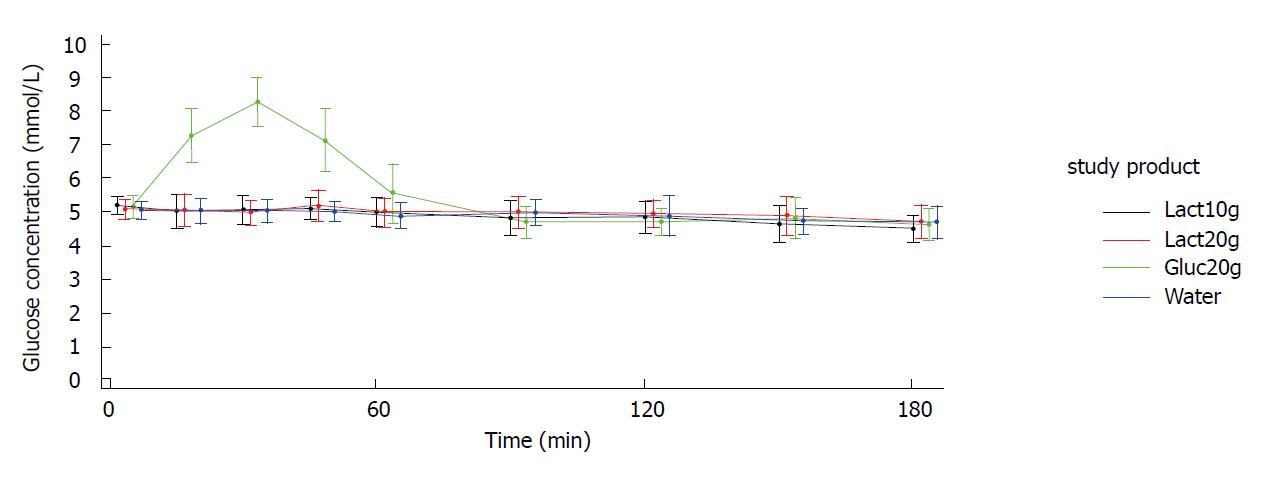
Figure 2 Display of mean ± SD glucose concentration - time curves.
Study arm: Crystals. Lact10g: Lactulose 10 g; Lact20g: Lactulose 20 g; Gluc20g: Glucose 20 g; Water: Water 250 mL; SD: standard deviation.
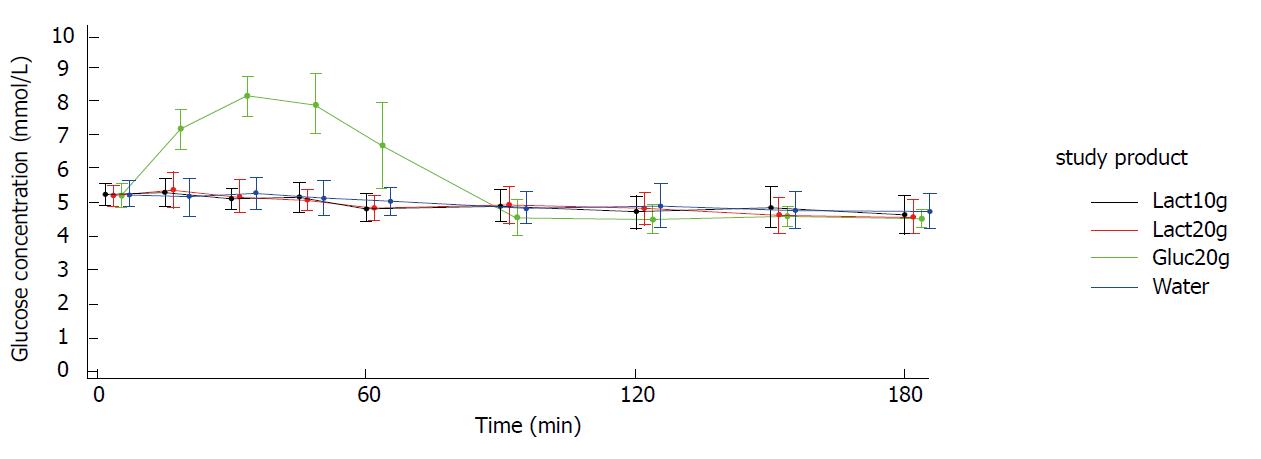
Figure 3 Display of mean ± SD glucose concentration - time curves.
Study arm: Liquid. Lact10g: Lactulose 10 g; Lact20g: Lactulose 20 g; Gluc20g: Glucose 20 g; Water: Water 250 mL; SD: standard deviation.
- Citation: Steudle J, Schön C, Wargenau M, Pauly L, Schwejda-Güttes S, Gaigg B, Kuchinka-Koch A, Stover JF. Blood glucose response after oral intake of lactulose in healthy volunteers: A randomized, controlled, cross-over study. World J Gastrointest Pharmacol Ther 2018; 9(3): 22-30
- URL: https://www.wjgnet.com/2150-5349/full/v9/i3/22.htm
- DOI: https://dx.doi.org/10.4292/wjgpt.v9.i3.22


