Copyright
©The Author(s) 2016.
World J Gastrointest Pharmacol Ther. Nov 6, 2016; 7(4): 540-549
Published online Nov 6, 2016. doi: 10.4292/wjgpt.v7.i4.540
Published online Nov 6, 2016. doi: 10.4292/wjgpt.v7.i4.540
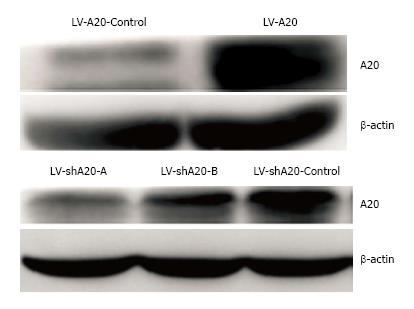
Figure 1 Expression of A20 in different groups.
HT-29 cells were transduced with LV-A20, LV-shA20, or LV-controls. Cytosolic lysates were tested by Western blotting using anti-A20 antibodies or anti-β-actin antibodies to normalize protein levels. In A20 overexpression cell lines, the expression of A20 was much higher than that of the control. Two shRNA sequences, A and B, were obtained, and the expression of A20 in both of the A20 knockdown groups were much lower than the control. The effect of A was more pronounced than B. Thus, sequence A was selected for subsequent experiments.
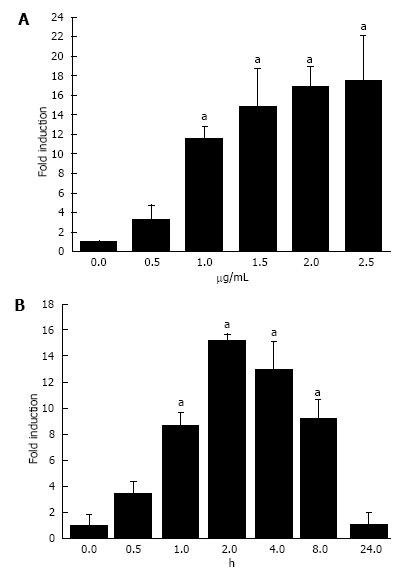
Figure 2 Relative A20 mRNA ratio in HT-29 cells after lipopolysaccharide stimulation with different doses or different time points.
CT was calculated for the genes of interest and for the housekeeping gene GAPDH. For each cDNA sample, the CT for GAPDH was subtracted from the CT for each gene of interest to obtain the parameter ΔCt, thereby normalizing the initial amount of RNA used. The amount of each target was calculated as 2ΔΔCt, where ΔΔCT is the difference between the ΔCT of the two cDNA samples to be compared. A: Cultured HT-29 cells were stimulated with LPS at different doses for 1 h, and the results showed that the expression of A20 was increased with increasing amounts of LPS stimulation. aP < 0.05 vs non-stimulated cells; B: HT-29 cells were treated with 1 μg/mL LPS at various time points (0-8 h). The expression of A20 was very low in HT-29 cells without LPS stimulation but was rapidly increased and peaked at 2 h. aP < 0.05 vs non-stimulated cells and cells stimulated for 24 h. LPS: Lipopolysaccharide.
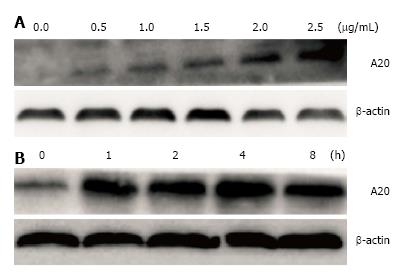
Figure 3 Expression of A20 in HT-29 cells after lipopolysaccharide stimulation with different doses or different time points.
A: Cultured HT-29 cells were stimulated with lipopolysaccharide (LPS) at different doses for 1 h. Western blotting analysis showed that the expression of A20 was increased with increasing amounts of LPS stimulation; B: HT-29 cells were treated with 1 µg/mL LPS at various time points (0-8 h). Western blotting analysis showed that the expression of A20 was rapidly increased and maintained at a high level for 1-4 h after stimulation with LPS.
Figure 4 Overexpression of A20 decreased the level of nuclear factor-κB.
Control group, A20 overexpression group and A20 knockdown group cells were treated with LPS (1 μg/mL) for 2 h. Western blotting showed that overexpression of A20 significantly decreased the level of NF-κB p65, whereas down-regulation of A20 increased NF-κ p65 expression. LPS: Lipopolysaccharide; NF: Nuclear factor.
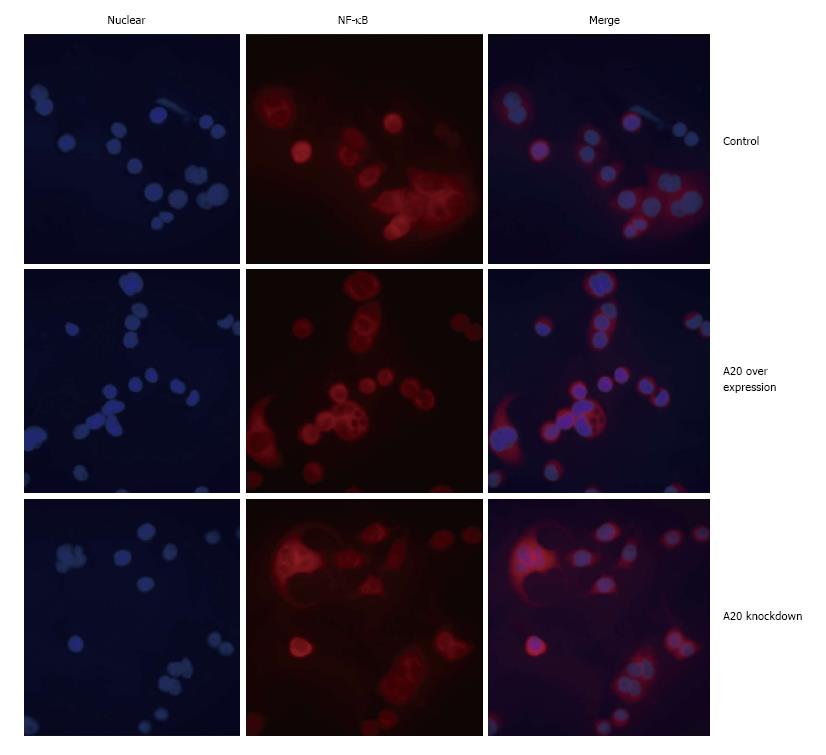
Figure 5 A20 inhibited nuclear factor-κB activation and translocation to the nucleus.
Immunofluorescence was performed to detect the intracellular localization of NF-κB using anti-NF-κB p65 primary antibodies and fluorescent secondary antibodies (red) followed by confocal microscopy. DAPI-stained nuclei appear in blue. Weaker fluorescence intensity in the nucleus was detected in A20 overexpression cell lines.
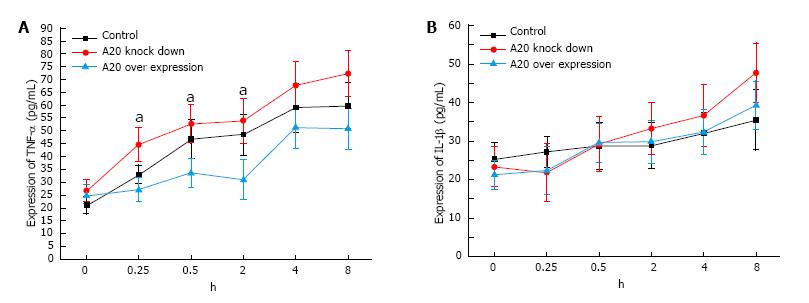
Figure 6 Expression of tumor necrosis factor-α and interleukin-1β in different groups.
A: There was no significant difference in the expression of TNF-α among the control group, A20 knockdown-control group and A20 overexpression-control group. At 0.25 h, 0.5 h and 2 h, the expression of TNF-α in the A20 overexpression group was lower than the control group and A20 knockdown group, and the expression of TNF-α in the A20 knockdown group was higher than the control group; B: There was no significant difference in the expression of IL-1β in the control group, A20 knockdown group and A20 overexpression group after 8 h of LPS stimulation. aP < 0.05. IL: Interleukin; TNF: Tumor necrosis factor; LPS: Lipopolysaccharide.
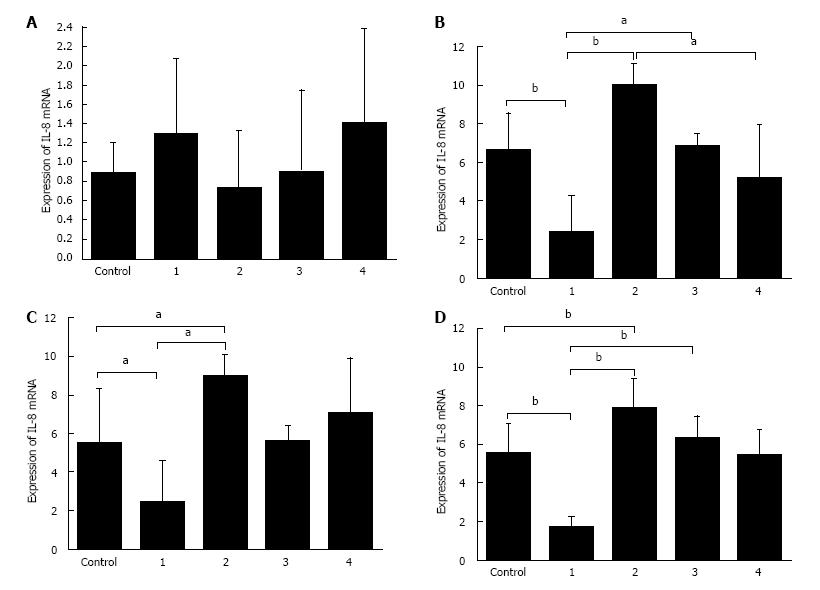
Figure 7 Interleukin-8 mRNA expression in different cell groups.
1: A20 overexpression group; 3: A20 overexpression-control group; 2: A20 knockdown group; 4: A20 knockdown-control group; A: Expression of IL-8 mRNA in different groups without LPS stimulation; B: Expression of IL-8 mRNA in different groups with LPS stimulation for 2 h; C: Expression of IL-8 mRNA in different groups with LPS stimulation for 4 h; D: Expression of IL-8 mRNA in different groups with LPS for 8 h. There were no significant differences in the IL-8 mRNA among the different groups without LPS stimulation. At some time points, the expression of IL-8 in the A20 overexpression group was lower than the control group and A20 knockdown group, and the expression of IL-8 in A20 knockdown group was higher than both the control group and A20 overexpression group. aP < 0.05, bP < 0.01. IL: Interleukin; TNF: Tumor necrosis factor; LPS: Lipopolysaccharide.
- Citation: Zheng CF, Shi JR, Huang Y, Wang SN. A20 inhibits lipopolysaccharide-induced inflammation in enterocytes. World J Gastrointest Pharmacol Ther 2016; 7(4): 540-549
- URL: https://www.wjgnet.com/2150-5349/full/v7/i4/540.htm
- DOI: https://dx.doi.org/10.4292/wjgpt.v7.i4.540


