Copyright
©The Author(s) 2017.
World J Gastrointest Pathophysiol. Aug 15, 2017; 8(3): 117-126
Published online Aug 15, 2017. doi: 10.4291/wjgp.v8.i3.117
Published online Aug 15, 2017. doi: 10.4291/wjgp.v8.i3.117
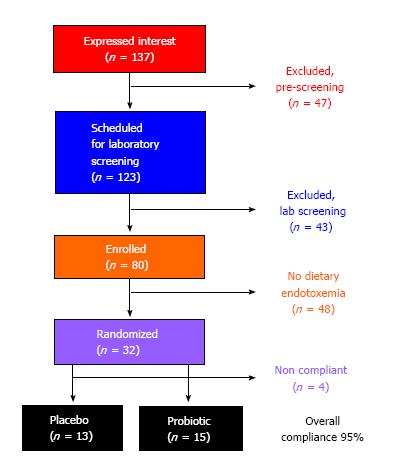
Figure 1 Represents the consort diagram for the study that indicates the number of participants that matriculated through the study.
Subjects were carefully screened for exclusion/inclusion criteria and if qualified were enrolled in the study. Consistent with our preliminary data 2 out of every 6 subjects presented a dietary/metabolic endotoxin response following consumption of the high-fat meal. A total of 26 individuals were identified to have the “responder” phenotype and were randomized to participate in either the probiotic or placebo condition.
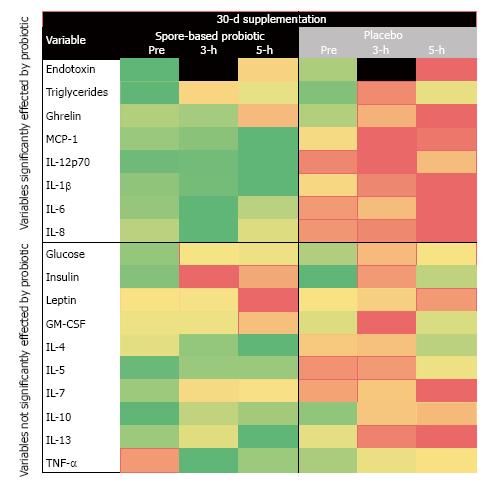
Figure 2 The change score for each variable compared to baseline was calculated and plotted as a heat map for probiotic vs placebo.
Venous blood samples were collected prior to 3, and 5-h after consumption of a high-fat, high-calorie meal. Serum samples were analyzed using various accepted methods. Variables were divided into those that demonstrated a significant (upper panel) and those that did not (lower panel) have a significant probiotic effect. Responses were coded a lower (green to yellow) or higher (yellow to red) compared to baseline. An unchanged (yellow) response was also identified. TNF: Tumor necrosis factor; IL: Interleukin.
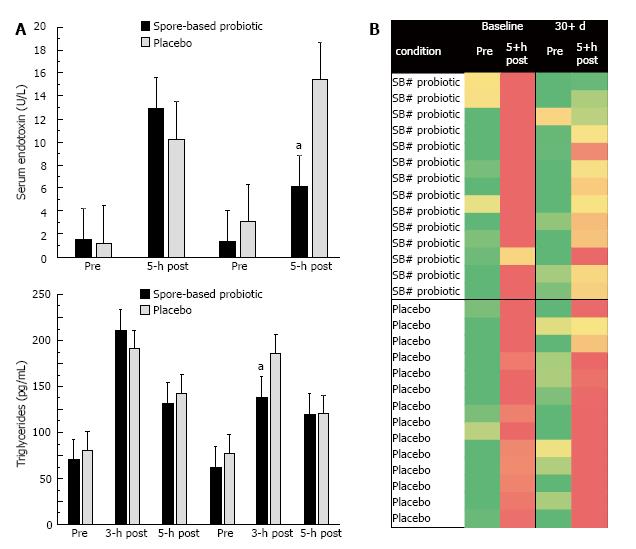
Figure 3 Serum endotoxin (A) and triglyceride (B) response to consumption of a commercially available high-fat, high-calorie pizza meal.
aP < 0.05 indicates significantly less than placebo, less than pre-meal, less than and same time point at baseline. Venous blood samples were collected following an overnight fast and abstention from exercise. Serum samples were analyzed using an automated chemistry analyzer. Subjects consumed an oral probiotic supplement for 30-d and the experimental meal challenge was completed at baseline and following the 30-d supplementation period. Probiotic responses were compare to placebo. Panel C demonstrates individual variability in the dietary endotoxin response prior to and after the 30-d supplementation period. Red indicates a large dietary endotoxin response (> 5 fold increase from pre-meal) and green indicates a small dietary endotoxin response (< 1 fold increase from pre-meal).
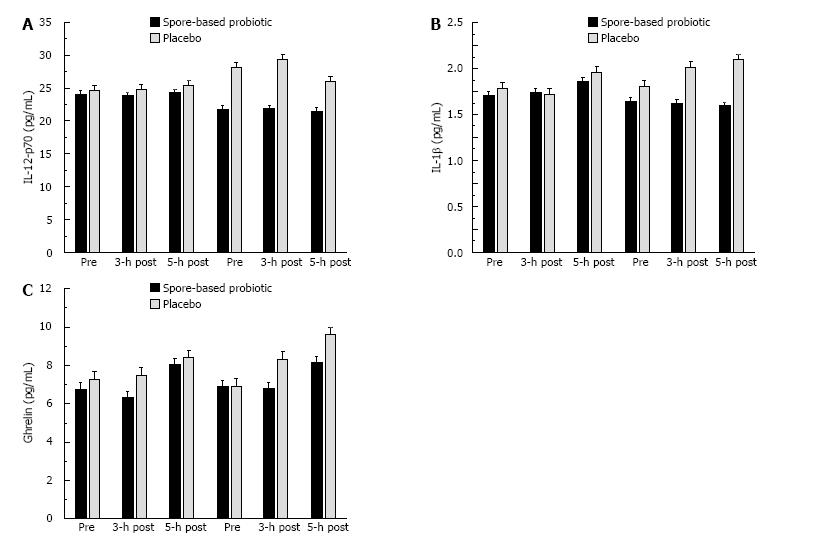
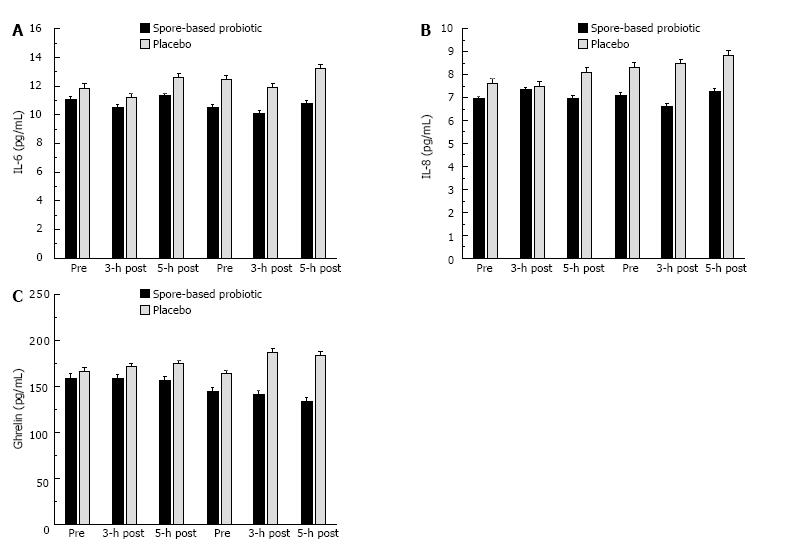
Figure 4 Serum IL-12p70 (A), IL-1β (B), and ghrelin (C) response to consumption of a commercially available high-fat, high-calorie pizza meal.
Venous blood samples were collected following an overnight fast and abstention from exercise. Serum samples were analyzed using an automated chemistry analyzer. Subjects consumed an oral probiotic supplement for 30-d and the experimental meal challenge was completed at baseline and following the 30-d supplementation period. Probiotic responses were compare to placebo. IL: Interleukin.
Figure 5 Serum IL-6 (A), IL-8 (B), and MCP-1 (C) response to consumption of a commercially available high-fat, high-calorie pizza meal.
Venous blood samples were collected following an overnight fast and abstention from exercise. Serum samples were analyzed using an automated chemistry analyzer. Subjects consumed an oral probiotic supplement for 30-d and the experimental meal challenge was completed at baseline and following the 30-d supplementation period. Probiotic responses were compare to placebo. While effects did not reach statistical significance, trends are consistent with other variables that did significant change (Figures 2 and 3). IL: Interleukin.
- Citation: McFarlin BK, Henning AL, Bowman EM, Gary MA, Carbajal KM. Oral spore-based probiotic supplementation was associated with reduced incidence of post-prandial dietary endotoxin, triglycerides, and disease risk biomarkers. World J Gastrointest Pathophysiol 2017; 8(3): 117-126
- URL: https://www.wjgnet.com/2150-5330/full/v8/i3/117.htm
- DOI: https://dx.doi.org/10.4291/wjgp.v8.i3.117


