Copyright
©2011 Baishideng Publishing Group Co.
World J Gastrointest Pathophysiol. Dec 15, 2011; 2(6): 138-145
Published online Dec 15, 2011. doi: 10.4291/wjgp.v2.i6.138
Published online Dec 15, 2011. doi: 10.4291/wjgp.v2.i6.138
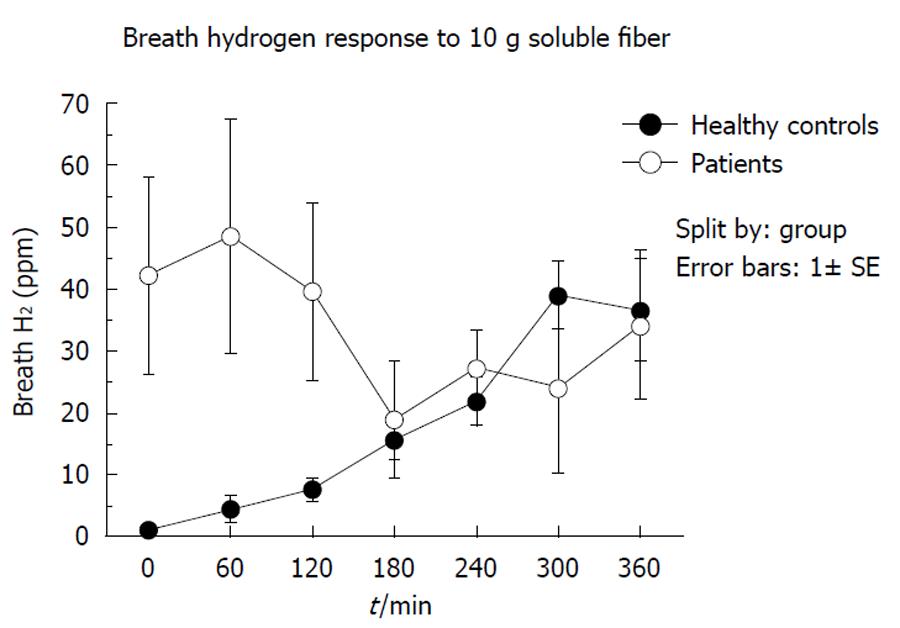
Figure 1 Comparison of breath hydrogen responses over 360 min to a bolus of 10 g soluble fiber between group 1 and healthy subjects.
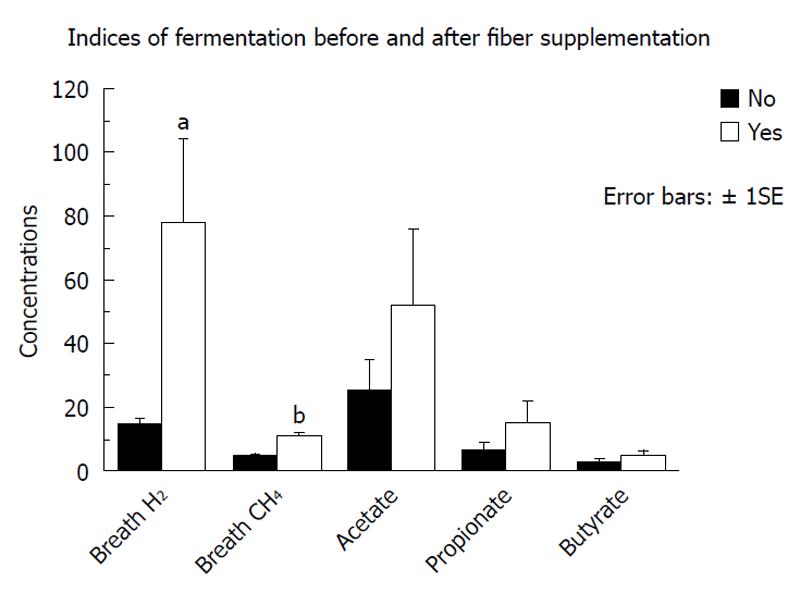
Figure 2 Summary of the changes in some of the indices of bacterial fermentation observed in the first group of 9 tube fed critically ill patients (group 1) after achievement of maximal fiber supplementation (median 22 g/d, range 12-32 g/d).
aP = 0.008, bP < 0.0001, unpaired Student’s t test.
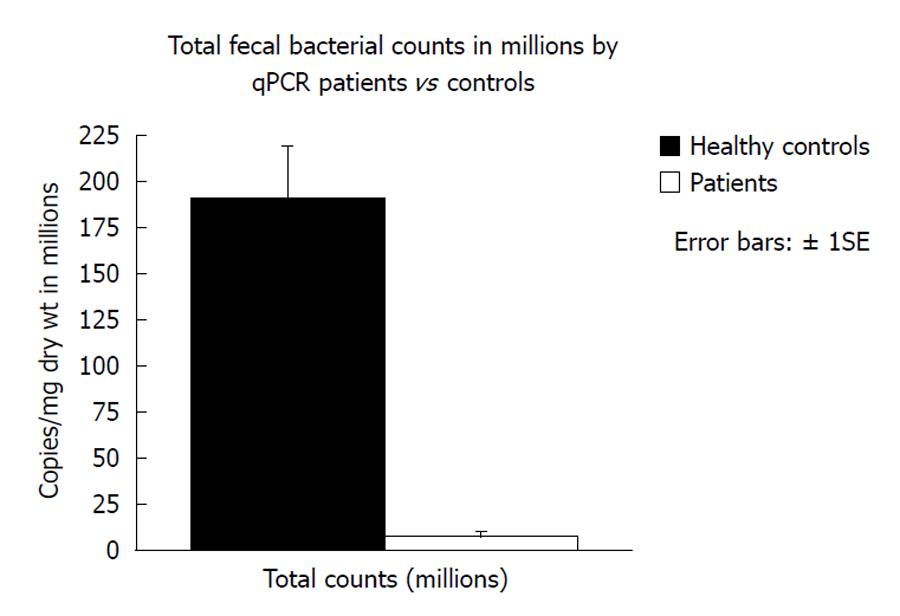
Figure 3 Comparison of total fecal bacterial copies in group 2 compared to healthy subjects consuming normal food measured by quantitative polymerase chain reaction of the 16S ribosomal RNA gene using Bacteria domain primers.
qPCR: Quantitative polymerase chain reaction.
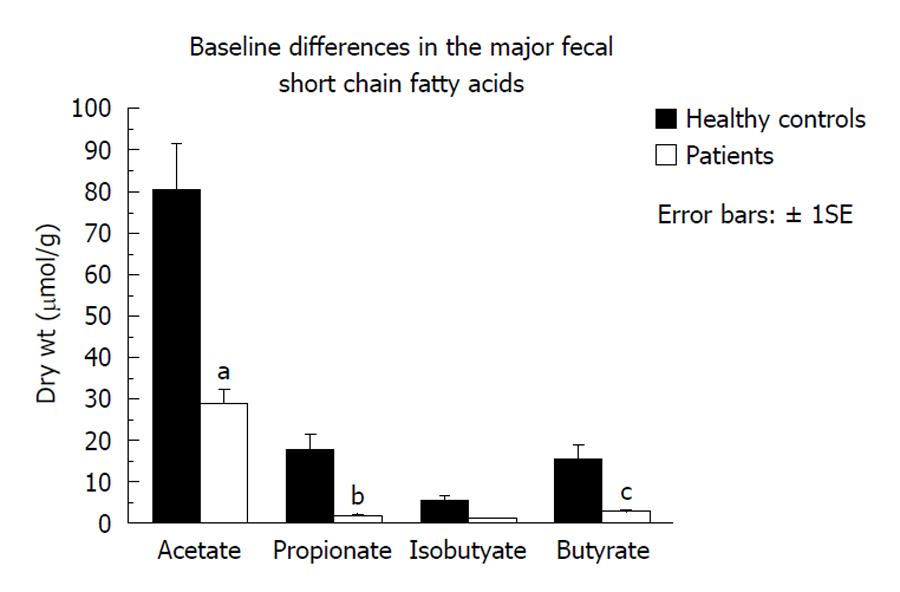
Figure 4 Fecal short chain fatty acid concentrations were significantly lower in the 4 patients in group 2 given fiber supplementation for longer periods of time (2-5 wk) compared to healthy subjects.
aP = 0.012, bP = 0.007, cP = 0.35, unpaired Student’s t test.
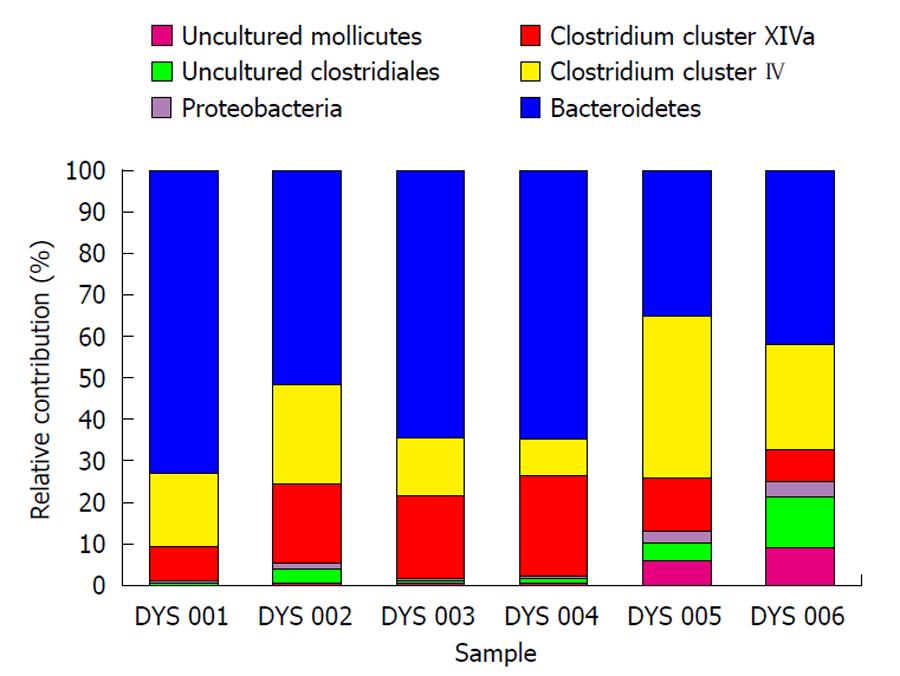
Figure 5 Phylogenetic distribution at level 1 (“Phylum/Class” level) by HITChip analysis.
Lentispaerea is the spike. This illustrates differences in the composition of the major phyla between 2 patients from Group 2 before and after fiber supplementation (DYS 001 and DYS 002 = patient No. 10 before and after fiber supplementation, DYS 003 and DYS 004 = patient No. 11 before and after fiber supplementation) and 2 of the healthy controls consuming normal food (DYS 005 and DYS 006). The difference in Bacteroidetes composition was striking, with this phylum making up 35% of the microbiota in healthy subjects and 60% in patients. Conversely, there was a reduction of the proportion of Firmicutes (Clostridium clusters IV and XIVa), which contain the major butyrate-producers, in patients (50%) compared to controls (30%).
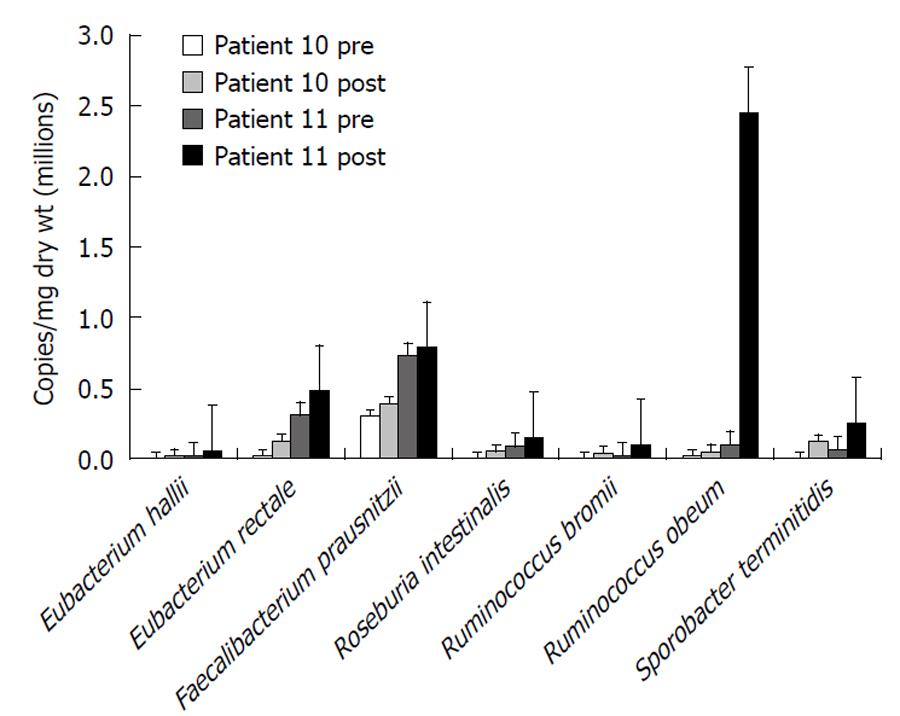
Figure 6 Numbers of butyrate-producing and fiber-digesting bacteria based on HITChip phylogenetic microarray analysis of microbiota composition and 16S quantitative polymerase chain reaction of total fecal bacterial counts in two critically ill patients showing a general increase before and after 2-5 wk of fiber supplementation.
- Citation: O’Keefe SJ, Ou J, DeLany JP, Curry S, Zoetendal E, Gaskins HR, Gunn S. Effect of fiber supplementation on the microbiota in critically ill patients. World J Gastrointest Pathophysiol 2011; 2(6): 138-145
- URL: https://www.wjgnet.com/2150-5330/full/v2/i6/138.htm
- DOI: https://dx.doi.org/10.4291/wjgp.v2.i6.138


