©The Author(s) 2022.
World J Gastrointest Pathophysiol. Mar 22, 2022; 13(2): 41-49
Published online Mar 22, 2022. doi: 10.4291/wjgp.v13.i2.41
Published online Mar 22, 2022. doi: 10.4291/wjgp.v13.i2.41
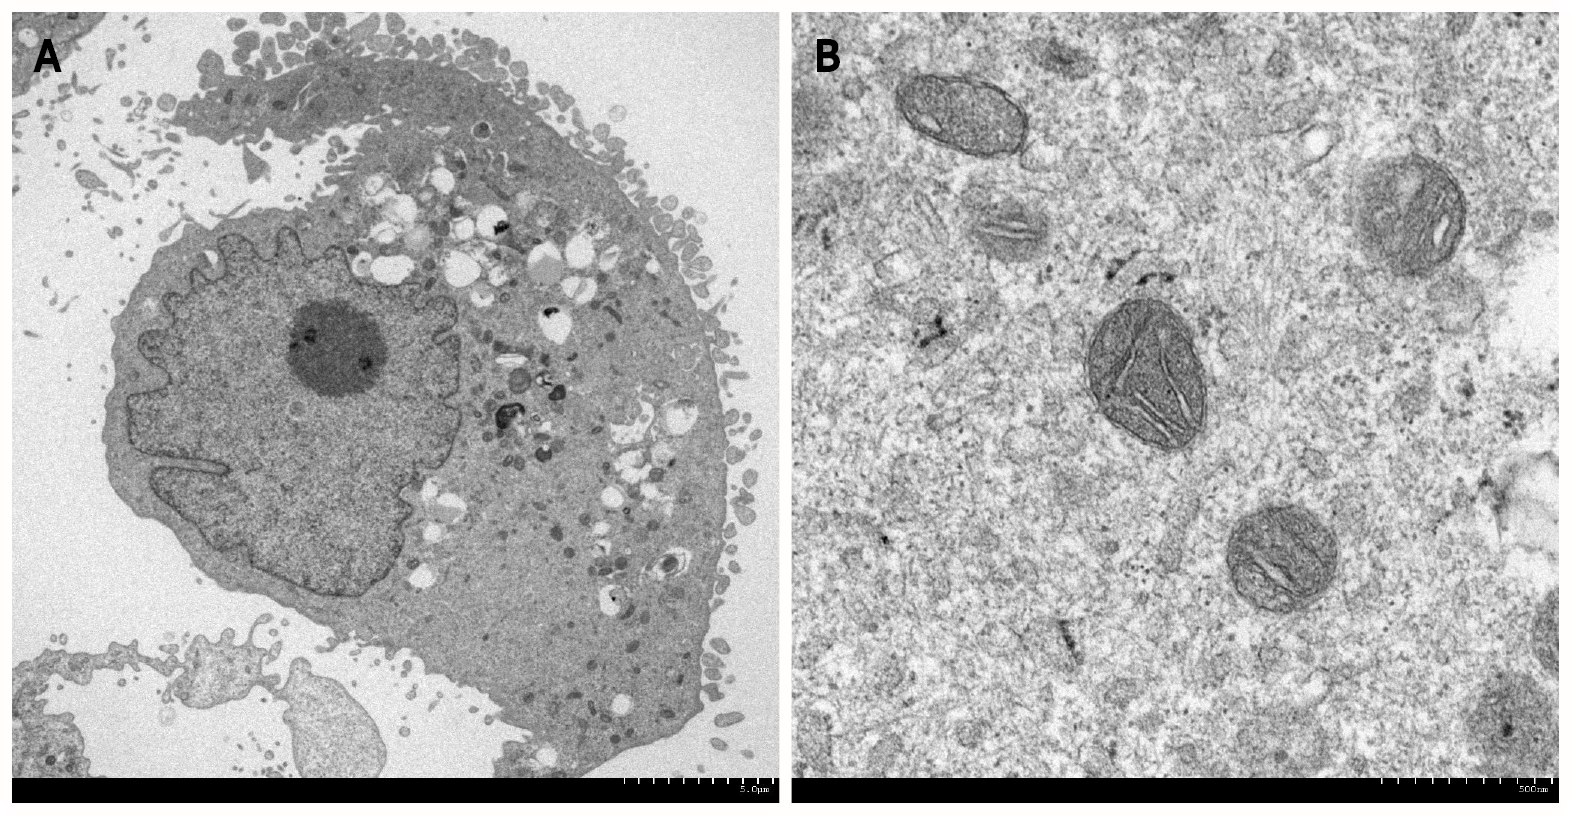
Figure 1 Transmission electron microscopy image.
Transmission electron microscopy of the human cell line derived from gastric cancer (SH-10-TC) showing the morphology of cells and their organelles. A: Scale bars = 5 μm; B: Scale bars = 500 nm.
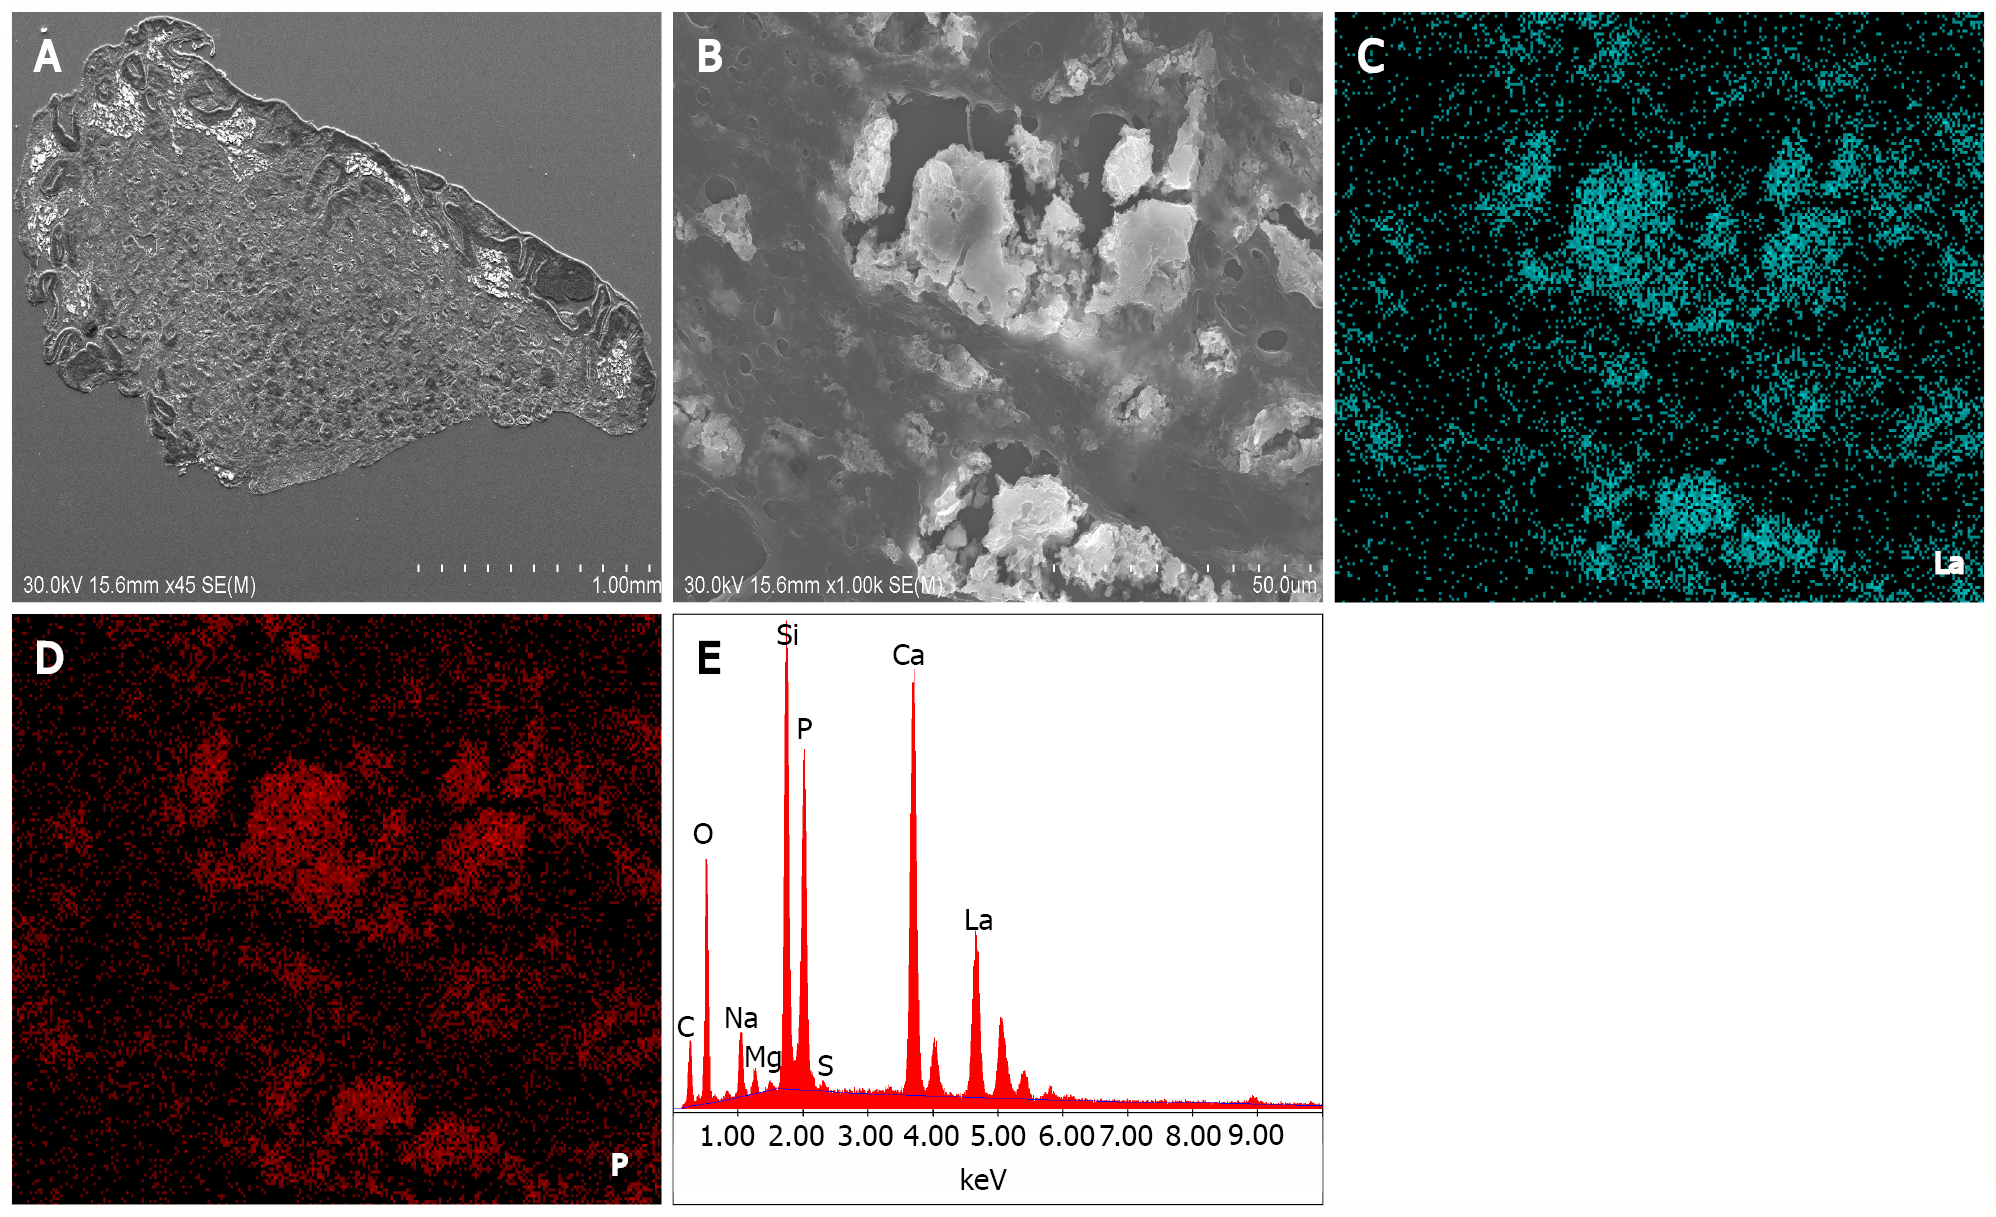
Figure 2 Transmission electron microscopy images and spectra obtained by energy-dispersive X-ray spectrometry.
A: Lanthanum phosphate deposition in the gastric mucosa was diagnosed after analysis by scanning electron microscopy, which visualized deposited lanthanum as bright areas; B: Deposited lanthanum is composed of aggregates of particles; C and D: Elemental mapping showing the colocation of lanthanum (C) and phosphate (D); E: Energy-dispersive X-ray spectrometry.
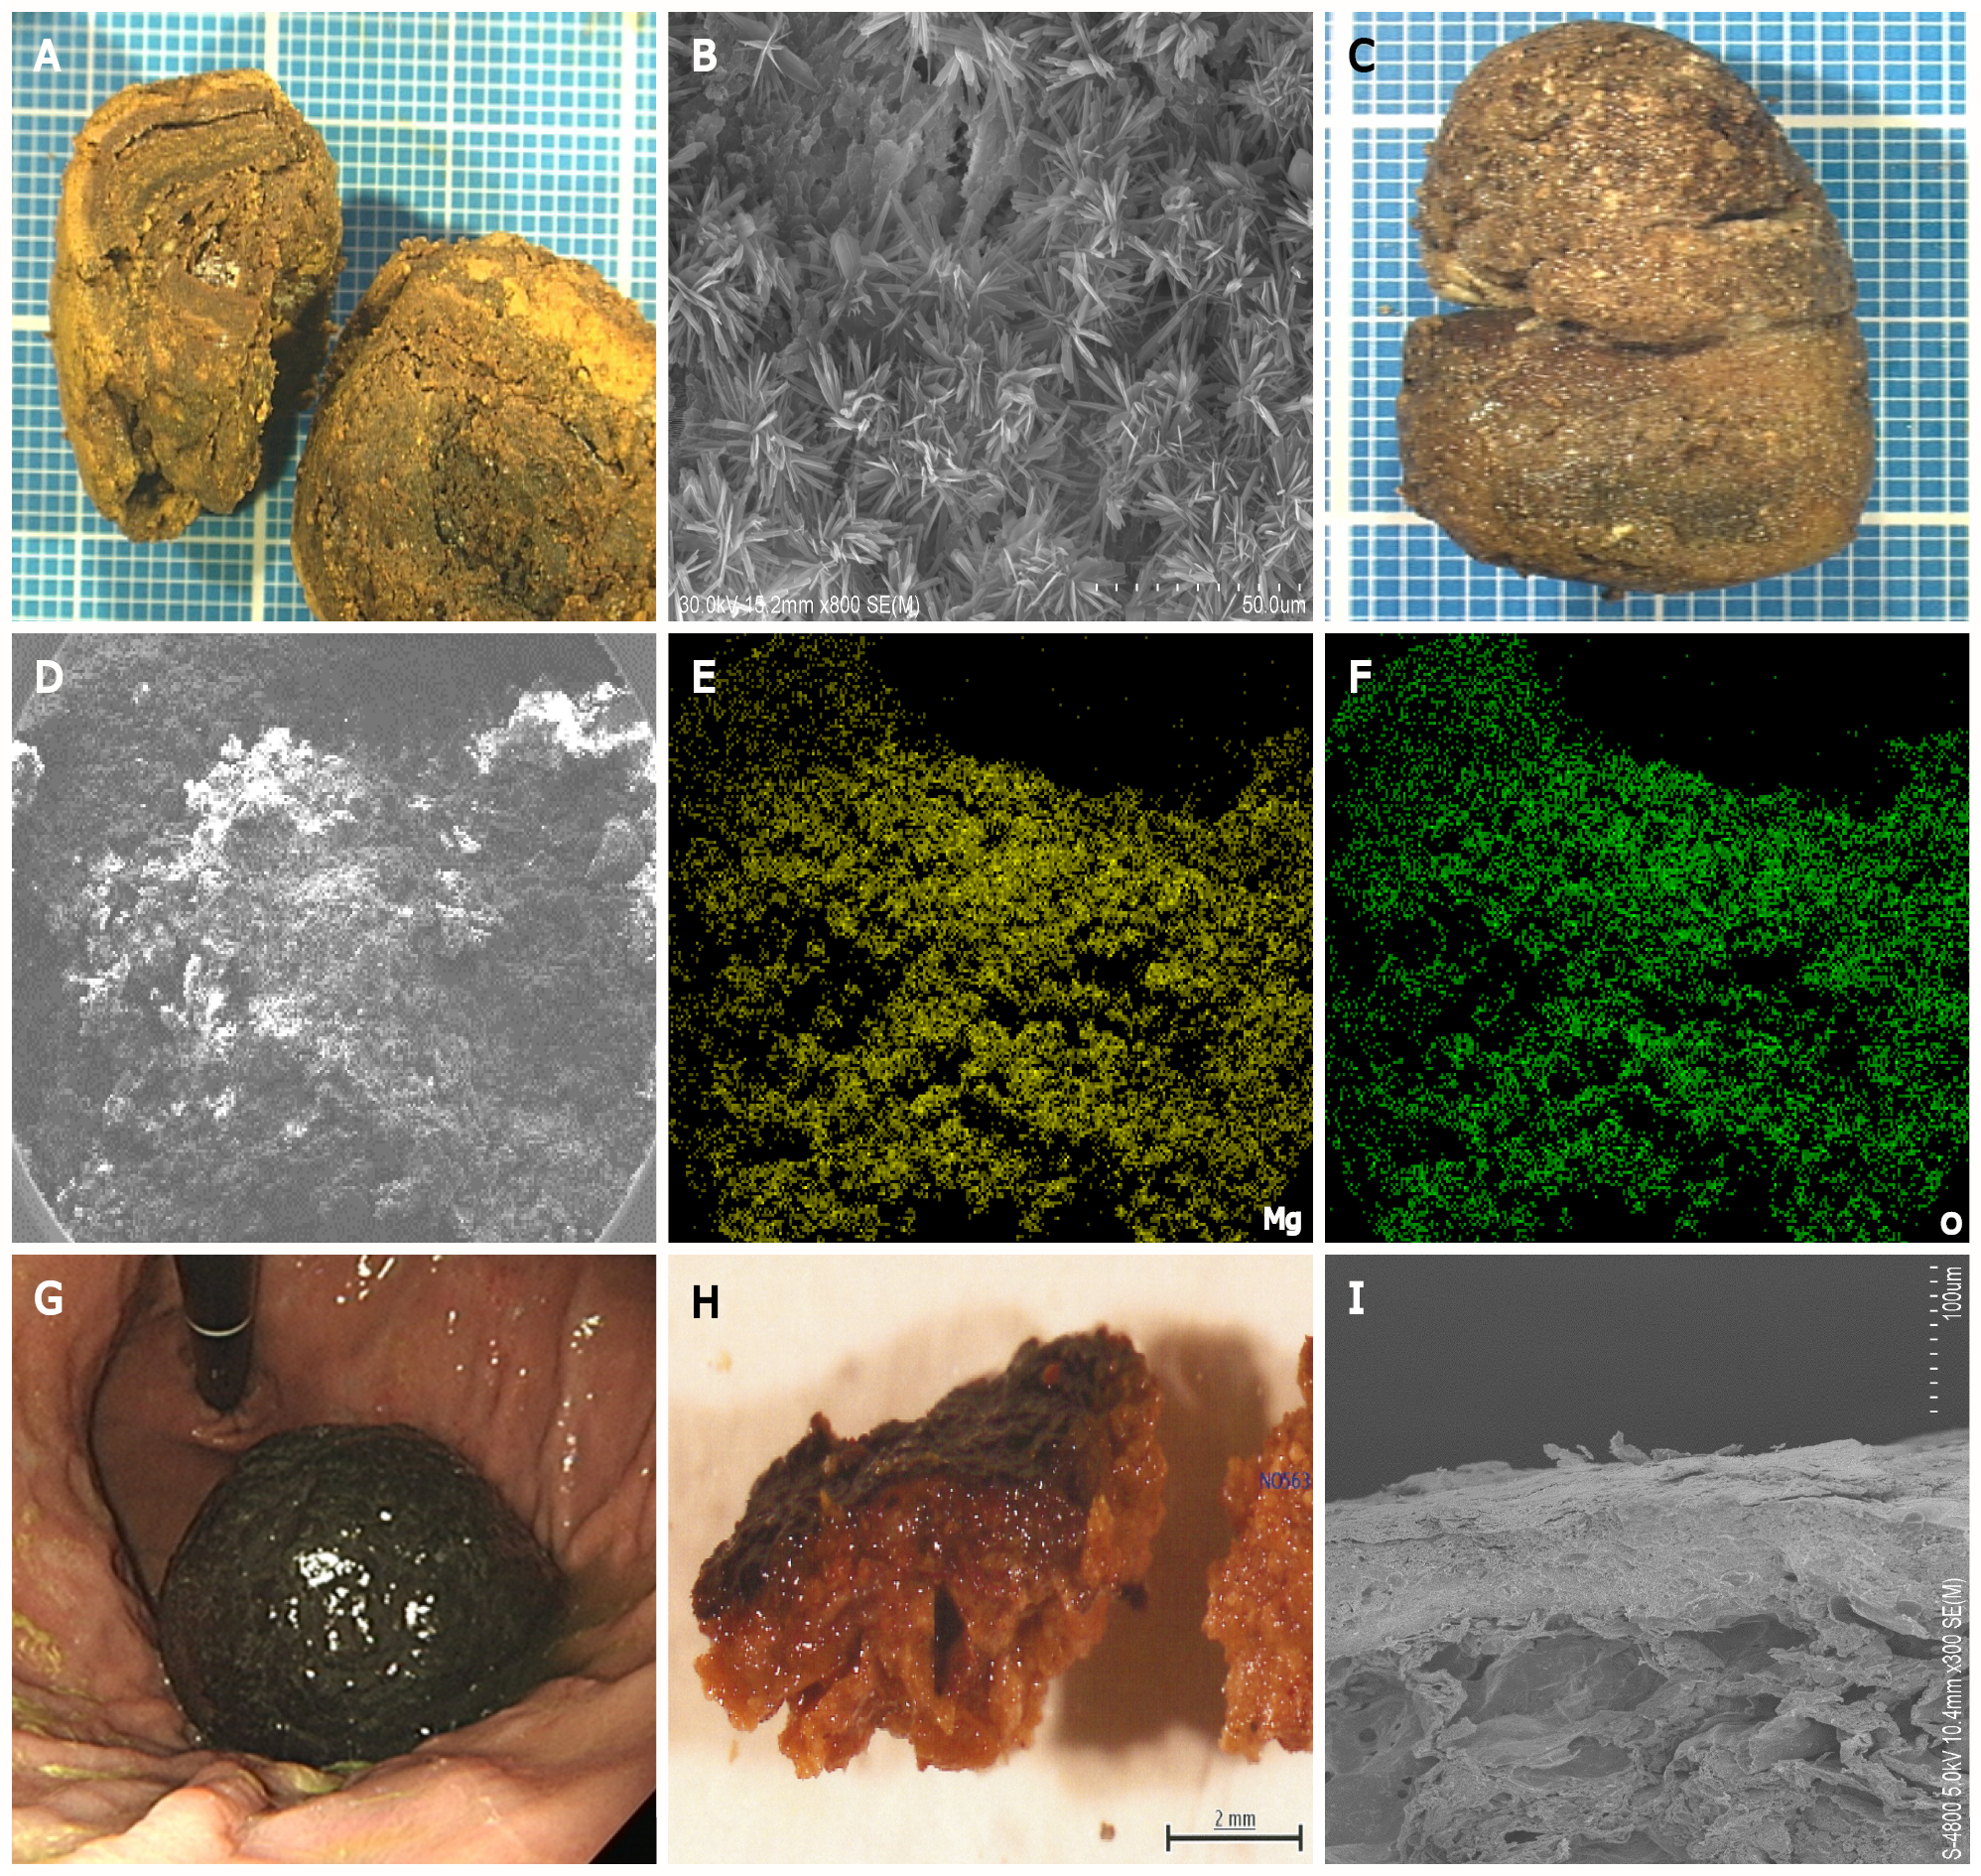
Figure 3 Images of enteroliths.
A and B: An enterolith found in the stomach showing a laminar structure on the cut surface (A). Scanning electron microscopy demonstrating acicular crystals (B), suggesting epitaxial growth of the enterolith; C: Another patient had a pharmacobezoar composed of magnesium oxide in the stomach; D-F: Scanning electron microscopy showed a granular substance (D) and a diffuse distribution of magnesium (E) and oxide (F); G: A persimmon phytobezoar was observed in the stomach; H: The cut section shows that the color of the bezoar surface is black, and the interior is yellowish; I: On scanning electron microscopy, a high-density, continuous layer forming the exterior of the phytobezoar is evident on the cut surface, while sheet-like structures of curved or wiggly shapes constitute the inner part.
- Citation: Iwamuro M, Urata H, Tanaka T, Okada H. Application of electron microscopy in gastroenterology. World J Gastrointest Pathophysiol 2022; 13(2): 41-49
- URL: https://www.wjgnet.com/2150-5330/full/v13/i2/41.htm
- DOI: https://dx.doi.org/10.4291/wjgp.v13.i2.41


