Copyright
©The Author(s) 2019.
World J Gastrointest Pathophysiol. Nov 13, 2019; 10(4): 42-53
Published online Nov 13, 2019. doi: 10.4291/wjgp.v10.i4.42
Published online Nov 13, 2019. doi: 10.4291/wjgp.v10.i4.42
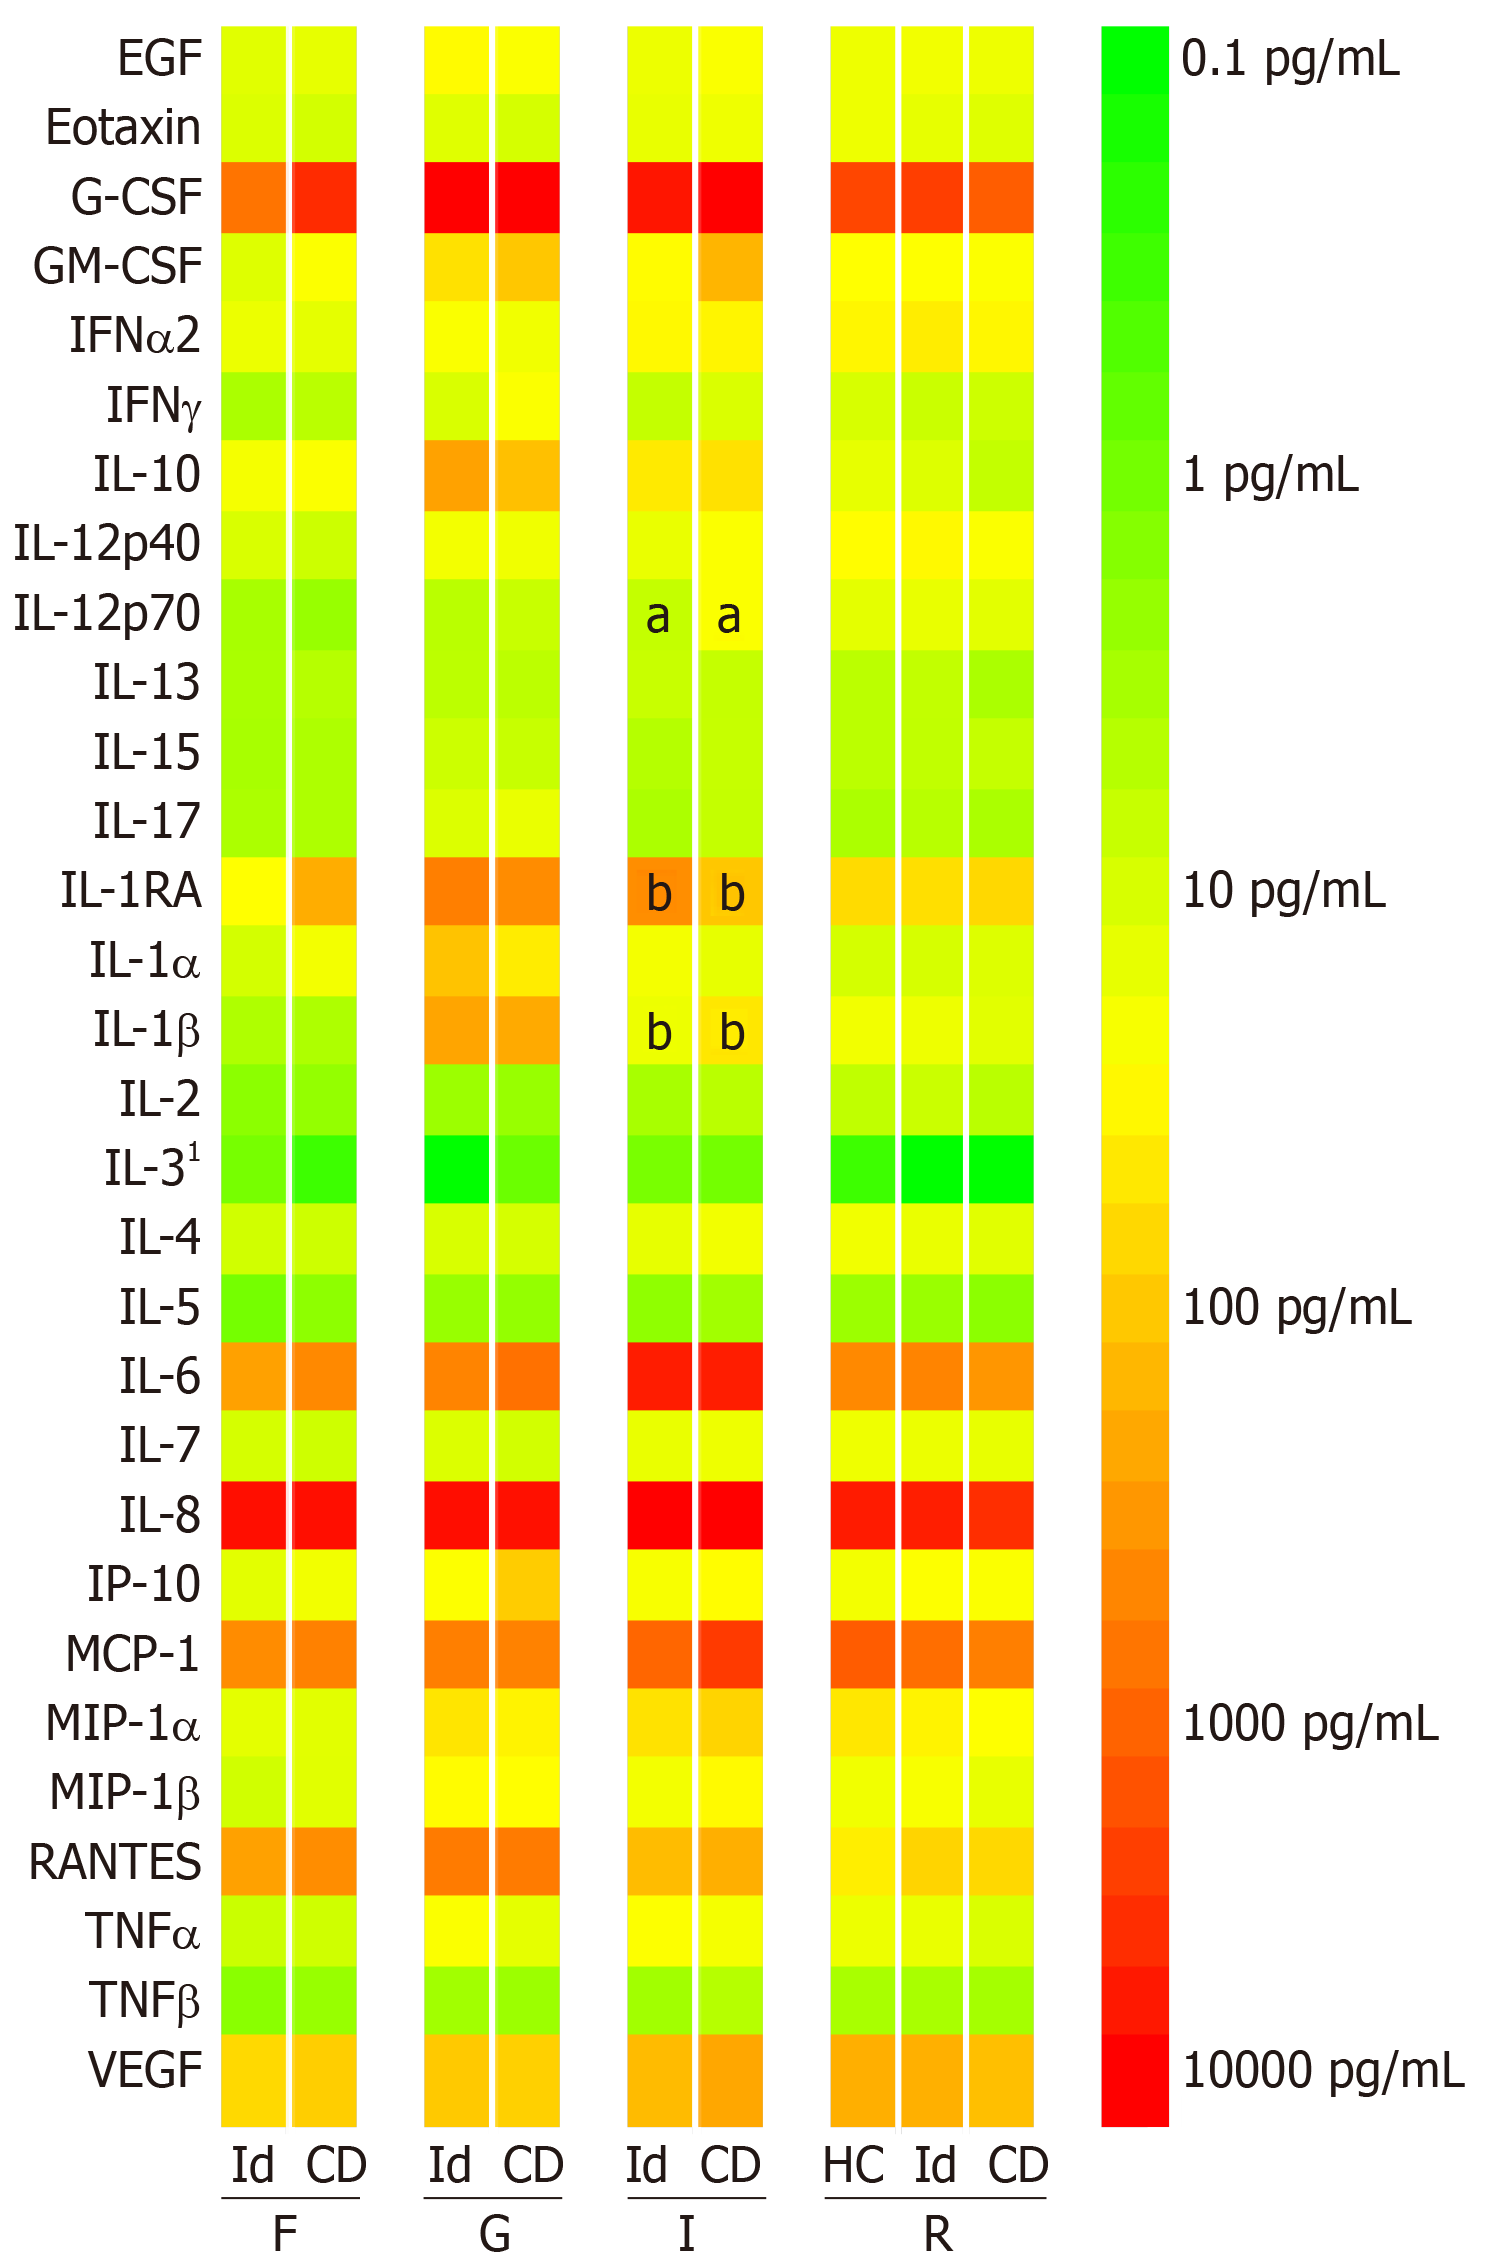
Figure 1 Median cytokine concentrations (log-10 scale) in the supernatants from 24-h fresh tissue cultures using a 30-plex Milliplex MAP Human Cytokine/Chemokine Magnetic Bead Panel (EMD Millipore, Billerica, MA, United States) and a MAGPIX multiplexing instrument (Luminex Corporation, Austin, TX, United States).
The median IL-12p70 concentration at the internal opening was higher in the Crohn’s disease group (a). The median difference was 19.7 pg/mL (Hodges-Lehman, 99%CI: 0.2-40.4; Mann-Whitney U, P = 0.008). The IL-1RA/IL-1β concentration ratio was significantly lower in the Crohn’s disease group at the internal opening (b). The median difference was 15.0 (99%CI: 0.4-50.5, P = 0.008). There were no other statistically significant differences between the groups in the remaining 27 cytokines at the four biopsy sites. 1Results should be interpreted cautiously as they were below the minimum detectable concentration for the assay. Id: Idiopathic; CD: Crohn’s disease; HC: Healthy controls; F: Fistula tract; G: granulation tissue; I: Internal opening; R: Rectal mucosa.
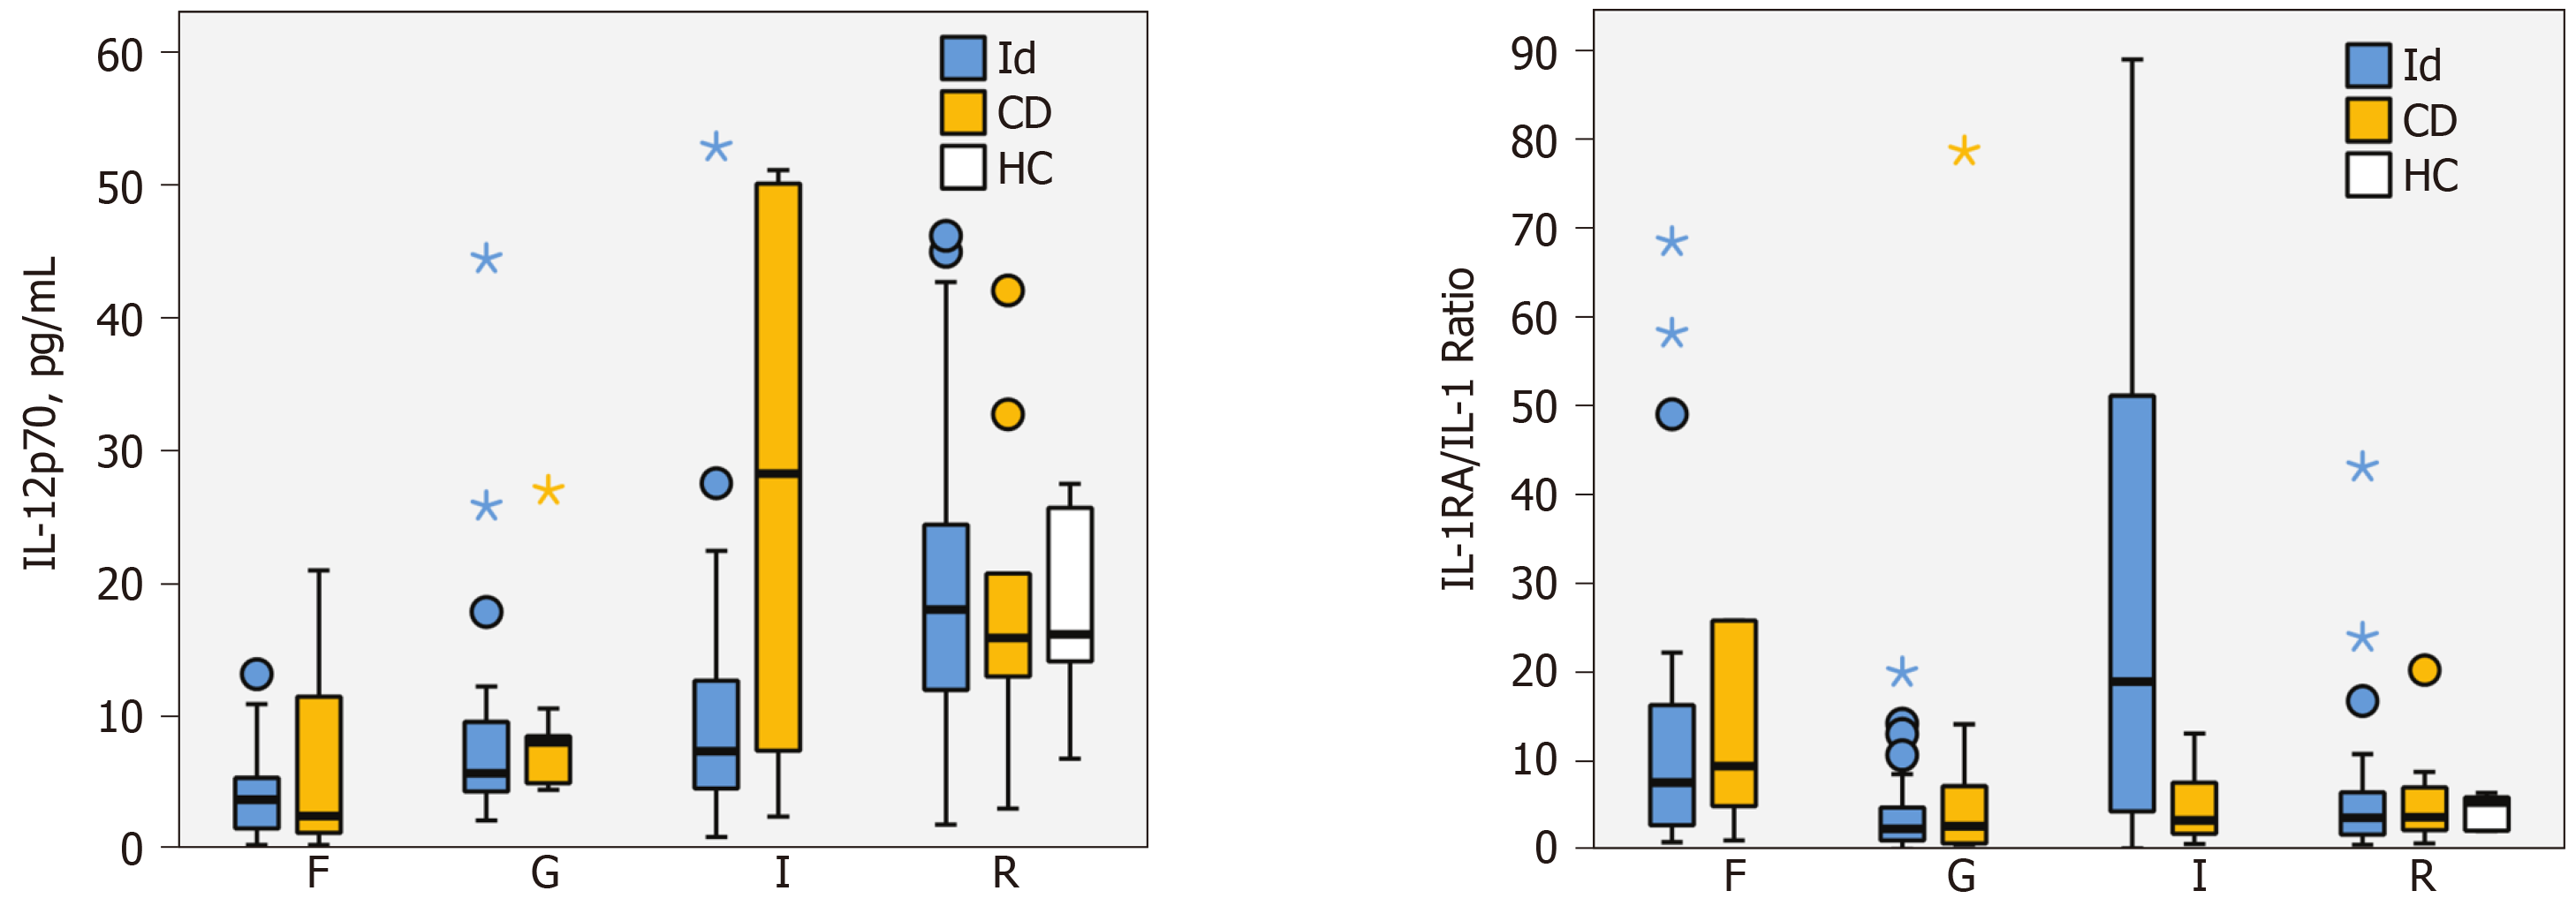
Figure 2 Boxplots for IL-12p70 concentration (left) and IL-1RA/IL-1β concentration ratios (right) in the supernatants from 24-h fresh tissue cultures using a 30-plex Milliplex MAP Human Cytokine/Chemokine Magnetic Bead Panel (EMD Millipore, Billerica, MA, United States) and a MAGPIX multiplexing instrument (Luminex Corporation, Austin, TX, United States).
At the internal opening, differences between the idiopathic and Crohn’s disease groups were statistically significant. Median difference in IL-12p70 concentration at the internal opening was 19.7 pg/mL (Hodges-Lehman, 99%CI: 0.2-40.4; Mann-Whitney U, P = 0.008). The median difference in IL-1RA/IL-1β at the internal opening was 15.0 (Hodges-Lehman, 99%CI: 0.4-50.5; Mann-Whitney U, P = 0.008). Circle marker, outlier within 1.5 × interquartile range (IQR); Star marker, outlier out with 1.5 × IQR. One outlier not shown to limit Y-axis scale.
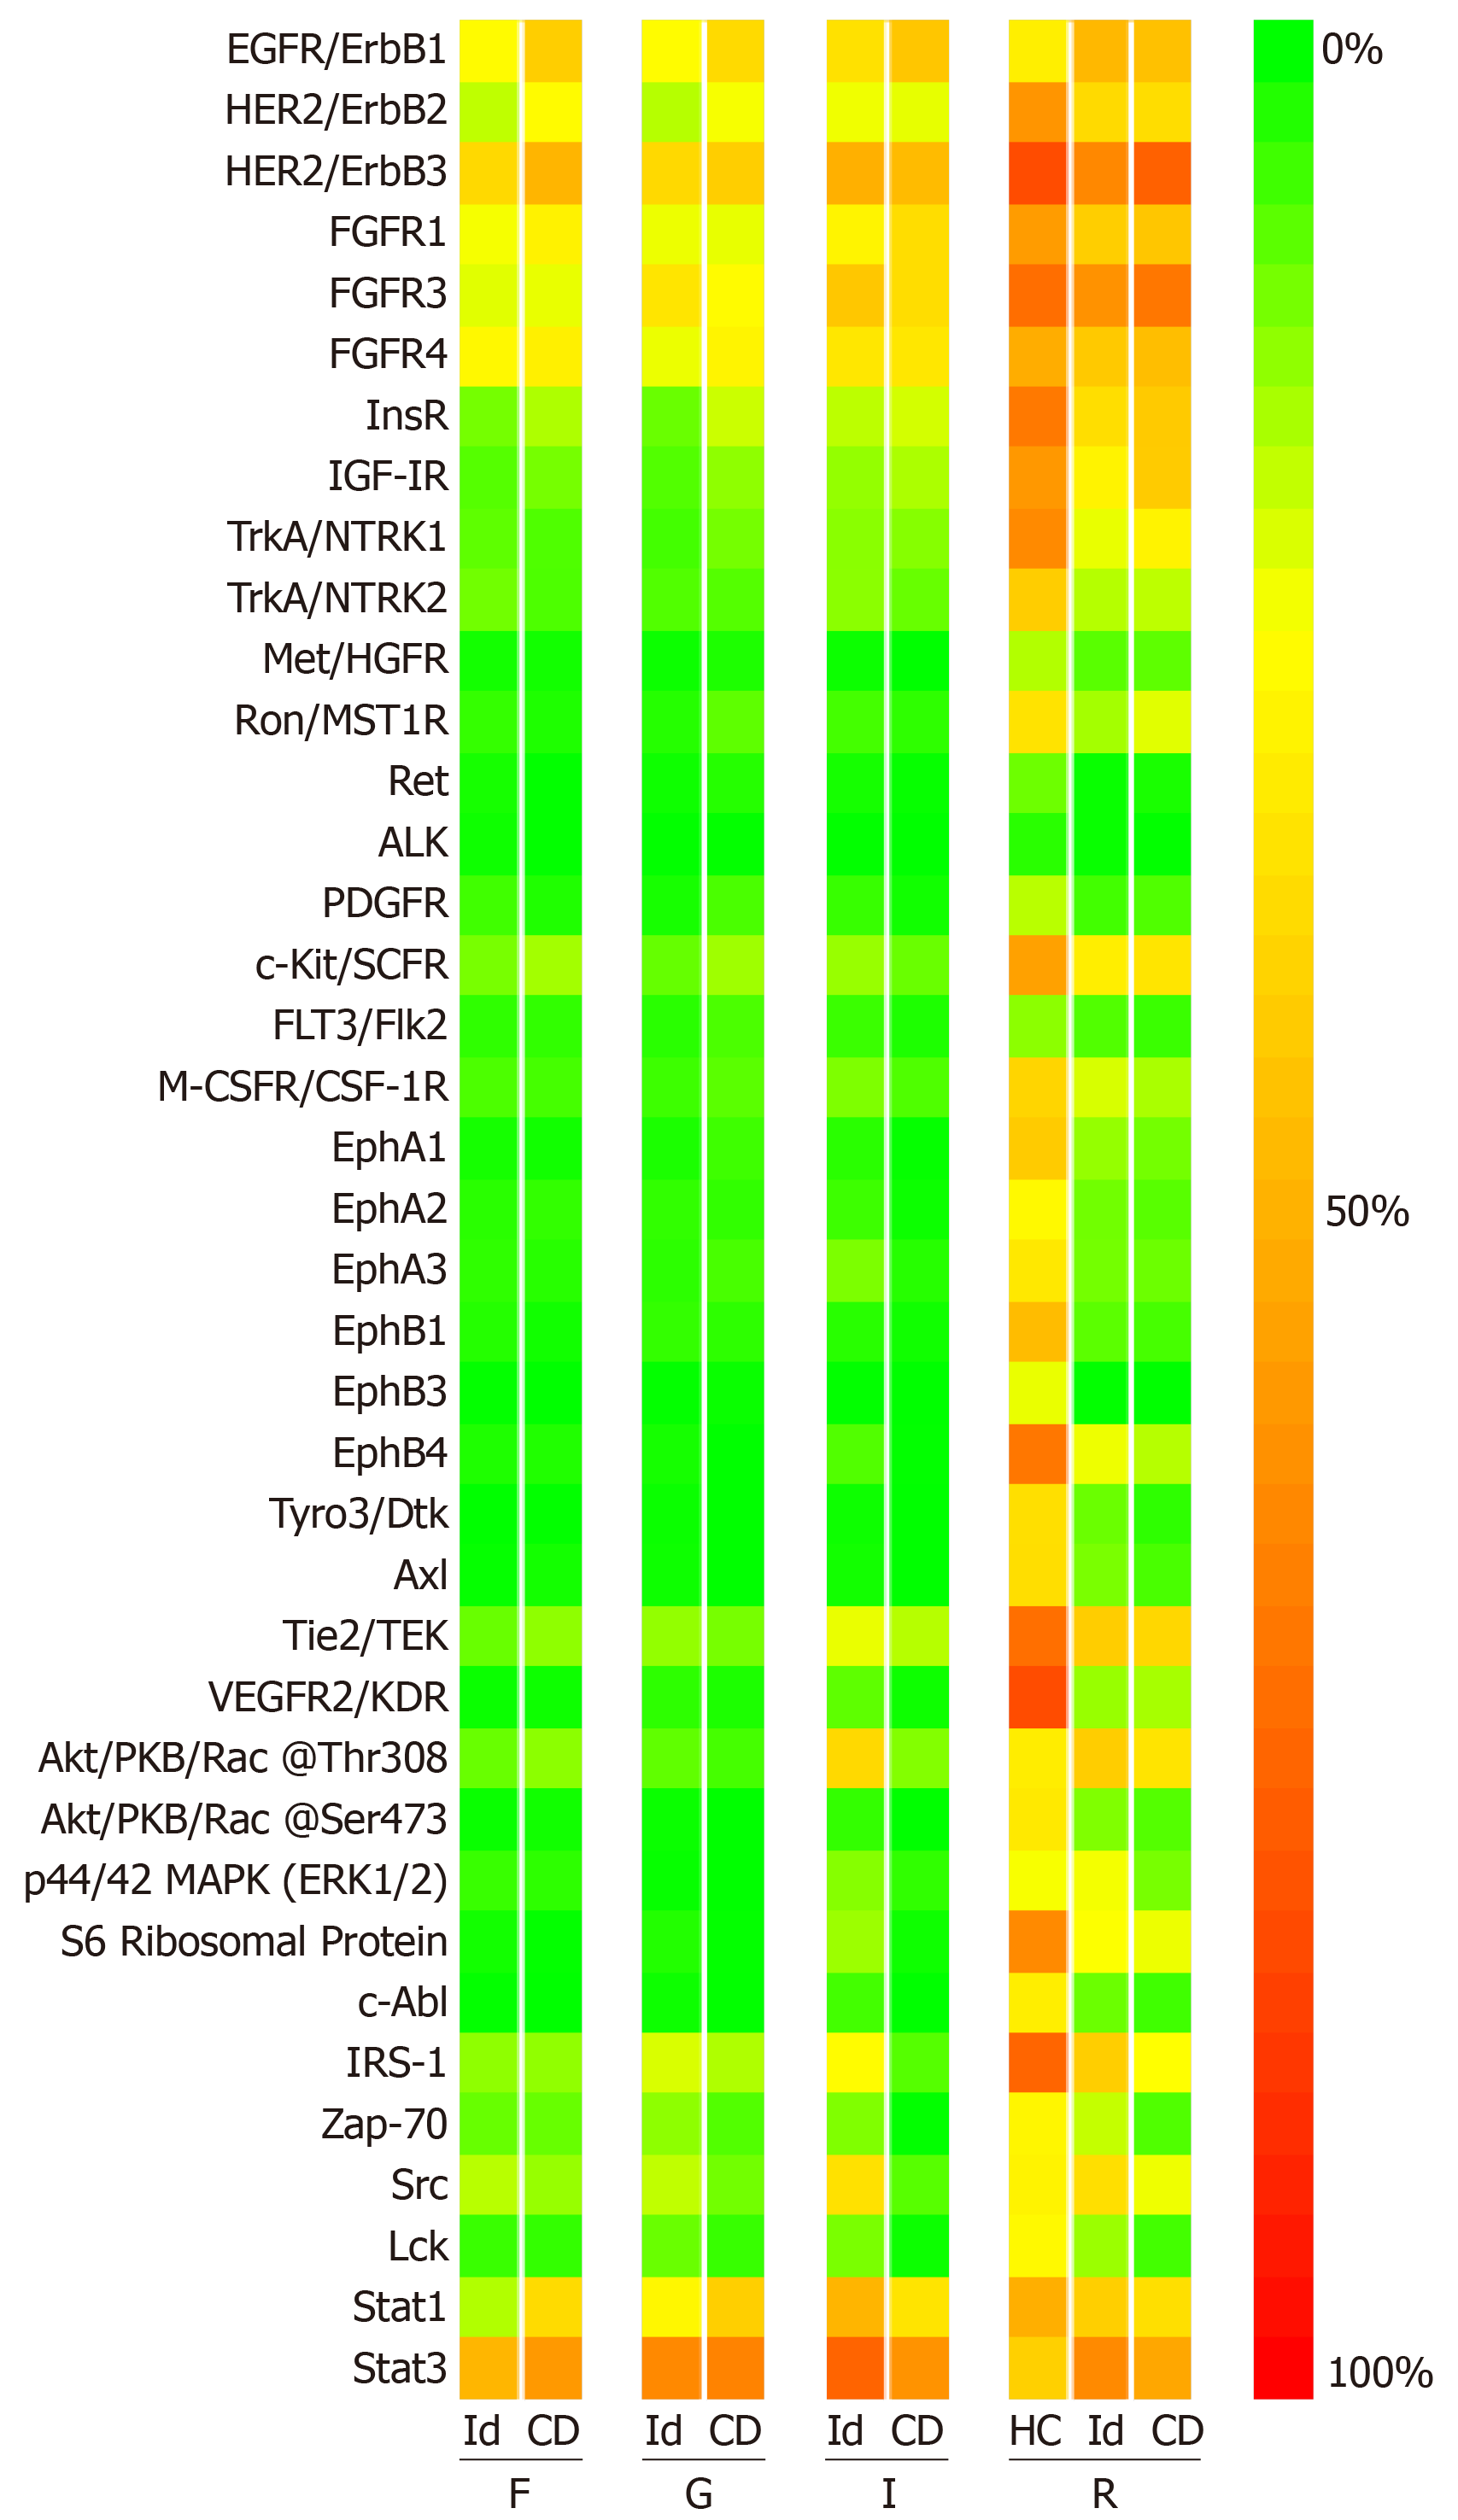
Figure 3 Median signal intensities (%) quantifying the phosphorylation status of receptor tyrosine kinases in the cell lysates of the fresh tissue samples using the PathScan RTK Signaling Antibody Array, Chemiluminescent Readout (Cell Signaling Technology, Danvers, Massachusetts).
The signal intensities were similar in the idiopathic and Crohn’s disease groups at the four specimen sites. When the Crohn’s disease group was compared to healthy controls, a statistically significant difference (Mann Witney U, P < 0.01) was seen for EphA1, EphB1, EphB4, Tyro3 and VEGFR2. Id: Idiopathic; CD: Crohn’s disease; HC: Healthy controls; F: Fistula tract; G: Granulation tissue; I: Internal opening; R: Rectal mucosa.
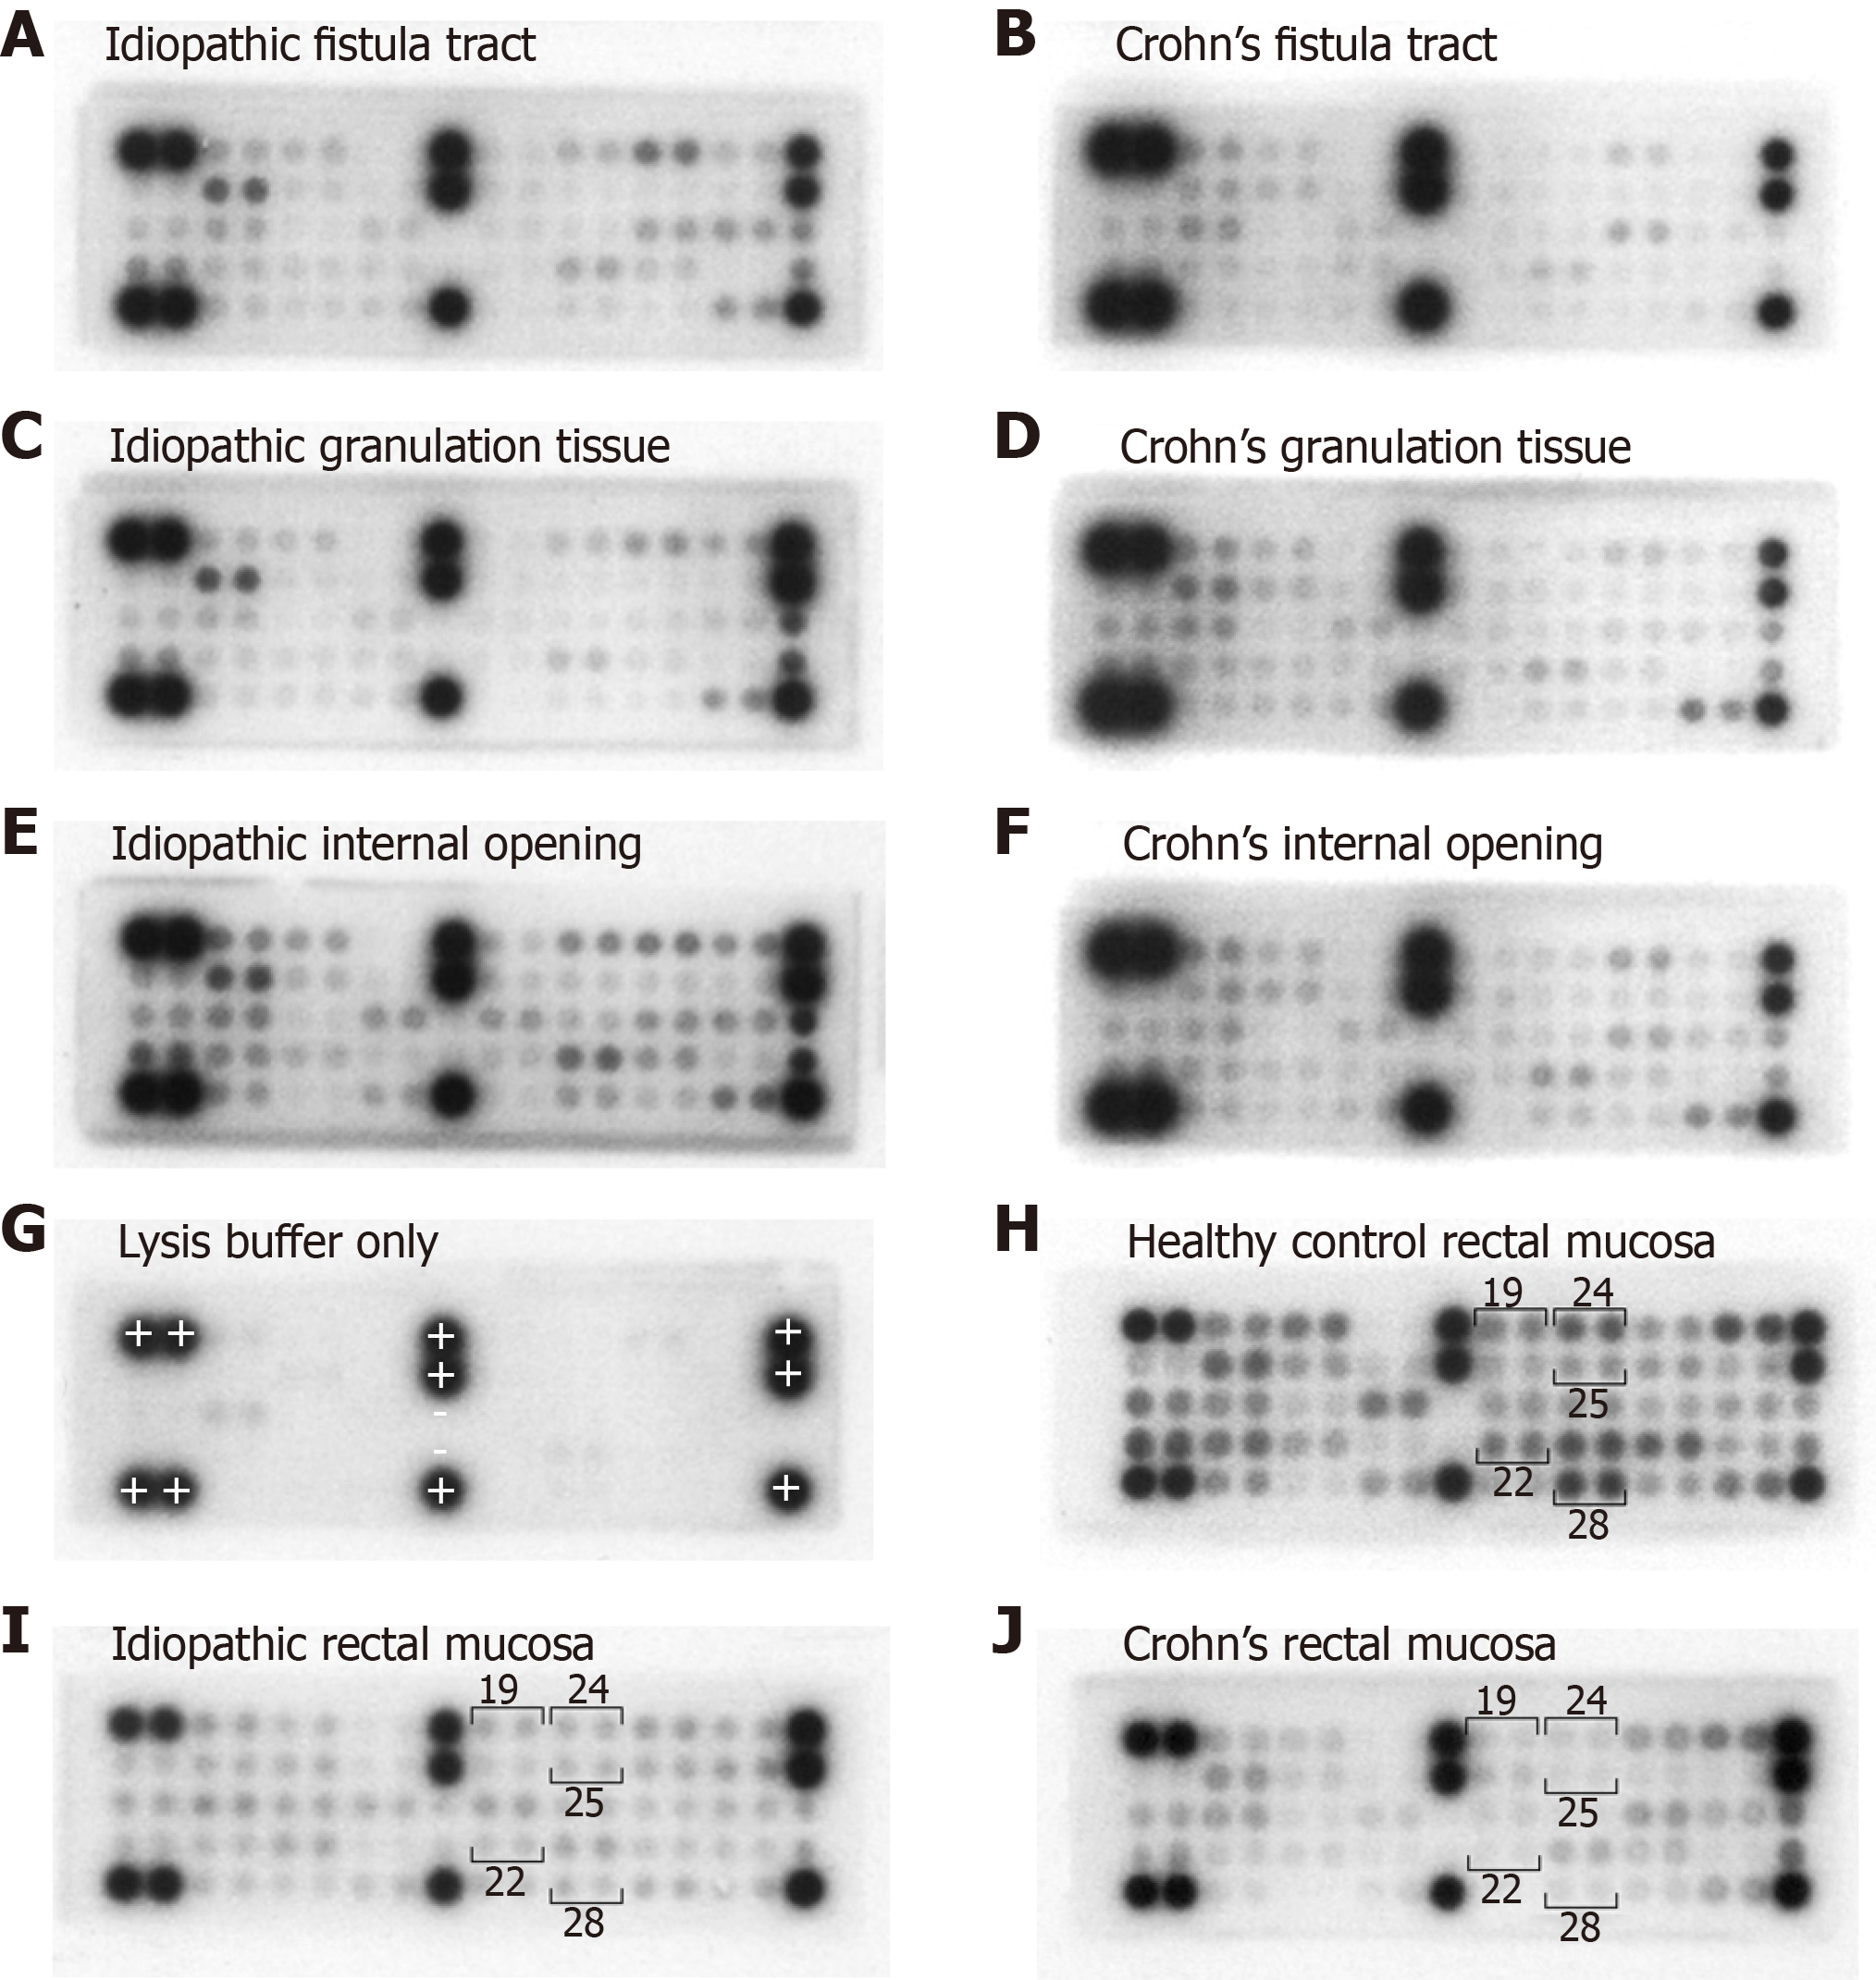
Figure 4 Example microarray images acquired to quantify the phosphorylation status of receptor tyrosine kinases in the cell lysates of the fresh tissue samples using the PathScan RTK Signaling Antibody Array, Chemiluminescent Readout (Cell Signaling Technology, Danvers, Massachusetts).
Fistula tract samples from (A) idiopathic and (B) Crohn’s disease patients. Granulation tissue samples from (C) idiopathic and (D) Crohn’s disease patients. Internal opening samples from (E) idiopathic and (F) Crohn’s disease patients. Control array containing lysis buffer only (G), showing an absent signal from all test spots and the negative control spots (-), and 100% signal from the positive control spots (+). Healthy control rectal mucosa (H) showing positive signal from numerous spots including EphA1 (19), EphB1 (22), EphB4 (24), Tyro3/Dtk (25) and VEGFR (28). Idiopathic rectal mucosa (I) showing significantly lower signal from the same highlighted spots. Crohnâs disease rectal mucosa (J), again showing significantly lower signal from the same highlighted spots.
- Citation: Haddow JB, Musbahi O, MacDonald TT, Knowles CH. Comparison of cytokine and phosphoprotein profiles in idiopathic and Crohn’s disease-related perianal fistula. World J Gastrointest Pathophysiol 2019; 10(4): 42-53
- URL: https://www.wjgnet.com/2150-5330/full/v10/i4/42.htm
- DOI: https://dx.doi.org/10.4291/wjgp.v10.i4.42


