Peer-review started: August 7, 2018
First decision: October 16, 2018
Revised: November 14, 2018
Accepted: January 9, 2019
Article in press: January 10, 2019
Published online: January 28, 2019
Processing time: 175 Days and 14.4 Hours
Proton magnetic resonance spectroscopy (1H MRS) is a technique widely used for investigating metabolites in humans. Lipids are stored outside the muscle cell are called extramyocellular lipids (EMCL), and lipids stored on the inside of muscle cells are called intramyocellular lipids (IMCL). The relationship between metabolic syndrome and IMCL has been extensively studied.
To determine the effects of muscle fiber orientations on muscle metabolites using 1H MRS.
Chicken muscles were used as the subject in this study. MRS spectra were performed on a 1.5T Magnetic resonance imaging machine (1.5 Tesla Philips Achieva). A single voxel (8 mm × 8 mm × 20 mm) was placed on the chicken extensor iliotibialis lateralis muscle with the muscle fiber oriented at 0°, 30°, 60°, and 90° to the main magnetic field. 1H MRS spectra were acquired using a point-resolved spectroscopy, TR = 2000 ms, TE = 30 ms, and NSA = 256. Metabolites of interest from each orientation to the main magnetic field were compared using Wilcoxon signed-rank test. Differences less than 0.05 were considered to be statistically significant with 95%CI.
The metabolite profiles were different for each orientation of muscle fibers to the main magnetic field. The orientation at 90° was the most different compared to other orientations. The quantity of IMCL and EMCL exhibited statistically significantly changes with impacts at 30°, 60°, and 90° when compared with muscles aligned at 0° to the main magnetic field. Statistical analysis showed statistically significant IMCL (CH3), EMCL (CH3), and IMCL (CH2) at 30°, 60°, and 90° (P = 0.017, 0.018, and 0.018, respectively) and EMCL (CH2) at 30° and 60° (P = 0.017 and 0.042, respectively). EMCL (CH2) at 90° was unable to be measured in this study. The muscle lipids quantified at 30°, 60°, and 90° tended to be lower when compared to 0°.
Careful positioning is one of the most important factors to consider when studying 1H MRS metabolites in muscles to ensure reproducibility and uniformity of muscle metabolite spectra.
Core tip: Proton magnetic resonance spectroscopy (1H MRS) is a technique that is widely used for intramyocellular lipids and extramyocellular lipids quantification in muscles, as evidenced in various studies. However, different muscle positions can potentially lead to inconsistency in metabolite quantification and can also impede interpretation of data, which can lead to misinformation. This study reveals that the muscle orientation at 0°, 30°, 60°, and 90° to the main magnetic field significantly affects the metabolite profile and quantification. The metabolite profile changes due to the muscle fiber orientation demonstrate that the positioning potentially causes inaccuracy in 1H-MRS spectrum analysis.
- Citation: Pasanta D, Kongseha T, Kothan S. Effects of muscle fiber orientation to main magnetic field on muscle metabolite profiles for magnetic resonance spectroscopy acquisition. World J Radiol 2019; 11(1): 1-9
- URL: https://www.wjgnet.com/1949-8470/full/v11/i1/1.htm
- DOI: https://dx.doi.org/10.4329/wjr.v11.i1.1
Proton magnetic resonance spectroscopy (1H MRS) is a technique widely used for investigating metabolites in humans. With insulin resistance, the body stores more lipids in various compartments of organs that normally do not contain fat, such as the liver and muscles. The lipids stored outside muscle cells are called extramyocellular lipids (EMCL), and lipids stored inside muscle cells are called intramyocellular lipids (IMCL). Various studies have shown that IMCL levels are inversely associated with type II diabetes. It is also thought that this relationship is the cause of skeleton muscle insulin resistance and may be an early sign of defective glucose uptake[1,2]. The relationship between metabolic syndrome and IMCL has been studied extensively. Unlike muscle biopsy, 1H MRS is a noninvasive technique suitable for studies that require constant follow-ups and has been popular for use in metabolomics research. Ectopic fat accumulation among various organs, specifically IMCL, is being investigated to gain a better understanding of the pathological mechanisms[3]. The 1H MRS in muscle is usually performed in lower extremity muscles, such as the tibialis anterior, soleus, and gastrocnemius, due to their accessibility for MRI positioning. Nevertheless, much research demonstrates that muscle 1H MRS is influenced by the positioning of the organ of interest[4-6]. It has also been discovered that the orientation of muscle with respect to the direction of the main magnetic field (B0) affects residual dipolar coupling and bulk magnetic susceptibility on spectra profiles, leading to inconsistencies of metabolite quantification. Hence, it can impede the interpretation and therefore lead to misinformation[7]. Muscle fiber orientation can be determined from dipolar coupling; however, this is an indirect method for measuring muscle fiber orientation[8].
Currently, there are no studies that directly measure muscle alignment to B0 or how the muscle fibers are aligned to B0 as it is impossible to measure the exact angle of muscle to B0 in humans.
The purpose of this study is to determine the effects the muscle fiber angle to B0 has on the spectrum profile and to obtain muscle lipid quantification without the effect of muscle contraction. This study used extensor iliotibialis lateralis muscles from chicken thighs as the muscle of interest. Because it is an upper muscle, it is able to give a clear visualization of the muscle fiber alignment to B0.
Chicken extensor iliotibialis lateralis muscle was used in this study. A chicken thigh was purchased at local store and was properly skinned, carefully avoiding any muscle tissue. Next, the chicken thigh was placed into a sterile package and stored at 4ºC until the time of study.
Magnetic resonance imaging with a 1.5 Tesla Philips Achieva (Philips Medical Systems, Best, the Netherlands) equipped with a knee coil was used for the 1H MRS spectrum acquisition. The chicken extensor iliotibialis lateralis muscle fiber alignment was used as the reference point and placed in the middle of the coil, positioned at 0˚, 30˚, 60˚, and 90˚ to B0. T2-weighted turbo spin echo images in coronal plane and axial plane of muscle were first acquired for voxel localization. Single-voxel point resolved spectroscopy pulse sequence was used for spectrum acquisition with TR = 2000 ms, TE = 30 ms, and NSA = 256 when equipped with automatic shimming. A voxel of size 8 × 8 × 20 mm3 was carefully placed on the iliotibialis lateralis muscle, carefully avoiding any other muscle fasciae, bulk fat, and air, with verification being obtained from MRI images. Spectra acquisition was repeated 7 times at each angle. All of the spectra in this study were acquired within two hours.
JMRUI version 6.0 β was used for metabolite peak assignment and analysis[9-11]. Spectrum fitting was done by the AMARES algorithm[12] with prior knowledge for line width, and chemical shifts of each peak were obtained from previous studies[13]. Residual water tail was used as the chemical shift reference at 4.72 ppm and then was suppressed with an HLSVD filtering algorithm[14]. The spectrum line shape was estimated with Lorentzian. The zero order phases were estimated by AMARES, and first order phase was fixed at zero with data being truncated by two points for baseline correction. The fitted spectrum showed various peaks of metabolites of interest in the following manner: IMCL (CH3) at 0.9 ppm, EMCL (CH3) at 1.1 ppm, IMCL (CH2) at 1.3 ppm, EMCL (CH2) at 1.5 ppm, and creatine (Cr) at 3.02 ppm. IMCL and EMCL amplitudes fitted by AMARES were calculated into the ratio per signal intensity of Cr as the internal reference.
The data analysis was performed using Origin 8.0 software (OriginLab, Northampton, MA, United States). The calculated results of spectrum fitting at 0°, 30°, 60°, and 90° of muscle fiber orientation to B0 were compared using Wilcoxon signed-rank test. Statistically significant differences were those less than 0.05, and there was a 95% level of confidence based on this testing. Any metabolite that was undetectable or any measurement that yielded unreliable results by JMRUI was excluded from the statistical analysis.
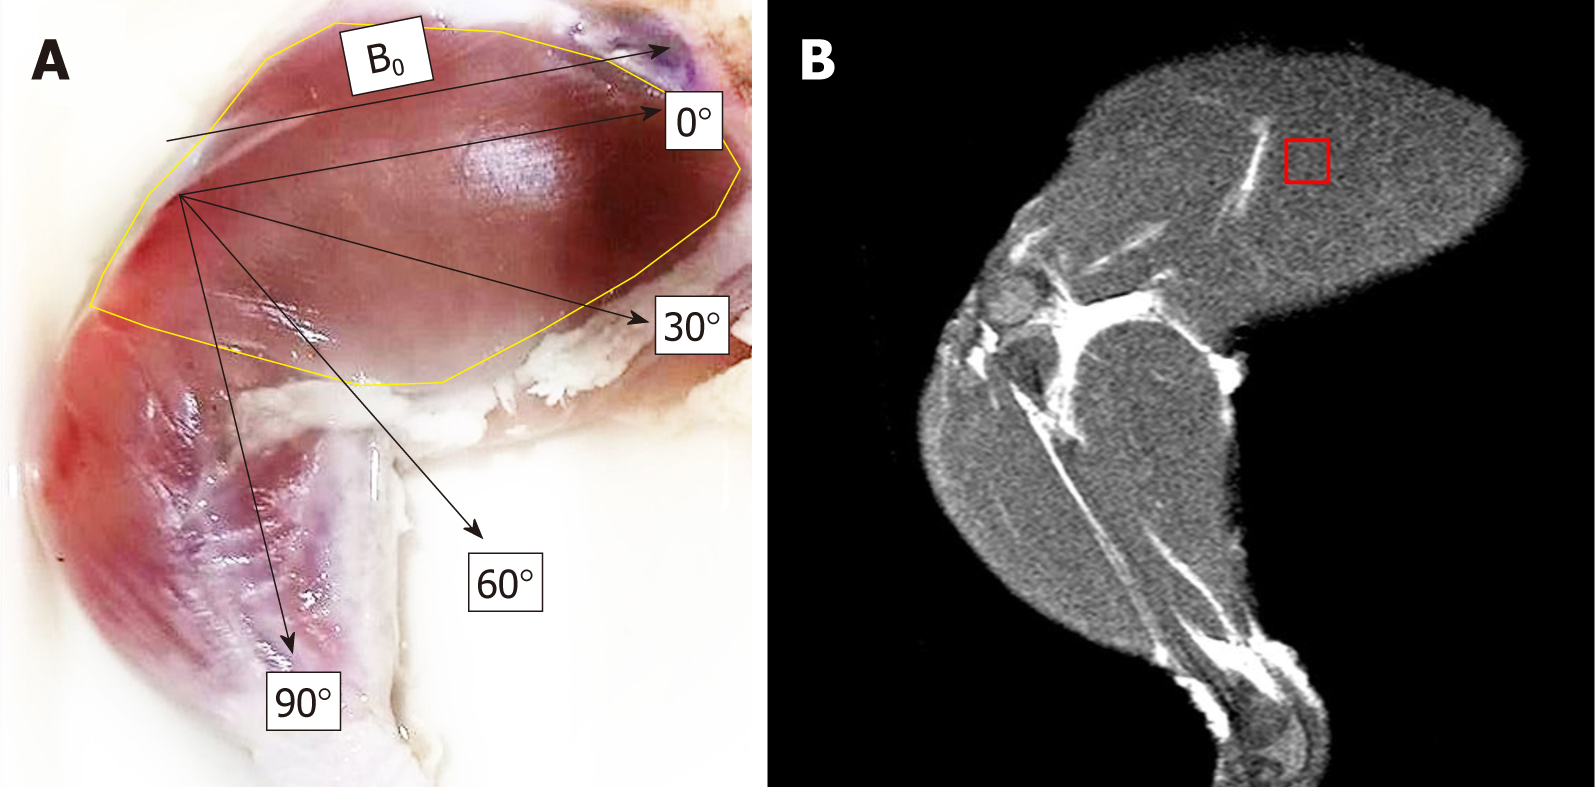
Chicken muscle spectra were acquired with a carefully placed voxel on the iliotibialis lateralis muscle, avoiding other muscle fasciae, bulk fat, and air, at different angles to B0 (Figure 1). In previous nuclear magnetic resonance studies, the chicken pectoral muscle tissue showed similar spectra and lipid chemical shifts to that of human muscles[15]. In this study, metabolites of interest were assigned with IMCL (CH3) at 0.9 ppm, EMCL (CH3) at 1.1 ppm, IMCL (CH2) at 1.3 ppm, EMCL (CH2) at 1.5 ppm, and Cr at 3.02 ppm. This was then quantified with an AMARES algorithm provided by a JMRUI.
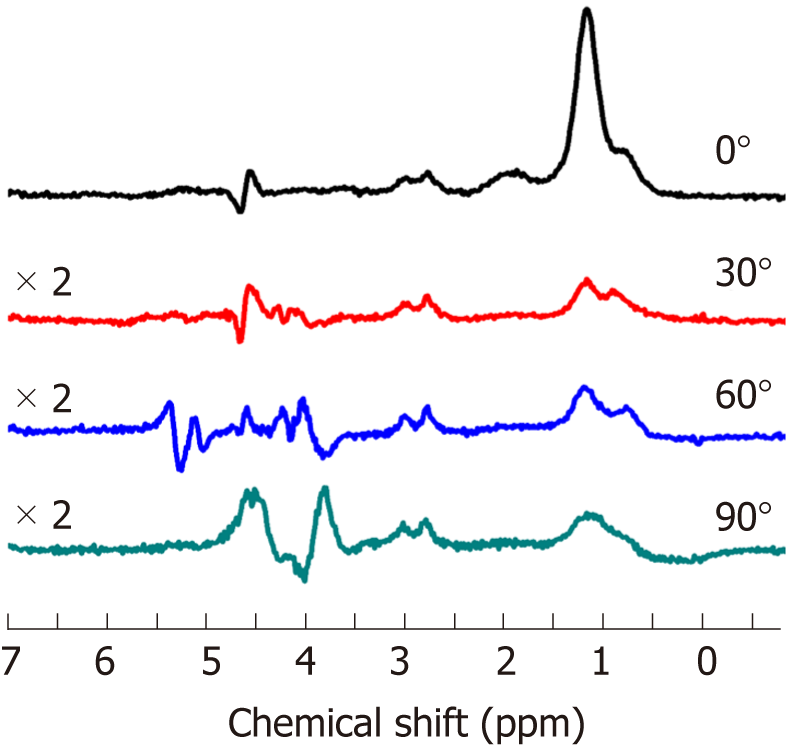
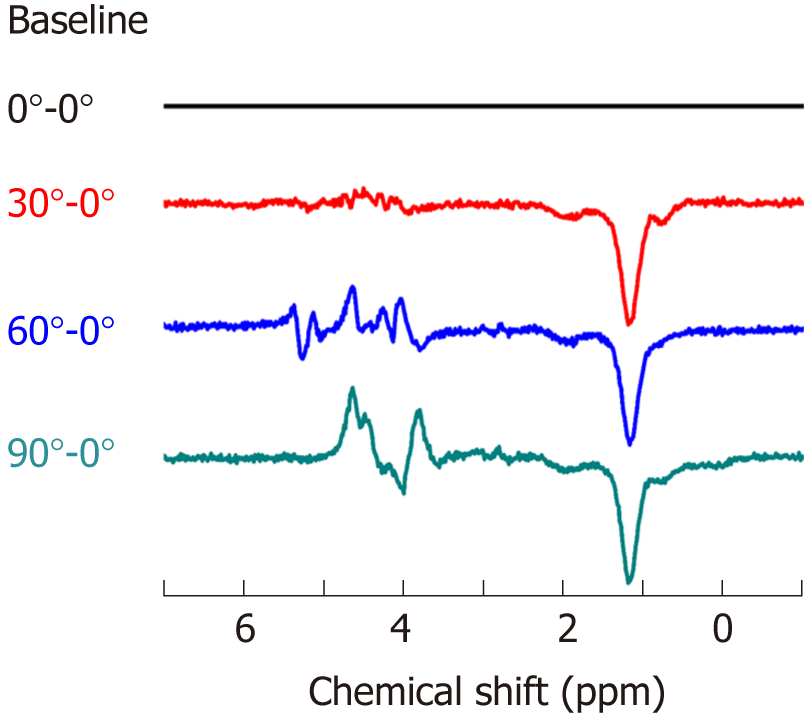
The representative spectra profile shown in Figure 2 clearly reveals that muscle spectra were affected by relative muscle fiber orientation to B0. The spectrum profile at 0° show more well-defined EMCL and IMCL spectra in both the CH3 and CH2 groups. The line widths of IMCL and EMCL in both CH3 and CH2 groups appear to be broadening, with an increasing angle of muscle alignment to B0, resulting in overlapping peaks. Additionally, the spectra at 30°, 60°, and 90° appeared to have smaller signal intensity and higher noise when compared to the spectra from 0°, as they were multiplied by a factor of 2. However, Cr at 3.02 ppm remained unaffected at every angle. The spectrum profile of orientation at 90° was the most different compared to other orientations. Figure 3 shows the muscle spectrum at 30°, 60°, and 90° subtracted by the baseline at 0°, which revealed drastically different spectrum profiles with alterations in each angle of muscle fiber from the residual form spectra subtraction.
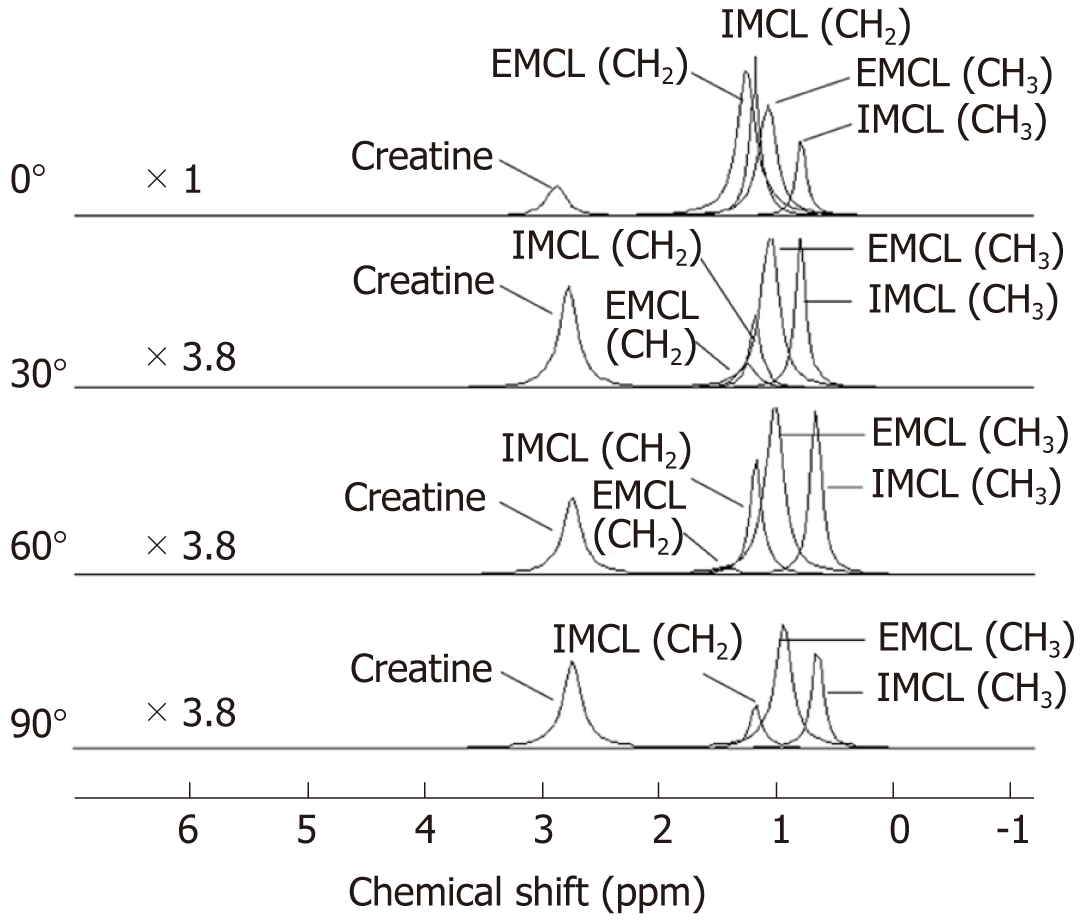
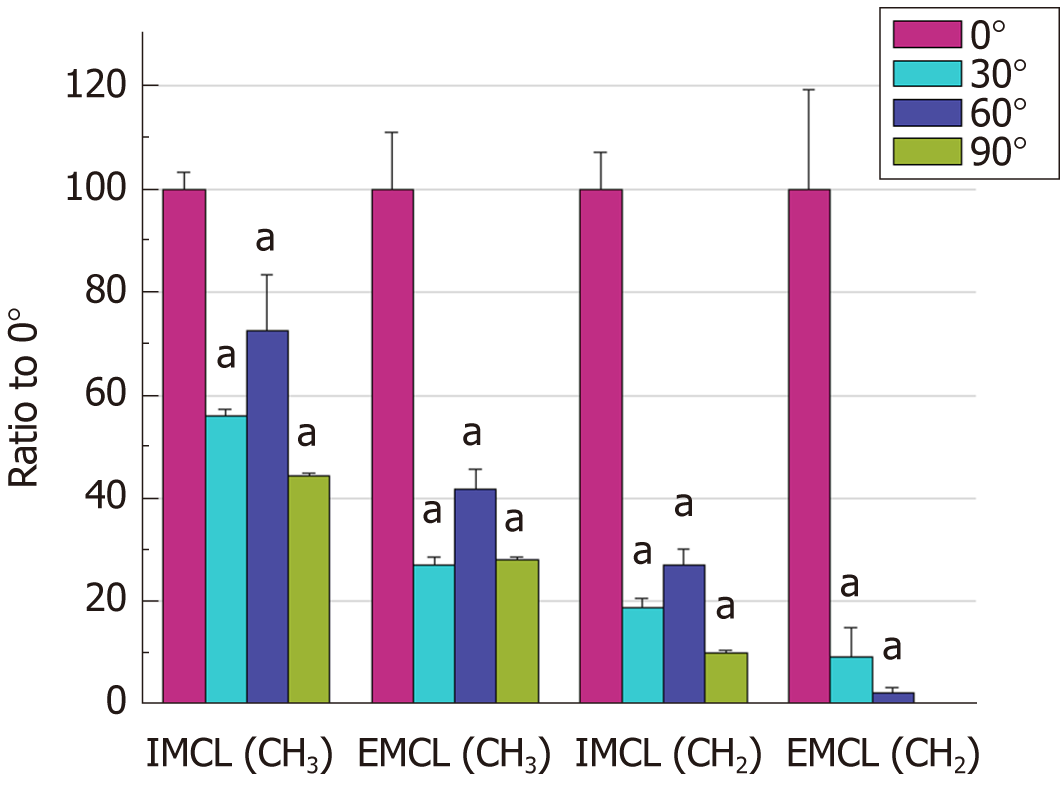
The AMARES algorithm with prior knowledge was performed by spectrum fitting into individual metabolites. Figure 4 shows that the quantification results obtained for EMCL (CH2) at 1.5 ppm were undetectable for any spectra obtained from 90° orientation and that EMCL (CH2) was undetectable from 2 spectra at 60°. It appears likely that the spectrum peak broadening made it difficult to differentiate metabolite peaks. The IMCL (CH3), EMCL (CH3), IMCL (CH2), and EMCL (CH2) were then calculated into a ratio to Cr as the internal reference in each spectrum acquired. The Wilcoxon signed-rank test was used for statistical analysis of lipid ratios to Cr at 0° and to other angles with P-values < 0.05. Lipid ratios to Cr were significantly different when comparing spectra at different orientations to 0° (Table 1). However, at 90°, the EMCL (CH2) peak could not be determined and was excluded from statistical analysis. EMCL and IMCL ratios to Cr were normalized by the mean lipid ratio at 0° to access the differences in ratios when compared to the relative muscle fiber orientation at 0°. The bar graph in Figure 5 demonstrates that the lipid ratios at different angles tended to be lower when compared to lipid ratios obtained at 0°. The comparisons between 0° and at 30°, 60°, and 90° were performed with Wilcoxon signed-rank test and were found to be significantly different from EMCL and IMCL ratios that were obtained from orientations at 0° in every muscle orientation (P-value < 0.05).
| Angle | Metabolite | |||||||
| IMCL (CH3), 0.9 ppm | P value | EMCL (CH3), 1.1 ppm | P value | IMCL (CH2), 1.3 ppm | P value | EMCL (CH2), 1.5 ppm | P value | |
| 0° | 1.44 (1.36-1.47) | - | 4.25 (4.22-5.35) | - | 2.96 (2.53-2.99) | - | 3.08 (2.09-3.46) | - |
| 30° | 0.80 (0.77-0.81) | 0.017a | 1.23 (1.16-1.33) | 0.017a | 0.55 (0.46-0.60) | 0.017a | 0.28 (0.04-0.44) | 0.017a |
| 60° | 1.15 (0.86-1.19) | 0.018a | 2.03 (1.69-2.08) | 0.018a | 0.77 (0.68-0.91) | 0.018a | 0.04 (0.04-0.11) | 0.042a |
| 90° | 0.64 (0.62-0.64) | 0.018a | 1.29 (1.27-1.32) | 0.018a | 0.30 (0.72-0.31) | 0.018a | - | - |
Muscle 1H MRS spectra are known for their unique characteristics, such as dipolar coupling and bulk magnetic susceptibility. Bulk susceptibility was observed to be involved with separation of the EMCL and IMCL peaks, while residual dipolar coupling influenced the resonance of Cr and phosphocreatine. Both dipolar couplings and bulk magnetic susceptibility are orientation dependent. The dipolar coupling effect the aqueous metabolite, while the bulk magnetic susceptibility effects are seen on orientation-dependent structures such as EMCL.
Bulk magnetic susceptibility is an effect that depends on orientation and tissue type, causing nuclei to differently experience the magnetic fields from the external B0[16]. Our study has shown that the effects of bulk magnetic susceptibility are caused by orientation with B0. The IMCL and EMCL qualification was affected by the muscle orientation to B0. Bulk magnetic susceptibility plays an important role in differentiating IMCL and EMCL resonance peaks, and causes wider spectrum bands, leading to shifts of resonance peaks that can affect the EMCL resonance. The results of the EMCL/Cr ratios in this study appear to be consistent with wider standard deviation (SD) values that are obtained when compared to IMCL/Cr taken from the same angle to B0.
In this study, the spectra obtained at the other angles appear to have smaller amplitudes when compared to those taken at 0°. Cr is able to pass through cell membranes and therefore is not affected by muscle alignment with the main magnetic field. EMCL is more affected by positioning because of the EMCL environment, which is attached to muscle fiber, and because it is orientation dependent. IMCL can rotate in muscle cytosol in an aqueous state and can therefore average bulk magnetic susceptibility effects[16,17]. In this study, spectrum profiles were different for each orientation of muscle fibers to the main magnetic field. The results suggest that the 1H MRS spectrum was affected not only by pennation angle, as observed in earlier studies[5] but also by the relative muscle alignment to B0.
Any prior knowledge concerning AMARES algorithms is known to improve metabolite quantification, but it also potentially causes error if the spectrum that was fitted is not a typical spectrum profile. A possible explanation for these results may be because the prior knowledge in the algorithm was obtained from typical human muscle spectrum, while spectrum profiles taken from various positions and orientations of muscle will tend to have peaks that are overlapped, and therefore are almost indistinguishable. This is particularly true for IMCL and EMCL resonance frequencies that were affected by bulk magnetic susceptibility.
These changes in spectrum profiles lead to inaccuracies in metabolite quantification. Different positions with the same qualification algorithms can lead to inaccuracies in metabolite quantification as well. This phenomenon occurs because prior knowledge and the metabolite qualification of metabolites was taken from typical orientations or from a muscle that almost parallels the main magnetic field, such as the tibialis anterior. It is impossible and unlikely to obtain a typical spectrum or prior knowledge from each and every angle. Additionally, the metabolites need to be studied in various muscles for various reasons, especially in deep muscles that are difficult to biopsy. It is important to set a universal standard for muscle orientation in 1H MRS or to obtain a typical spectrum for each muscle of interest to reduce any potential errors and to increase reproducibility.
However, this study observed only small changes from Cr at 3.02 ppm, which was possibly caused by the group rotation of a Cr methyl group that averages these effects out. While phosphocreatine peaks occurred at 4.1 ppm, there were no splitting peaks from any residual dipolar coupling effects. In agreement with previous studies, the residual dipolar coupling vanished after 1-2 h postmortem. This was approximately the same time at which phosphocreatine depletion occurred from energy failure[18]. Our results demonstrated that bulk magnetic susceptibility may play a vital role in the separation and qualification of IMCL and EMCL, without the effects being caused from muscle contraction and residual dipolar coupling.
This present study also indicates the effects of muscle orientation on 1H MRS spectrum data acquired from clinical field evidence and from other species. These results agree with the findings of other studies[18] in that bulk magnetic susceptibility is not exclusively seen in human muscles but is also found in both other mammals and poultry. This tendency occurs even when considering any observed bulk magnetic susceptibility that persists even for postmortem 1H MRS muscle spectra. A limitation of this pilot study that needs to be acknowledged is that the sample size is relatively small, and data were acquired from chickens with no diet control prior to the study. Additionally, there have been no previous studies done on any of the factors that affect IMCL and EMCL levels in chickens. Furthermore, prior knowledge for AMARES algorithms was obtained from human muscles, which can potentially cause quantification errors.
After taking these variables into account, these findings confirm previous findings and provide additional evidence suggesting that muscle spectra can be affected by the relative muscle orientation to the main magnetic field. Taken together, these findings indicate that these variables of muscle orientation must be taken into consideration. There are limitations in this study, such as the small number of samples and the small size of chicken muscles compared to human muscle. In conclusion, the metabolite profile changes are due to the muscle fiber orientation, which demonstrates that positioning potentially causes inaccuracies in 1H-MRS spectrum analysis.
Proton magnetic resonance spectroscopy (1H MRS) is a technique widely used for investigating metabolites in humans. Lipids that are stored outside the muscle cell are called extramyocellular lipids (EMCL), and lipids stored on the inside of muscle cells are called intramyocellular lipids (IMCL). The relationship between metabolic syndrome and IMCL has been extensively studied. However, muscle position in relation to the main magnetic field can affect spectra profiles, leading to inconsistency of metabolite quantification, which can then lead to misinterpretation.
There is no current study that has directly measured muscle alignment to the main magnetic field or how the muscle fibers are aligned between studies, as it is impossible exactly measure the angle of muscle relative to the main magnetic field in humans.
To determine the effects of the muscle fiber angle to the main magnetic field for obtaining spectrum profiles and muscle lipid quantification without the effects of muscle contraction. This study used extensor iliotibialis lateralis muscles taken from the thigh of a chicken as the muscle of interest. Since it is the uppermost muscle, it provides a clear visualization of the muscle fiber alignment related to the main magnetic field.
Chicken extensor iliotibialis lateralis muscles were used as the muscle of interest in this study. Magnetic resonance imaging (1.5 Tesla Philips Achieva) was used for the 1H MRS spectrum acquisition. The chicken extensor iliotibialis lateralis muscle fiber alignment was used as the reference and was place in the middle of the coil, positioned at 0˚, 30˚, 60˚, and 90˚ to the main magnetic field. Single voxel Point Resolved Spectroscopy pulse sequence was used for spectrum acquisition, having a voxel size of 8 mm × 8 mm × 20 mm. It was carefully placed on the iliotibialis lateralis muscle. Spectra acquisition was repeated 7 times for each angle. JMRUI version 6.0 β was used for metabolite peak assignment and analysis. Spectrum fitting was done by an AMARES algorithm with prior knowledge. The fitted spectrum showed various peaks of metabolites of interest in the following manner: IMCL (CH3) at 0.9 ppm, EMCL (CH3) at 1.1 ppm, IMCL (CH2) at 1.3 ppm, EMCL (CH2) at 1.5 ppm, and Cr at 3.02 ppm. IMCL and EMCL amplitudes fitted by AMARES were calculated into the ratio per signal intensity of Cr in each spectrum as the internal reference. The results of spectrum fitting at 0°, 30°, 60°, and 90° of muscle fiber orientation to the main magnetic field were compared using Wilcoxon signed-rank test.
The results showed that the metabolite profiles in each orientation of muscle fiber to the main magnetic field were different. The orientation at 90° was the most different compared to the other orientations. The quantity of muscle metabolites was statistically significantly changed at 30°, 60°, and 90° of muscle fiber relative to the main magnetic field when compared to 0° relative to the main magnetic field. Statistical analysis showed statistically significant differences for IMCL (CH3), EMCL (CH3), IMCL (CH2) at 30°, 60°, and 90° (P = 0.017, 0.018, and 0.018, respectively) and EMCL (CH2) at 30° and 60° (P = 0.017 and 0.042, respectively). EMCL (CH2) at 90° was unable to be measured in this study. Furthermore, the muscle lipids quantified at 30°, 60°, and 90° tended to be lower when compared to 0°. The metabolite profile changed due to the muscle fiber orientation, indicating that positioning potentially causes inaccuracies in 1H-MRS spectrum analysis.
This study has determined that the basic muscle orientations to the main magnetic field can and do affect 1HMRS spectrum profiles and quantification. Muscle orientation is often treated with less care in studies on 1H MRS. These metabolite profile changes are due to the muscle fiber orientation, which demonstrates that the positioning potentially causes inaccuracy in 1H-MRS spectrum analysis.
1H MRS practitioners and users need to be especially careful when positioning any muscles or any organs of interest in order to reduce error, to be able to compare spectrum results across various institutions and to ensure reproducibility and uniformity.
Manuscript source: Unsolicited manuscript
Specialty type: Radiology, nuclear medicine and medical imaging
Country of origin: Thailand
Peer-review report classification
Grade A (Excellent): 0
Grade B (Very good): 0
Grade C (Good): C, C
Grade D (Fair): D
Grade E (Poor): 0
P- Reviewer: Cheng TH, Gao BL, Labusca L S- Editor: Ma YJ L- Editor: A E- Editor: Bian YN
| 1. | Machann J, Stefan N, Schick F. (1)H MR spectroscopy of skeletal muscle, liver and bone marrow. Eur J Radiol. 2008;67:275-284. [RCA] [PubMed] [DOI] [Full Text] [Cited by in Crossref: 83] [Cited by in RCA: 78] [Article Influence: 4.3] [Reference Citation Analysis (0)] |
| 2. | Jacob S, Machann J, Rett K, Brechtel K, Volk A, Renn W, Maerker E, Matthaei S, Schick F, Claussen CD, Häring HU. Association of increased intramyocellular lipid content with insulin resistance in lean nondiabetic offspring of type 2 diabetic subjects. Diabetes. 1999;48:1113-1119. [RCA] [PubMed] [DOI] [Full Text] [Cited by in Crossref: 474] [Cited by in RCA: 467] [Article Influence: 17.3] [Reference Citation Analysis (0)] |
| 3. | Baum T, Cordes C, Dieckmeyer M, Ruschke S, Franz D, Hauner H, Kirschke JS, Karampinos DC. MR-based assessment of body fat distribution and characteristics. Eur J Radiol. 2016;85:1512-1518. [RCA] [PubMed] [DOI] [Full Text] [Cited by in Crossref: 47] [Cited by in RCA: 69] [Article Influence: 6.9] [Reference Citation Analysis (0)] |
| 4. | Velan S, Said N, Narasimhan K, Spencer R, Raylman R, Rajendran V, Alway S. Ankle orientation alters bulk susceptibility and residual dipolar couplings during plantar flexion and dorsiflexion of skeletal muscle. Proceedings 16th Scientific Meeting, International Society for Magnetic Resonance in Medicine; 2008 May 3-9; Canada. . |
| 5. | Takashima H, Shishido H, Imamura R, Akatsuka Y, Taniguchi K, Nakanishi M, Suzuki J, Nagahama H, Sakurai Y, Sakata M. Effect of ankle flexion on the quantification of MRS for intramyocellular lipids of the tibialis anterior and the medial gastrocnemius. Radiol Phys Technol. 2015;8:209-214. [RCA] [PubMed] [DOI] [Full Text] [Cited by in Crossref: 3] [Cited by in RCA: 4] [Article Influence: 0.4] [Reference Citation Analysis (0)] |
| 6. | Marjańska M, Eberly LE, Adriany G, Verdoliva SN, Garwood M, Chow L. Influence of foot orientation on the appearance and quantification of 1H magnetic resonance muscle spectra obtained from the soleus and the vastus lateralis. Magn Reson Med. 2012;68:1731-1737. [RCA] [PubMed] [DOI] [Full Text] [Cited by in Crossref: 7] [Cited by in RCA: 8] [Article Influence: 0.6] [Reference Citation Analysis (0)] |
| 7. | Khuu A, Ren J, Dimitrov I, Woessner D, Murdoch J, Sherry AD, Malloy CR. Orientation of lipid strands in the extracellular compartment of muscle: effect on quantitation of intramyocellular lipids. Magn Reson Med. 2009;61:16-21. [RCA] [PubMed] [DOI] [Full Text] [Full Text (PDF)] [Cited by in Crossref: 22] [Cited by in RCA: 23] [Article Influence: 1.4] [Reference Citation Analysis (0)] |
| 8. | Vermathen P, Boesch C, Kreis R. Mapping fiber orientation in human muscle by proton MR spectroscopic imaging. Magn Reson Med. 2003;49:424-432. [RCA] [PubMed] [DOI] [Full Text] [Cited by in Crossref: 49] [Cited by in RCA: 46] [Article Influence: 2.0] [Reference Citation Analysis (0)] |
| 9. | Naressi A, Couturier C, Devos JM, Janssen M, Mangeat C, de Beer R, Graveron-Demilly D. Java-based graphical user interface for the MRUI quantitation package. MAGMA. 2001;12:141-152. [RCA] [PubMed] [DOI] [Full Text] [Cited by in Crossref: 762] [Cited by in RCA: 802] [Article Influence: 32.1] [Reference Citation Analysis (0)] |
| 10. | Stefan D, Cesare FD, Andrasescu A, Popa E, Lazariev A, Vescovo E, Strbak O, Williams S, Starcuk Z, Cabanas M, Ormondt DV, Graveron-Demilly D. Quantitation of magnetic resonance spectroscopy signals: the jMRUI software package. Meas Sci Technol. 2009;20:104035. [DOI] [Full Text] |
| 11. | Physical status: the use of and interpretation of anthropometry, report of a WHO expert committee. Geneva: World Health Organization, 1995. Available from: URL: http://www.who.int/iris/handle/10665/37003. |
| 12. | Vanhamme L, van den Boogaart A, Van Huffel S. Improved method for accurate and efficient quantification of MRS data with use of prior knowledge. J Magn Reson. 1997;129:35-43. [RCA] [PubMed] [DOI] [Full Text] [Cited by in Crossref: 1267] [Cited by in RCA: 1287] [Article Influence: 44.4] [Reference Citation Analysis (0)] |
| 13. | Weis J, Johansson L, Ortiz-Nieto F, Ahlström H. Assessment of lipids in skeletal muscle by LCModel and AMARES. J Magn Reson Imaging. 2009;30:1124-1129. [RCA] [PubMed] [DOI] [Full Text] [Cited by in Crossref: 28] [Cited by in RCA: 37] [Article Influence: 2.3] [Reference Citation Analysis (0)] |
| 14. | Pijnappel WWF, van den Boogaart A, de Beer R, van Ormondt D. SVD-based quantification of magnetic resonance signals. J Magn Reson. 1969;97:122-134. [RCA] [DOI] [Full Text] [Cited by in Crossref: 86] [Cited by in RCA: 73] [Article Influence: 2.1] [Reference Citation Analysis (0)] |
| 15. | Le Roy CI, Mappley LJ, La Ragione RM, Woodward MJ, Claus SP. NMR-based metabolic characterization of chicken tissues and biofluids: a model for avian research. Metabolomics. 2016;12:157. [RCA] [PubMed] [DOI] [Full Text] [Full Text (PDF)] [Cited by in Crossref: 36] [Cited by in RCA: 36] [Article Influence: 3.6] [Reference Citation Analysis (0)] |
| 16. | Boesch C, Machann J, Vermathen P, Schick F. Role of proton MR for the study of muscle lipid metabolism. NMR Biomed. 2006;19:968-988. [RCA] [PubMed] [DOI] [Full Text] [Cited by in Crossref: 157] [Cited by in RCA: 149] [Article Influence: 7.5] [Reference Citation Analysis (0)] |
| 17. | Szczepaniak LS, Dobbins RL, Stein DT, McGarry JD. Bulk magnetic susceptibility effects on the assessment of intra- and extramyocellular lipids in vivo. Magn Reson Med. 2002;47:607-610. [RCA] [PubMed] [DOI] [Full Text] [Cited by in Crossref: 66] [Cited by in RCA: 61] [Article Influence: 2.5] [Reference Citation Analysis (0)] |
| 18. | Ntziachristos V, Kreis R, Boesch C, Quistorff B. Dipolar resonance frequency shifts in 1H MR spectra of skeletal muscle: confirmation in rats at 4.7 T in vivo and observation of changes postmortem. Magn Reson Med. 1997;38:33-39. [RCA] [PubMed] [DOI] [Full Text] [Cited by in Crossref: 31] [Cited by in RCA: 30] [Article Influence: 1.0] [Reference Citation Analysis (0)] |


