Copyright
©The Author(s) 2016.
World J Radiol. Aug 28, 2016; 8(8): 750-756
Published online Aug 28, 2016. doi: 10.4329/wjr.v8.i8.750
Published online Aug 28, 2016. doi: 10.4329/wjr.v8.i8.750
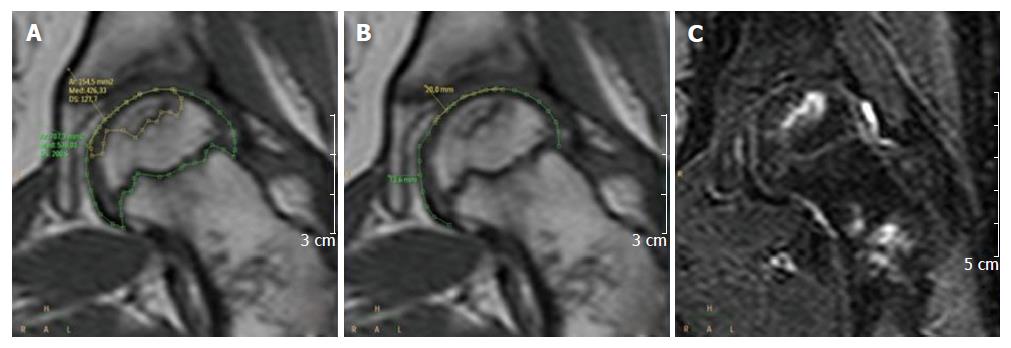
Figure 1 Assessment of relative volume and relative surface.
The measurements were performed on a dedicated workstation on the T1-weighted images, both for RV (A) and RS (B) for each slice of the series. The corresponding STIR images (C) were reviewed in order to better evaluate the extent of the necrotic process. RV: Relative volume; RS: Relative surface; STIR: Short time inversion recovery.
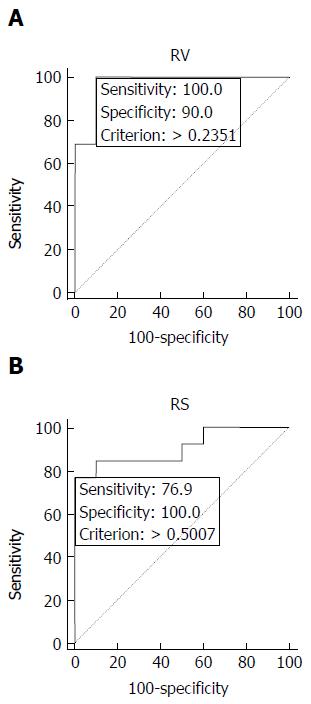
Figure 2 Receiver-operator characteristic curves analysis of relative volume and relative surface.
RV (A) performed best with a threshold of 0.23 (sensitivity 100%, specificity 90%), while RS (B) with a threshold of 0.50 (sensitivity 77%, specificity 90%). RV: Relative volume; RS: Relative surface.
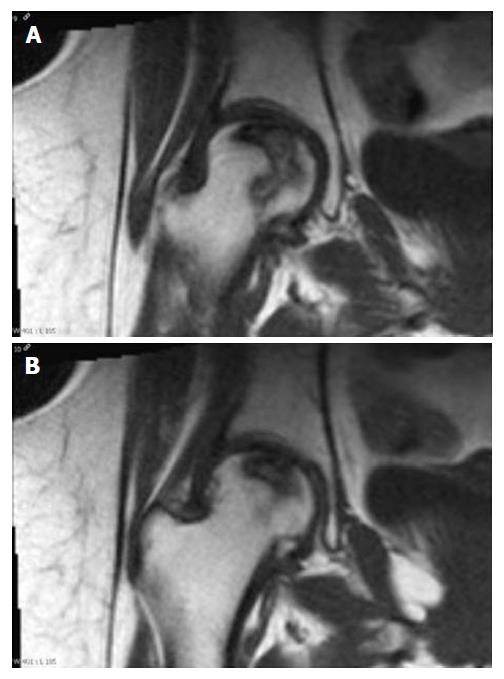
Figure 3 Two adjacent coronal T1-weighted images show the discrepancy between the two parameters (volume, A vs surface area, B) considered for the prediction of future joint deformity.
Even if the overall necrotic lesion is rather big (A), there is only a minor involvement of the femoral head surface (B): In these cases RV performed better than RS in predicting femoral head deformity. RV: Relative volume; RS: Relative surface.
- Citation: Ippolito D, Masetto A, Talei Franzesi C, Bonaffini PA, Casiraghi A, Sironi S. Relative volume measured with magnetic resonance imaging is an articular collapse predictor in hematological pediatric patients with femoral head osteonecrosis. World J Radiol 2016; 8(8): 750-756
- URL: https://www.wjgnet.com/1949-8470/full/v8/i8/750.htm
- DOI: https://dx.doi.org/10.4329/wjr.v8.i8.750


