Copyright
©The Author(s) 2016.
World J Radiol. Nov 28, 2016; 8(11): 868-879
Published online Nov 28, 2016. doi: 10.4329/wjr.v8.i11.868
Published online Nov 28, 2016. doi: 10.4329/wjr.v8.i11.868
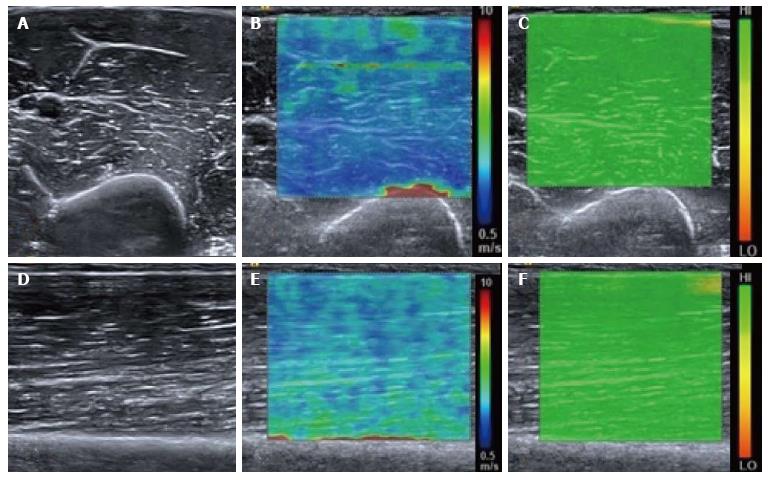
Figure 1 Normal relaxed biceps brachii muscle.
B mode transverse image of the mid biceps brachii muscle (A) with the corresponding shear wave elastography image (B) showing the shear wave velocity distribution. The velocity map is coloured such that blue represents the slowest waves and red the fastest, illustrated by the scale. Note the fast (red colour) shear waves at the interface with the hard humeral bone. A range of shear wave velocities are seen at the fascial interfaces within the muscle belly. The upper right image (C) shows the quality map with green colouring representing a high quality elastogram. Corresponding longitudinal B mode image of the mid biceps brachii muscle (D), shear wave velocity image (E) and quality map (F). The velocity distribution is slightly different in the longitudinal plane compared with the transverse plane owing to the greater effect of anisotropy in the transverse plane compared with the longitudinal plane.
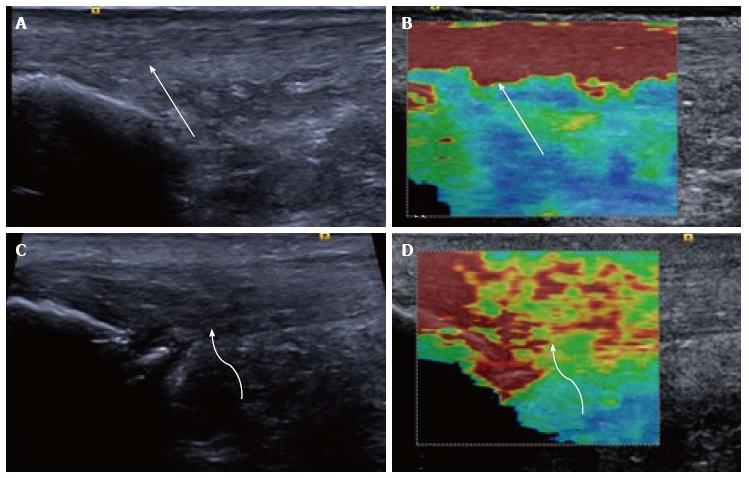
Figure 2 Longitudinal shear wave elastography of the Achilles tendon.
In a healthy volunteer the Achilles tendon is seen as smooth and homogeneous (arrow) on the B mode image (A) with a homogeneous elastogram (B, arrow). In a patient with symptomatic Achilles tendinopathy there is an alteration of the B mode echotexture with regions of hypoechogenicity (C, curved arrow) and dystrophic ossification at the calcaneal enthesis. The elastogram (D) is heterogeneous with regions of blue and yellow colouring (curved arrow) corresponding to a slower velocity and tendon softening.
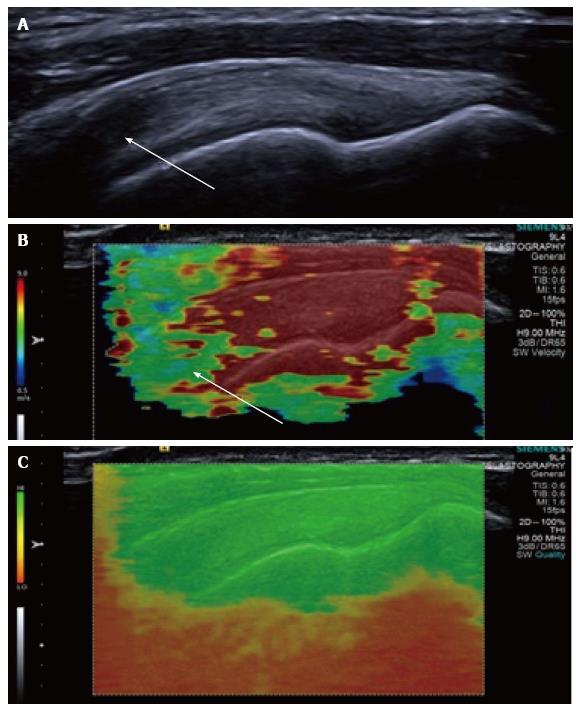
Figure 3 Longitudinal shear wave elastography of a normal supraspinatus tendon.
Normal B mode appearances (A) showing anisotropy (arrow) owing to the curved orientation of the tendon. The corresponding elastogram (B) shows heterogeneous stiffness at the region of anisotropy (arrow) and absence of measurements from deep in the humeral head. The quality map (C) shows a high quality elastogram in the tendon substance and poor quality in the bone, as would be expected for such a stiff structure with limited propagation of shear waves.
Figure 4 Longitudinal shear wave elastography of a tendinopathic supraspinatus tendon showing a disorganised, heterogeneous pattern, contrasted to the homogeneous appearance of the normal tendon in Figure 3.
Note the regions of interest (small boxes) where shear wave velocity measurements have been taken.
Figure 5 Longitudinal shear wave elastography of a tendinopathic supraspinatus tendon in a different patient to Figure 4.
The B mode image (A) shows a partial thickness tear involving the bursal surface fibres (arrow). The corresponding velocity elastogram (B) shows a disorganised pattern with the tear less well delineated (arrow) compared with the B mode image.
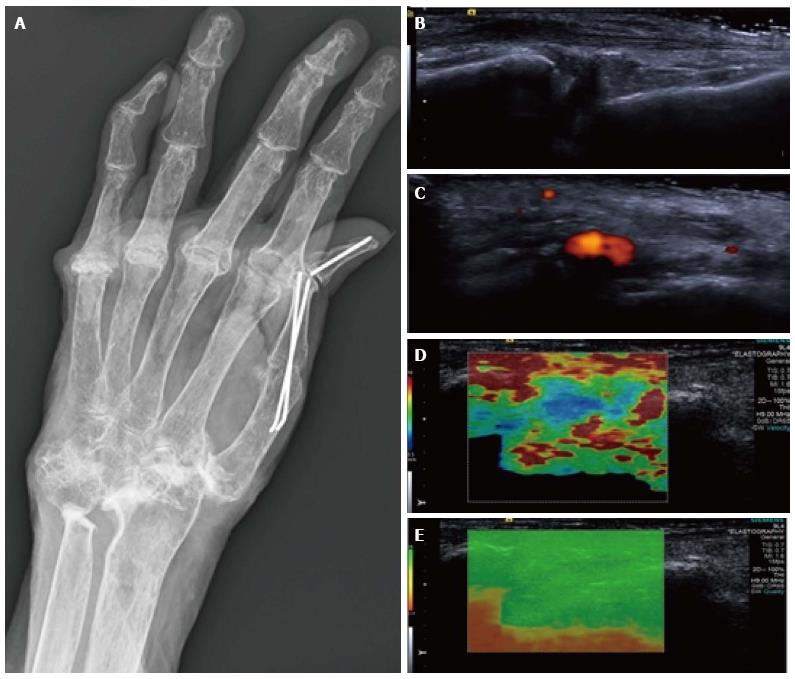
Figure 6 Synovitis at the carpus.
Radiograph (A) in a patient with long-standing rheumatoid arthritis and worsening wrist pain. The longitudinal B mode image (B) and colour Doppler image (C) show hypoechogenicity of the synovium with increased Doppler flow indicating an active synovitis. The corresponding longitudinal shear wave velocity elastogram (D) shows relatively uniformly soft synovium (blue colour) compared with the adjacent tissues which are more heterogeneous in their stiffness. The significance of this has not yet been adequately investigated. The elastogram is of good quality (E).
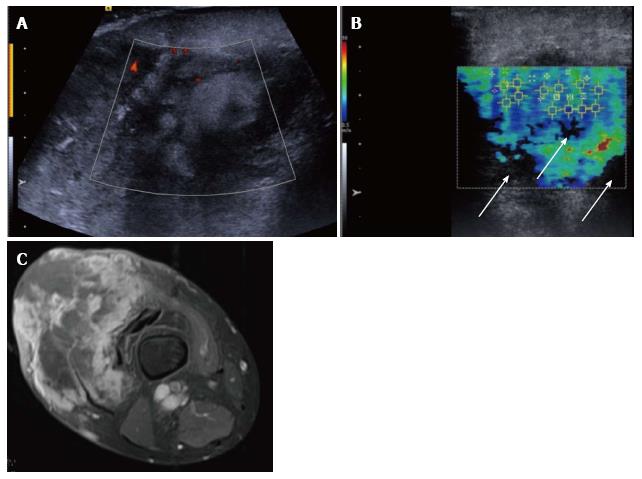
Figure 7 Pleomorphic sarcoma of the distal thigh.
Transverse B mode image with colour Doppler (A) shows a disorganised tumour with wide variation in echotexture and limited Doppler flow. The shear wave velocity elastogram (B) also shows a wide variation in stiffness with some regions of absent measurements, seen as the black areas on the image (arrow), possibly owing to the very dense/stiff nature of the tumour. The axial proton density fat suppressed magnetic resonance image (C) shows a large tumour in the anterior compartment of the thigh with very varied signal.
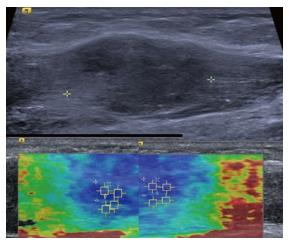
Figure 8 Intramuscular nodular fasciitis, longitudinal images.
The B mode image (upper image) shows that the margins of the lesion are poorly defined and relatively hard to discern. The shear wave velocity elastograms (lower images) show a clear difference in stiffness between the lesion and adjacent normal muscle fibres, as shown by the blue (slow) colour map of the lesion compared with the green and red (faster) colour map of the adjacent muscle fibres.
- Citation: Winn N, Lalam R, Cassar-Pullicino V. Sonoelastography in the musculoskeletal system: Current role and future directions. World J Radiol 2016; 8(11): 868-879
- URL: https://www.wjgnet.com/1949-8470/full/v8/i11/868.htm
- DOI: https://dx.doi.org/10.4329/wjr.v8.i11.868


