Copyright
©The Author(s) 2015.
World J Radiol. Nov 28, 2015; 7(11): 405-414
Published online Nov 28, 2015. doi: 10.4329/wjr.v7.i11.405
Published online Nov 28, 2015. doi: 10.4329/wjr.v7.i11.405
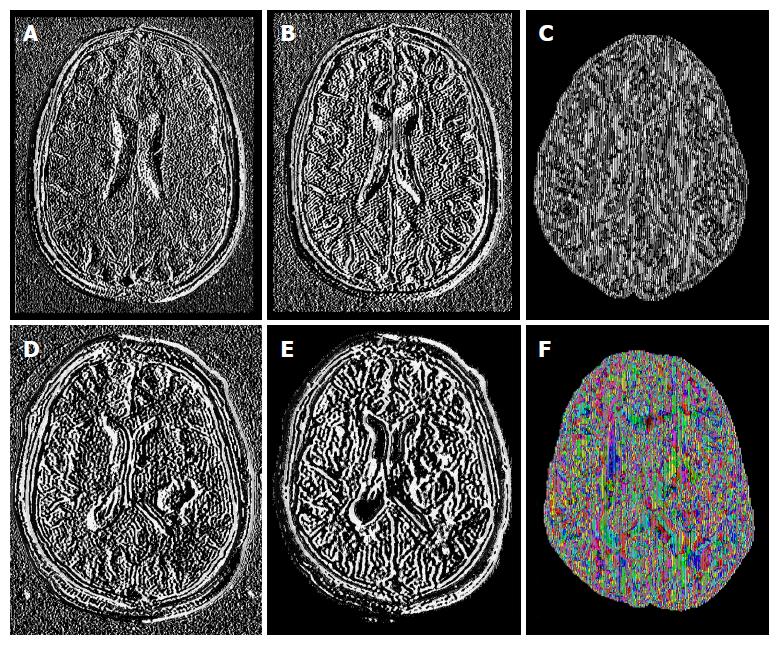
Figure 1 Example of some sequences and diffusion tensor imaging maps from healthy brains (upper row) and brains with glioblastoma multiforme (lower row): T1-postgadolinium images (A and D), Flair sequence (B and E); pure isotropic diffusion (C), color map of the V1-vector (F).
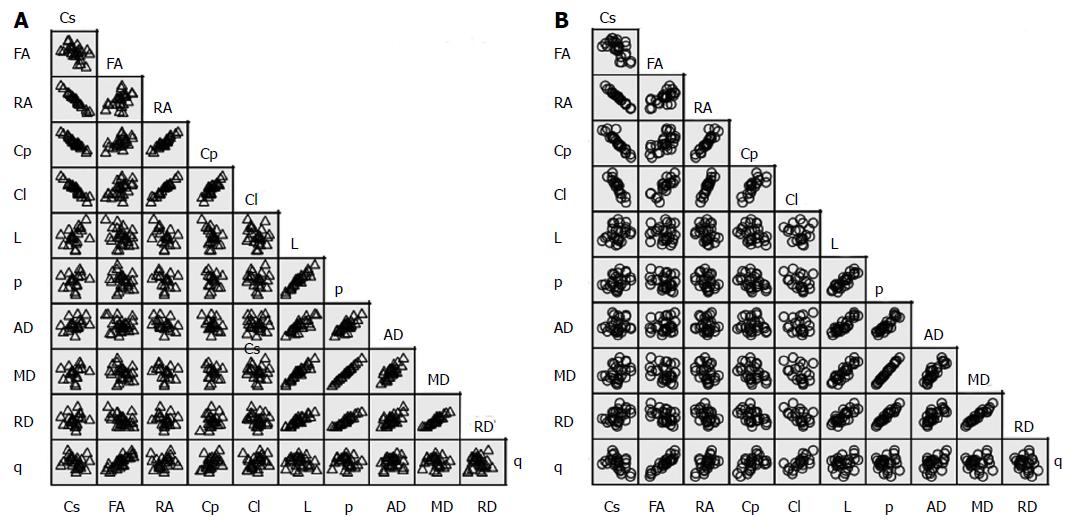
Figure 2 Scatter matrix of the variable’s data grouped by diagnosis.
A: Normal brains; B: Brains with GBM. MD: Mean diffusivity; FA: Fractional anisotropy; RA: Relative anisotropy; RD: Radial diffusivity; AD: Axial diffusivity; Cs: Spherical tensor; p: Pure isotropic diffusion; q: Pure anisotropic diffusion; L: Total magnitude of the diffusion tensor; Cl: Linear tensor; Cp: Planar tensor; GBM: Glioblastoma multiforme.
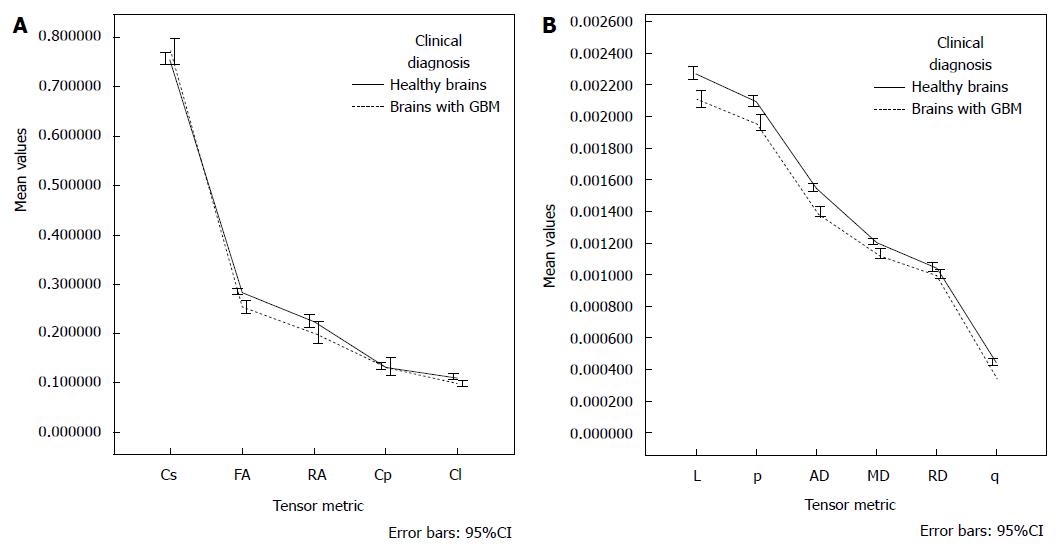
Figure 3 Graphs of the estimated marginal means for each tensor metric, the influence of age was controlled at the value of 43.
92 years. MD: Mean diffusivity; FA: Fractional anisotropy; RA: Relative anisotropy; RD: Radial diffusivity; AD: Axial diffusivity; p: Pure isotropic diffusion; q: Pure anisotropic diffusion; L: Total magnitude of the diffusion tensor; Cl: Linear tensor; Cp: Planar tensor; GBM: Glioblastoma multiforme.
- Citation: Cortez-Conradis D, Rios C, Moreno-Jimenez S, Roldan-Valadez E. Partial correlation analyses of global diffusion tensor imaging-derived metrics in glioblastoma multiforme: Pilot study. World J Radiol 2015; 7(11): 405-414
- URL: https://www.wjgnet.com/1949-8470/full/v7/i11/405.htm
- DOI: https://dx.doi.org/10.4329/wjr.v7.i11.405


