©2014 Baishideng Publishing Group Inc.
World J Radiol. Sep 28, 2014; 6(9): 657-668
Published online Sep 28, 2014. doi: 10.4329/wjr.v6.i9.657
Published online Sep 28, 2014. doi: 10.4329/wjr.v6.i9.657
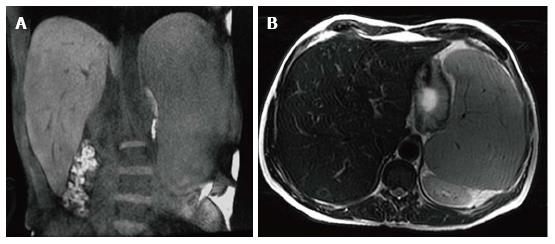
Figure 1 Hepatosplenomegaly.
Coronal T1 WI (A) and axial T2 WI (B) images in a male type 1 GD patient with N370S/N370S genotype demonstrate marked hepatosplenomegaly. The liver volume measured 3235 cc. The spleen volume measured 2923 cc.
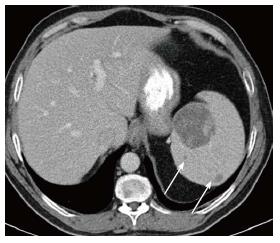
Figure 2 Splenic mass on computed tomography.
Axial computed tomography image shows a large low density mass with patchy foci of soft tissue density within it in the medial aspect of the spleen. Additional smaller low density masses are present as well (arrows).
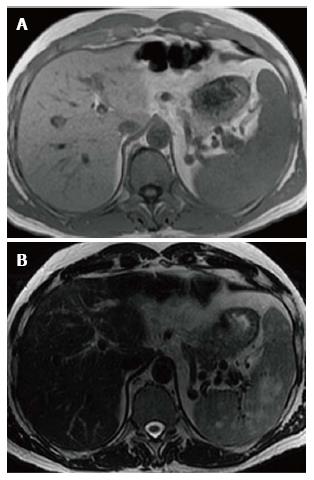
Figure 3 Splenic mass on magnetic resonance.
Axial T1WI (A) image shows no apparent abnormality within the spleen consistent with isointense signal intensity (SI) masses. Axial T2WI (B) image at the same level reveals multiple masses in the spleen to be high SI.
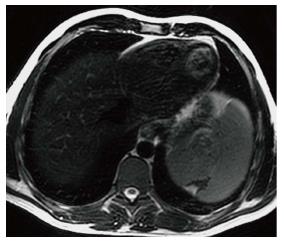
Figure 4 Splenic infarct.
Axial T2 WI image demonstrates a wedge shaped defect in a subcapsular region of the spleen in its superior aspect. The defect has low signal intensity (SI) along the edges indicating fibrous tissue. In addition, high SI fat has filled the area left by the retracted capsule.
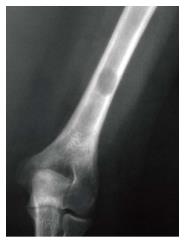
Figure 5 Lytic lesion.
Frontal radiograph of the distal right humerus demonstrates a well demarcated lytic lesion that does not show sclerotic borders, endosteal erosion or associated expansion of the humeral shaft.
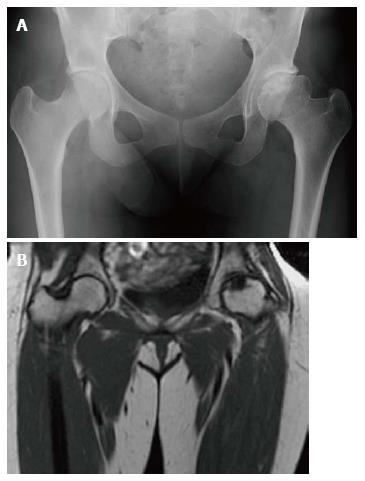
Figure 6 Osteonecrosis.
Frontal radiograph of the pelvis (A) shows avascular necrosis of the left femoral head. The femoral head has a flattened contour with sclerosis in the subcapsular areas. Note that the joint space is maintained. Coronal T1 WI (B) in the same patient again demonstrated an abnormal shape of the left femoral head with flattening superiorly. In the same area there is a focus of low SI indicating the devasularized bone.
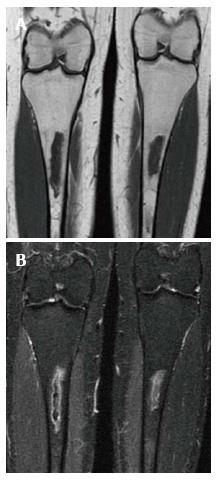
Figure 7 Medullary infarction.
Coronal T1 WI (A) image shows irregularly bordered areas of low SI within the medullary cavity of both tibiae. The same areas show peripheral serpigenous high SI on the coronal short tau inversion recovery (STIR) (B) image. The appearance is typical of an infarct.
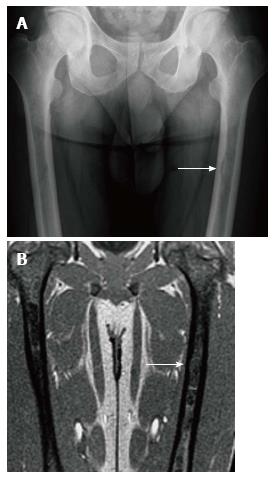
Figure 8 Endosteal scalloping.
Frontal radiograph (A) of the femurs shows an area of rounded thinning of the medial cortex of the left femur (arrow). Coronal out of phase image of the femurs in the same patient (B) shows low signal intensity in that same area due to expansion of the medullary cavity due to infiltration. The thinning of the cortex is less apparent on magnetic resonance than on radiography.
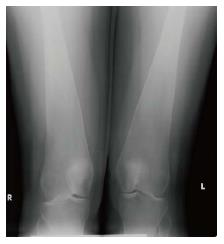
Figure 9 Erlenmeyer flask deformity.
Frontal radiograph of the distal femurs demonstrates flaring of the bone and thinning of the cortex due to under-tubulation of the metadiaphysis.
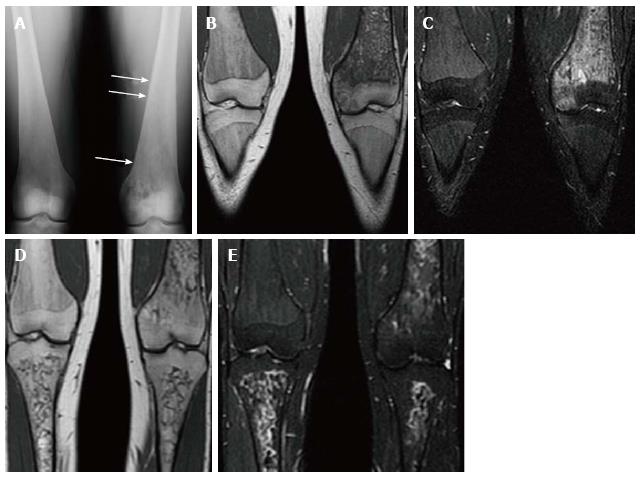
Figure 10 Psuedo-osteomyelitis.
Frontal radiograph of both distal femurs in 2009 (A) demonstrates an irregular area of patchy lucency in the medial condyle of the left femur. There is periosteal reaction in this area as well as more superiorly (arrows). Coronal T1 WI (B) image at the same time in 2009 demonstrate low SI in the medial condyle of the femur extending into the medial epiphysis. There is high SI in these areas on coronal STIR (C) image which extends into the adjacent soft tissues where the periosteal reaction is seen on the radiograph. There is no joint effusion. The patient presented with left knee pain and the imaging was suspicious for osteomyelitis involving the medial distal femur. However, the patient has no fever and cultures were negative. Coronal T1 WI (D) of the same area in 2011 shows resolution of the low SI in the medial condyle and epiphysis. The corresponding high SI on the STIR image (E) has resolved as well.
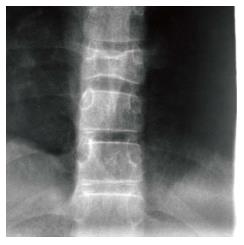
Figure 11 H-shaped vertebra.
Cone down frontal radiograph of the lower thoracic spine demonstrates collapse of a lower thoracic vertebral body with bi-concave upper and lower end plates giving the Reynolds phenomenon of Gaucher disease.
Figure 12 Bone marrow infiltration.
Coronal T1 WI (A) of the distal femora and proximal tibiae in a type 1 gaucher disease patient shows low signal intensity (SI) in the bone marrow which spares the epiphyses that demonstrate the normal fatty marrow SI. Coronal short tau inversion recover (STIR) (B) image demonstrates that the low SI on T1 becomes slightly high SI on STIR.
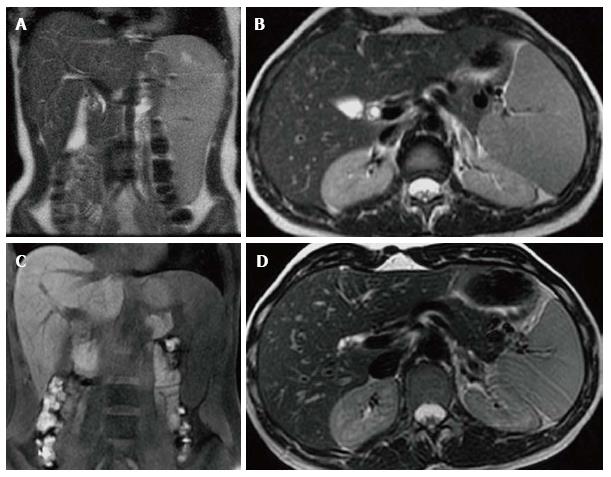
Figure 13 Visceral improvement on enzyme replacement therapy.
Female type 3 Gaucher disease patient who began enzyme replacement therapy (ERT) in 2007. Initial evaluation in 2007 before starting ERT shows that the spleen extends down to the iliac crest on the T2 WI coronal image (A). On the axial T2 WI (B) the left lobe of the liver extends across the midline posterior to the lateral aspect of the left rectus abdominus muscle and anterior to the stomach. At that time the liver volume measured 1702 cc and the spleen volume measured 769 cc. After 6 years on treatment, repeat imaging in 2013 reveals the inferior edge of the spleen is now above the iliac crest on the coronal T1 WI (C) and the left lobe of the liver now extends only slightly across the midline to end posterior to the medial aspect of the rectus abdominus muscle and the stomach is now lateral to the liver on the axial T2 WI (D). In 2013, the liver volume measured 1163 cc and the spleen volume measured368 cc.
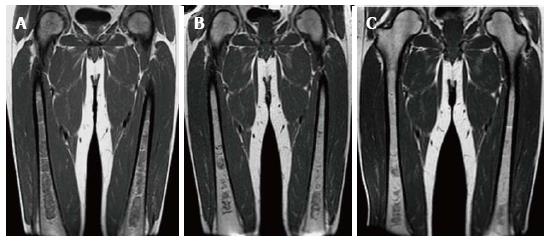
Figure 14 Bone marrow improvement on enzyme replacement therapy.
Type 1 GD male patient with N370S/N370S genotype who began enzyme replacement therapy (ERT) in October of 2007 shows relatively rapid improvement of the bone marrow infiltration. Initial coronal T1 WI of the femora (A) demonstrates diffuse low SI throughout the medullary cavity consistent with marked infiltration. Coronal T1 WI in 2009 (B) after only 2 years of treatment shows significant improvement in the infiltration manifest by decreased low SI in the medullary cavity. In 2011, coronal T1 WI (C) shows continued slight decrease in the amount of low SI in the bone marrow.
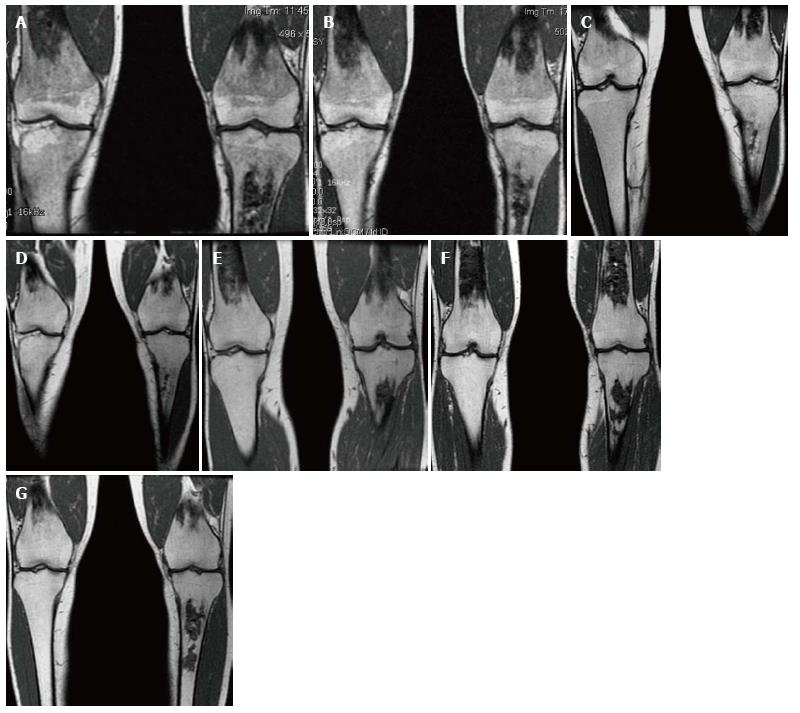
Figure 15 Bone marrow improvement.
Gaucher Type 1 patient with N370S/N370S genotype who started enzyme replacement therapy (ERT) in 1997. Coronal T1 WI of the distal femora and proximal tibiae in 1998 (A), 1999 (B), 2002 (C), 2003 (D), 2006 (E), 2008 (F) and 2011 (G). Medullary infarcts are partially seen in both distal femurs and the left tibia. The low T1 SI significantly improves between 1998 and 2002 with near normal marrow signal seen in the noninfarcted areas in 2008 and years later. Although this patient has the same genotype as the patient in Figure 14, there is a longer time to improvement indicating the limited genotype/phenotype correlation.
- Citation: Simpson WL, Hermann G, Balwani M. Imaging of Gaucher disease. World J Radiol 2014; 6(9): 657-668
- URL: https://www.wjgnet.com/1949-8470/full/v6/i9/657.htm
- DOI: https://dx.doi.org/10.4329/wjr.v6.i9.657


