©2014 Baishideng Publishing Group Inc.
World J Radiol. Sep 28, 2014; 6(9): 643-656
Published online Sep 28, 2014. doi: 10.4329/wjr.v6.i9.643
Published online Sep 28, 2014. doi: 10.4329/wjr.v6.i9.643
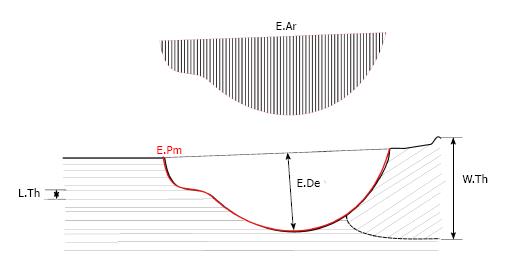
Figure 1 Schematic representation of different resorption cavity related measurements on 2D histological sections: Eroded area, erosion perimeter, wall thickness and lamellar thickness.
E.Ar: Eroded area; E.Pm: Erosion perimeter; W.Th: Wall thickness; L.Th: Lamellar thickness.
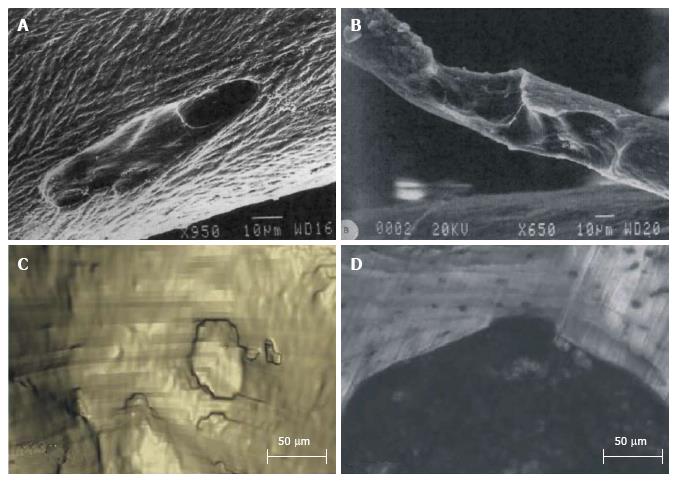
Figure 2 Three-dimensional visualizations of resorption cavities.
Using scanning electron microscope (A, B) reprinted from [37] and serial milling (C: Three-dimensional reconstruction; D: Corresponding cross section image) reprinted from [38].
- Citation: Vanderoost J, Lenthe GHV. From histology to micro-CT: Measuring and modeling resorption cavities and their relation to bone competence. World J Radiol 2014; 6(9): 643-656
- URL: https://www.wjgnet.com/1949-8470/full/v6/i9/643.htm
- DOI: https://dx.doi.org/10.4329/wjr.v6.i9.643


