©2014 Baishideng Publishing Group Inc.
World J Radiol. Jun 28, 2014; 6(6): 274-283
Published online Jun 28, 2014. doi: 10.4329/wjr.v6.i6.274
Published online Jun 28, 2014. doi: 10.4329/wjr.v6.i6.274
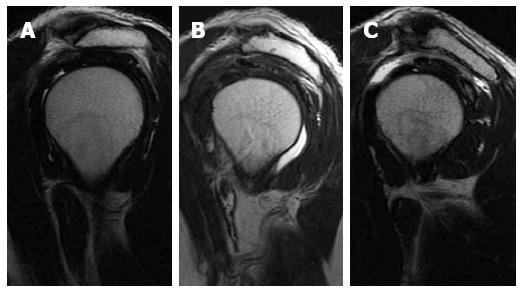
Figure 1 Acromion types.
Sagittal oblique T2-weighted images of different patients showing type I flat acromion (A), type II concave under surface (B) and type III concave under surface with anterior hook (C).
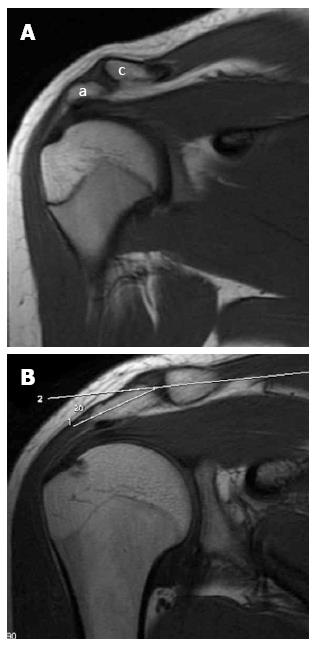
Figure 2 Acromion orientation.
A: Coronal oblique T1-weighted image shows low lying acromion (a) in relation to the clavicle (c) at the Acromio-clavicular joint level; B: Coronal oblique T1-weighted image in another patient shows infero-lateral slope of the acromion. The angle between the acromion and the clavicle is tilted by 20 degrees.
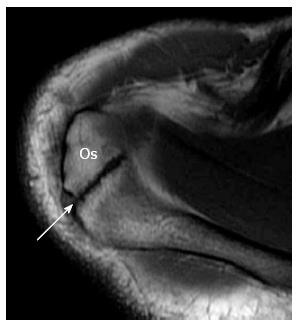
Figure 3 Os acromiale.
Axial T1-weighted image showing the os acromiale.
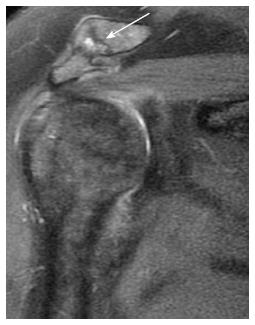
Figure 4 Acromio-clavicular joint osteoarthritis.
Coronal oblique fat-sat proton-density-weighted image shows degenerative changes of the acromio-clavicular joint (arrow) in a patient with rotator cuff tear.
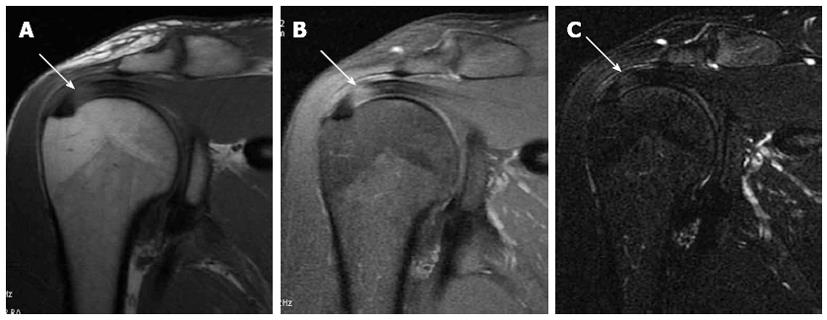
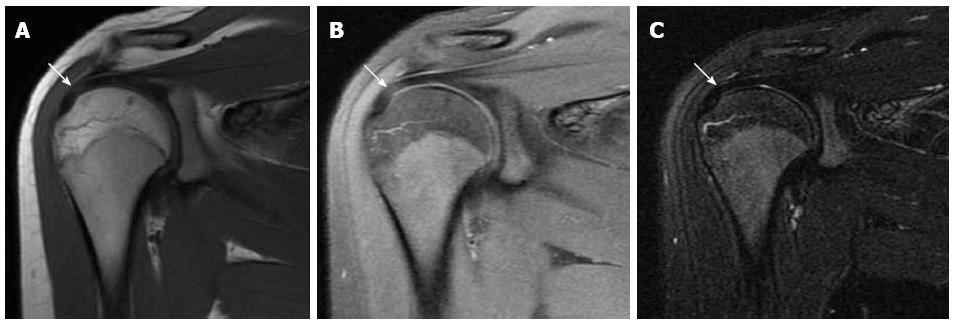
Figure 5 Supraspinatus tendinosis.
A: Coronal oblique T1-weighted image. B: Coronal oblique fat-sat proton-density image. Images (A) and (B) show focal high signal intensity within the distal supraspinatus tendon (arrow); C: Coronal oblique fat-sat T2-weighted image shows focal high signal at the same site within supraspinatus tendon (arrow). Final diagnosis was tendinosis.
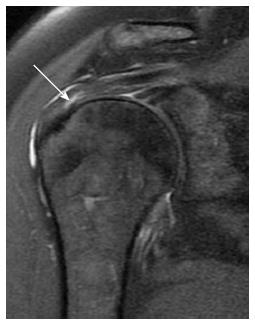
Figure 6 Partial interstitial supraspinatus tendon tear.
Coronal oblique fat-sat proton-density-weighted image showing focal high signal within the supraspinatus tendon fibres (arrow). Also note the associated high signal intensity fluid in the subacromial subdeltoid bursa.
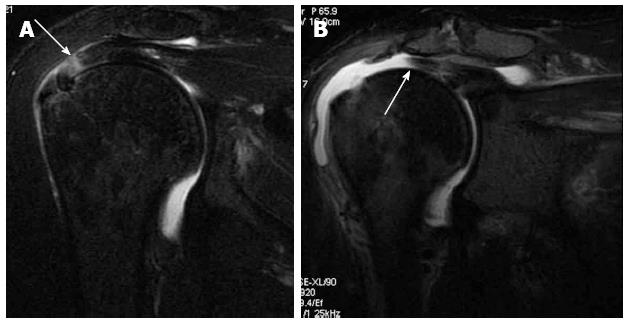
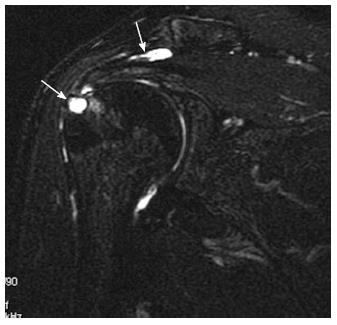
Figure 7 Full-thickness supraspinatus tendon tears in two different patients.
A: Coronal oblique fat-sat T2-weighted image shows full-thickness supraspinatus tendon tear without significant tendinous retraction (arrow); B: Coronal oblique fat-sat T2-weighted image in another patient shows torn retracted supraspinatus tendon (arrow).
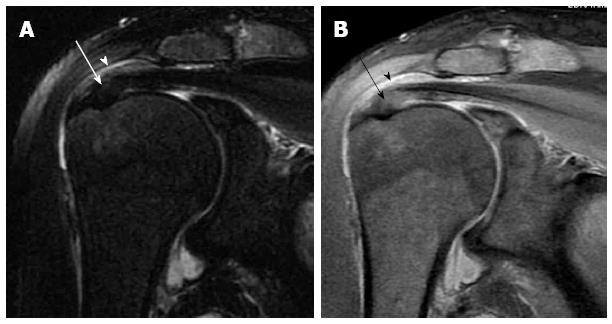
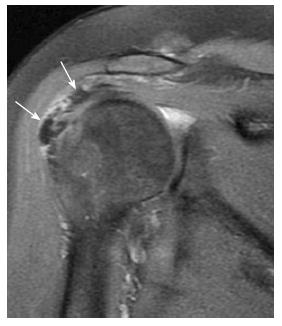
Figure 8 Subacromial impingement.
A: Coronal oblique fat-sat T2-weighted image; B: Coronal oblique fat-sat proton-density-weighted image. Both images show findings associated with subacromial impingement in the form of osteoarthritis of the acromio-clavicular joint, distended subacromial subdeltoid bursa by fluid signal (arrowhead) and focal thickening of the distal supraspinatus tendon with partial irregularity of the bursal surface reported as partial tear (arrow).
Figure 9 Magic angle artifact.
A: Coronal oblique T1-weighted image. B: Coronal oblique fat-sat proton-density image. Images (A) and (B) show focal high signal intensity within the distal supraspinatus tendon (arrow); C: Coronal oblique fat-sat T2-weighted image shows normal signal of the supraspinatus tendon (arrow). Final diagnosis was magic angle artifact with normal tendon.
Figure 10 Infraspinatus tendinosis.
Posterior coronal oblique fat-sat proton-density-weighted image showing focal thickening of the infraspinatus tendon fibres with abnormal high signal diagnosed as tendinosis (arrow). Also note fluid signal within the subacromial subdeltoid bursa.
Figure 11 Subscapularis tendinosis.
A: Axial gradient-recalled echo image showing focal high signal within the subscapularis tendon with fibres thickening (arrow); B: Anterior coronal oblique fat-sat T2-weighted image of the same patient showing high signal within the lower fibres of the subscapularis tendon (arrow).
Figure 12 Sub-coracoid impingement.
A and C: Axial gradient-recalled echo images; B: Axial T1-weighted image showing narrowed coraco-humeral distance (arrows in A) with tapered coracoid process, thickening and abnormal high signal of the subscapularis tendon (asterisk in C).
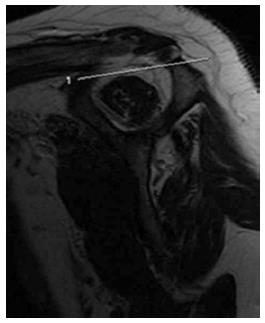
Figure 13 Supraspinatus muscle atrophy, tangent sign.
Sagittal oblique T1-weighted image showing the upper border of supraspinatus muscle below the line extending between the scapular plate and spine.
Figure 14 Subscapularis tendon avulsion with long head of biceps tendon dislocation.
A: Axial T1-weighed image; B: Axial gradient-recalled echo image; C: Coronal oblique T1-weighted images showing avulsion of the subscapularis tendon (asterisk in B) with muscular atrophy and long head biceps tendon dislocation (arrows) with diffuse tendinous thickening and high signal.
Figure 15 Calcific tendinopathy.
Coronal oblique fat-sat proton-density-weighted image showings focal area of signal void (calcifications) within the distal supraspinatus tendon fibres (arrows). Diagnosis was confirmed by ultrasonography.
Figure 16 Bony degenerative changes.
Coronal oblique fat-sat T2-weighted image showing focal fluid-like high signal within the distal supraspinatus tendon fibres reported as partial capsular surface tear with subcortical cystic erosion of the greater tuberosity at the rotor cuff insertion (thin arrow). Also note fluid signal within the subacromial subdeltoid bursa reported as bursitis (thick arrow).
- Citation: Tawfik AM, El-Morsy A, Badran MA. Rotator cuff disorders: How to write a surgically relevant magnetic resonance imaging report? World J Radiol 2014; 6(6): 274-283
- URL: https://www.wjgnet.com/1949-8470/full/v6/i6/274.htm
- DOI: https://dx.doi.org/10.4329/wjr.v6.i6.274


