Copyright
©2014 Baishideng Publishing Group Inc.
World J Radiol. May 28, 2014; 6(5): 192-202
Published online May 28, 2014. doi: 10.4329/wjr.v6.i5.192
Published online May 28, 2014. doi: 10.4329/wjr.v6.i5.192
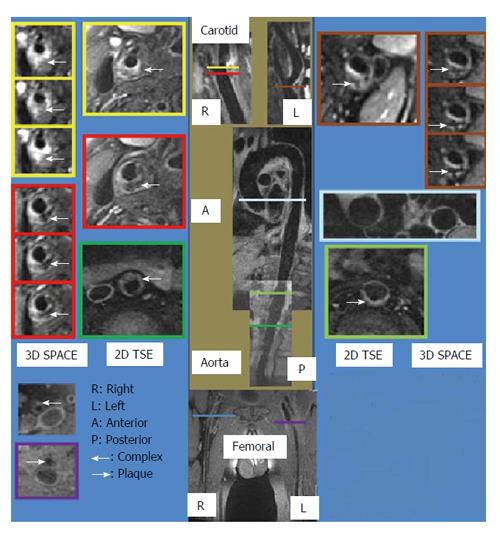
Figure 1 Sample magnetic resonance images obtained from the three vascular beds using both three-dimensional SPACE and two-dimensional turbo spin echo sequences.
Montage showing samples from the two-dimensional (2D) and 3D black blood vessel wall image acquisitions of the carotids, aorta and femoral arteries acquired in a single session (longitudinal sections in the middle, cross sections on each side). Imaging time < 45 min for 3D acquisitions.
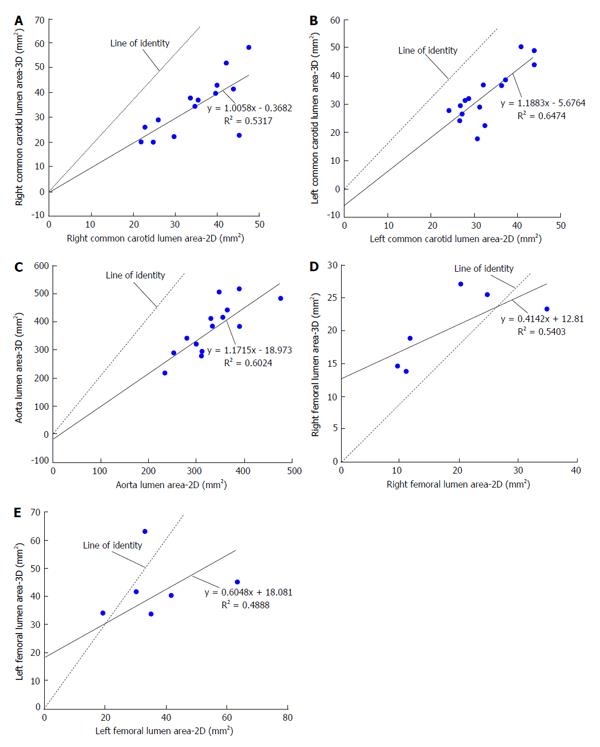
Figure 2 Scatter plots of lumen area comparing three-dimensional SPACE and two-dimensional turbo spin echo images.
Morphometric analysis using a FDA-approved, customized software program (QPlaque MR, Medis medical imaging systems, The Netherlands) was performed on all carotid, aortic and femoral arterial wall images of 16 patients who were at risk for cardiovascular or atherosclerotic disease for three-dimensional (3D) SPACE and conventional 2D multi contrast turbo spin echo (TSE) sequences. A: Scatter plot of RCC lumen area comparing 3D SPACE and 2D TSE images. There was a moderate positive linear correlation (R = 0.729) between the values of the RCC lumen area obtained from the 3D SPACE and 2D TSE sequences; B: Scatter plot of LCC lumen area comparing 3D SPACE and 2D TSE images. There was a strong positive linear correlation (R = 0.805) between the values of the LCC lumen area obtained from the 3D SPACE and 2D TSE sequences; C: Scatter plot of aorta lumen area comparing 3D SPACE and 2D TSE images. There was a strong positive linear correlation (R = 0.776) between the values of the aorta lumen area obtained from the 3D SPACE and 2D TSE sequences; D: Scatter plot of RF lumen area comparing 3D SPACE and 2D TSE images. There was a moderate positive linear correlation (R = 0.735) between the values of the RF lumen area obtained from the 3D SPACE and 2D TSE sequences; E: Scatter plot of LF lumen area comparing 3D SPACE and 2D TSE images. There was a moderate positive linear correlation (R = 0.699) between the values of the LF lumen area obtained from the 3D SPACE and 2D TSE sequences. RCC: Right common carotid; LCC: Left common carotid; RF: Right femoral; LF: Left femoral.
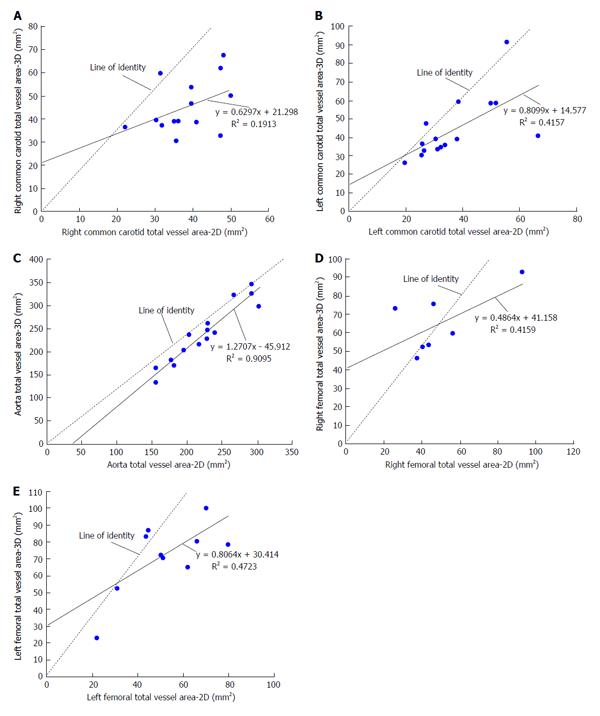
Figure 3 Scatter plots of total vessel area comparing three-dimensional SPACE and two-dimensional turbo spin echo images.
A morphometric analysis using a FDA-approved, customized software program (QPlaque MR, Medis medical imaging systems, The Netherlands) was performed on all carotid, aortic and femoral arterial wall images of 16 patients who were at risk for cardiovascular or atherosclerotic disease for three-dimensional (3D) SPACE and conventional 2D multi contrast turbo spin echo (TSE) sequences. A: Scatter plot of right common carotid (RCC) total vessel area comparing 3D SPACE and 2D TSE images. There was a moderate positive linear correlation (R = 0.437) between the values of the RCC total vessel area obtained from the 3D SPACE and 2D TSE sequences; B: Scatter plot of left common carotid (LCC) total vessel area comparing 3D SPACE and 2D TSE images. There was a moderate positive linear correlation (R = 0.645) between the values of the LCC total vessel area obtained from the 3D SPACE and 2D TSE sequences; C: Scatter plot of aorta total vessel area comparing 3D SPACE and 2D TSE images. There was a strong positive linear correlation (R = 0.954) between the values of the aorta total vessel area obtained from the 3D SPACE and 2D TSE sequences; D: Scatter plot of right femoral (RF) total vessel area comparing 3D SPACE and 2D TSE images. There was a moderate positive linear correlation (R = 0.645) between the values of the RF total vessel area obtained from the 3D SPACE and 2D TSE sequences; E: Scatter plot of left femoral (LF) total vessel area comparing 3D SPACE and 2D TSE images. There was a moderate positive linear correlation (R = 0.687) between the values of the LF total vessel area obtained from the 3D SPACE and 2D TSE sequences.
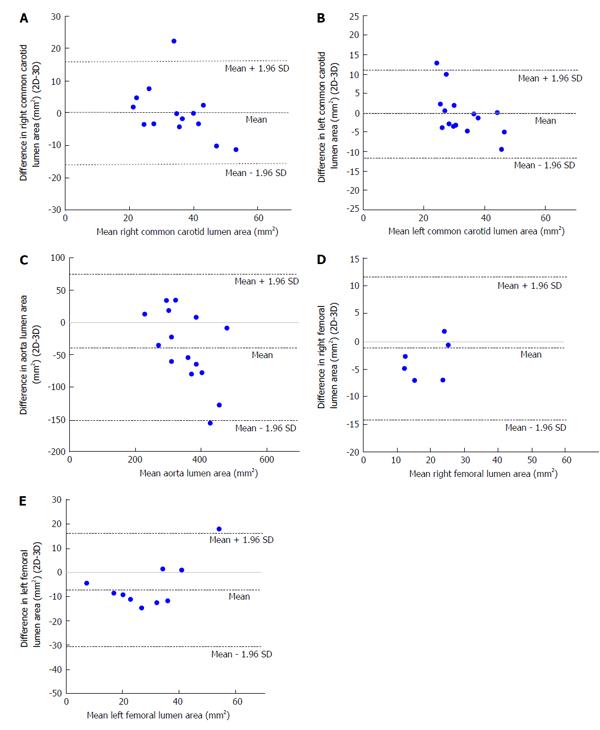
Figure 4 Bland-Altman plot of differences in lumen area (two-dimensional-three-dimensional) vs means of lumen area.
A: Bland-Altman plot of difference in right common carotid (RCC) lumen area [two-dimensional (2D)-3D] vs mean RCC lumen area. Bland-Altman plot showing that the mean of the difference in RCC lumen area between 2D and 3D techniques falls on the zero line indicating that there is no bias and that the two methods are producing the same results; B: Bland–Altman plot of difference in left common carotid (LCC) lumen area (2D-3D) vs mean LCC lumen area. Bland-Altman plot showing that the mean of the difference in LCC lumen area between 2D and 3D techniques falls close to the zero line indicating that there is no bias and that in general the two methods are producing the same results; C: Bland-Altman plot of difference in aorta lumen area (2D-3D) vs mean aorta lumen area. Bland-Altman plot showing that the mean of the difference in aorta lumen area between 2D and 3D techniques falls below the zero line indicating that there is a bias and that the two methods are not producing the same results; D: Bland-Altman plot of difference in right femoral (RF) lumen area (2D-3D) vs mean RF lumen area. Bland-Altman plot showing that the mean of the difference in RF lumen area between 2D and 3D techniques falls below the zero line indicating that there is a bias and that the two methods are not producing the same results; E: Bland-Altman plot of difference in left femoral (LF) lumen area (2D-3D) vs mean LF lumen area. Bland-Altman plot showing that the mean of the difference in LF lumen area between 2D and 3D techniques falls below the zero line indicating that there is a bias and that the two methods are not producing the same results.
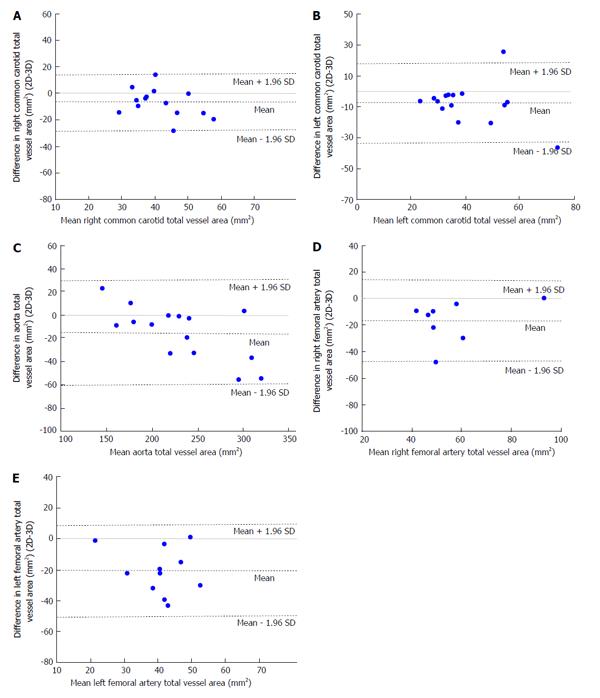
Figure 5 Bland-Altman plot of differences in total vessel area (two-dimensional-three-dimensional) vs means of total vessel area.
A: Bland-Altman plot of difference in right common carotid (RCC) total vessel area [two-dimensional (2D)-3D] vs mean RCC total vessel area. Bland-Altman plot showing that the mean of the difference in RCC total vessel area between 2D and 3D techniques falls below the zero line indicating that there is a bias and that the two methods are not producing the same results; B: Bland-Altman plot of difference in left common carotid (LCC) total vessel area (2D-3D) versus mean LCC total vessel area. Bland-Altman plot showing that the mean of the difference in LCC total vessel area between 2D and 3D techniques falls below the zero line indicating that there is a bias and that the two methods are not producing the same results; C: Bland-Altman plot of difference in aorta total vessel area (2D-3D) vs mean aorta total vessel area. Bland-Altman plot showing that the mean of the difference in aorta total vessel area between 2D and 3D techniques falls below the zero line indicating that there is a bias and that the two methods are not producing the same results; D: Bland-Altman plot of difference in right femoral (RF) total vessel area (2D-3D) vs mean RF total vessel area. Bland-Altman plot showing that the mean of the difference in RF total vessel area between 2D and 3D techniques falls below the zero line indicating that there is a bias and that the two methods are not producing the same results; E: Bland-Altman plot of difference in left femoral (LF) total vessel area (2D-3D) vs mean LF total vessel area. Bland-Altman plot showing that the mean of the difference in LF total vessel area between 2D and 3D techniques falls below the zero line indicating that there is a bias and that the two methods are not producing the same results.
-
Citation: Wong SK, Mobolaji-Iawal M, Arama L, Cambe J, Biso S, Alie N, Fayad ZA, Mani V. Atherosclerosis imaging using 3D black blood TSE SPACE
vs 2D TSE. World J Radiol 2014; 6(5): 192-202 - URL: https://www.wjgnet.com/1949-8470/full/v6/i5/192.htm
- DOI: https://dx.doi.org/10.4329/wjr.v6.i5.192


