©2014 Baishideng Publishing Group Inc.
World J Radiol. May 28, 2014; 6(5): 177-191
Published online May 28, 2014. doi: 10.4329/wjr.v6.i5.177
Published online May 28, 2014. doi: 10.4329/wjr.v6.i5.177
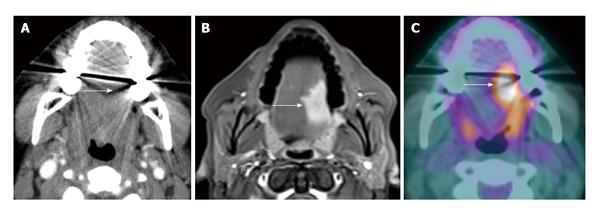
Figure 1 Dental amalgam artifact obscuring an oral cavity tumor.
A: The T2 left lateral oral tongue squamous cell carcinoma (arrow) was obscured by the dental amalgam artifact on contrast-enhanced computed tomography (CT); B: The lesion is better evaluated on the contrast-enhanced T1W; C: Positron emission tomography/CT (PET/CT) images. Information from the PET portion is clearly less affected by streak artifact. However, PET/CT does not add additional information to magnetic resonance imaging in terms of primary oral cavity lesion extent for the majority of cases.
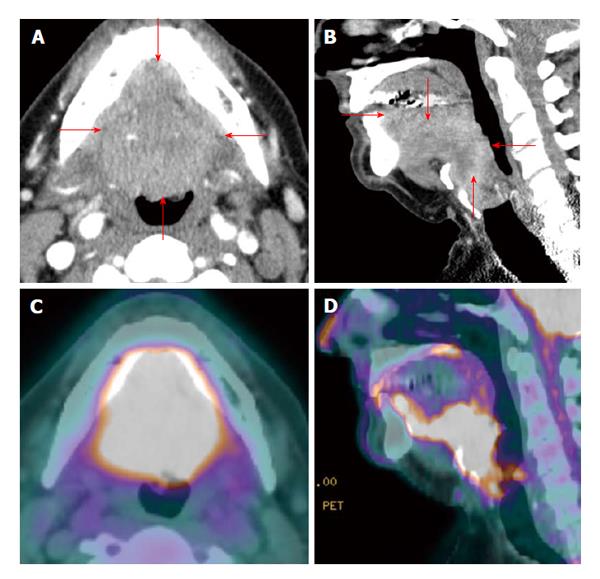
Figure 2 Positron emission tomography/computed tomography for delineation of oral cavity tumor extent.
A T4a oral and base of tongue squamous cell carcinoma (red arrows) diffusely and symmetrically infiltrates the ventral aspect of the tongue, whose margins are difficult to appreciate on contrast enhanced computed tomography (CT) (A and B). On the other hand, positron emission tomography/CT (PET/CT) (C and D) clearly demarcates the tumor extent.
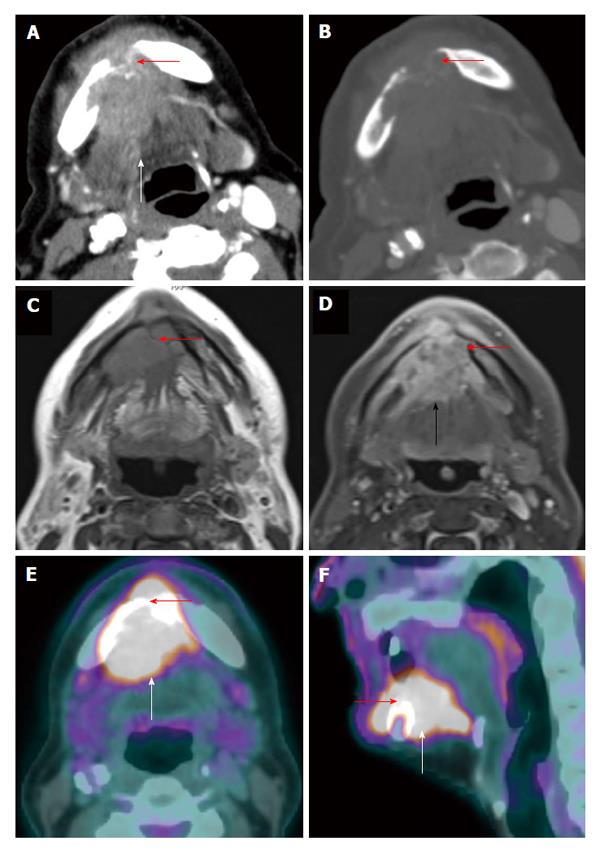
Figure 3 Positron emission tomography/computed tomography for detection of mandibular invasion.
A T4a floor of mouth squamous cell carcinoma (white arrow) with through-and-through involvement (red arrow) of the anterior mandible is demonstrated on axial contrast-enhanced computed tomography (CT) (A: Soft tissue window; B: Bone window), axial contrast-enhanced magnetic resonance imaging (C: T1WI; D: Post contrast enhanced T1WI with fat saturation), and positron emission tomography/CT (E: Axial; F: Sagittal).
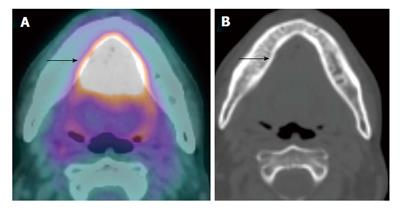
Figure 4 Shine-through artifact on positron emission tomography/computed tomography.
A T4a floor of mouth squamous cell carcinoma (arrow) appeared to extend to involve the lingual cortex of the mandible seen on positron emission tomography/computed tomography (CT) (A), which is in fact artifactual. The corresponding CT (B) bone window and intraoperative findings confirmed an intact mandibular cortex.
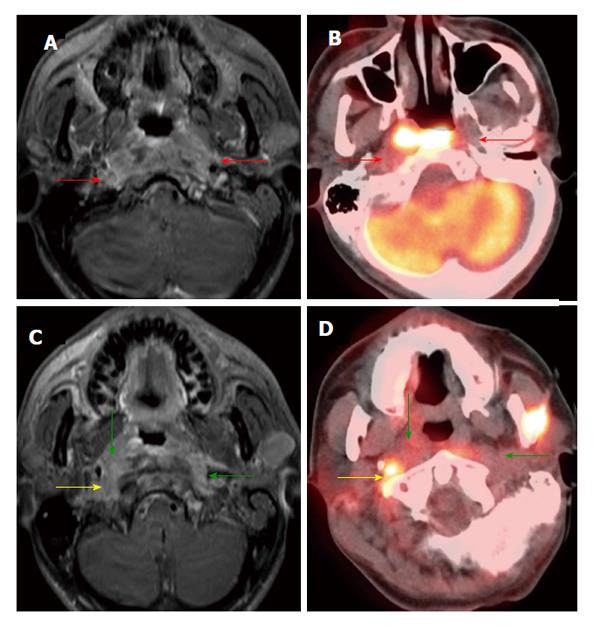
Figure 5 Positron emission tomography/computed tomography underestimates size and extension of the nasopharyngeal carcinoma and retropharyngeal lymph nodes compared to magnetic resonance imaging.
The approximate lateral extension (red arrows) of the nasopharyngeal carcinoma is well demarcated on magnetic resonance imaging (MRI) (A). The tumor appears to be smaller on positron emission tomography/computed tomography (CT) (B) as compared to MRI because the lateral portion of the tumor is hypometabolic. Inferior to the primary tumor site, there is metastatic bilateral retropharyngeal lymphadenopathy (yellow and green arrows). The full extent of retropharyngeal lymph node involvement is better assessed by MRI (C) than CT (D). Only the right lateral retropharyngeal node is FDG avid.
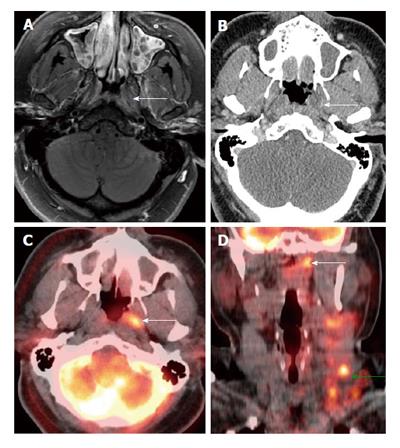
Figure 6 Positron emission tomography/computed tomography for detection of small submucosal nasopharyngeal carcinoma when computed tomography and magnetic resonance imaging are unrevealing in a patient presenting with metastatic cervical lymphadenopathy.
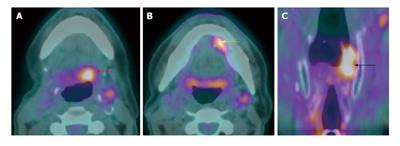
Endoscopy was unremarkable. There was slight enhancement in the left side of the nasopharynx (white arrows) seen on magnetic resonance imaging (A) without abnormality on computed tomography (CT) (B). Positron emission tomography/CT (PET/CT) (C and D) revealed a focal hypermetabolic region in the left side of the nasopharynx (white arrows), suspicious for a submucosal tumor. Hypermetabolic left-sided cervical lymphadenopathy was also noted (green arrow). Biopsy revealed squamous cell carcinoma at the site of hypermetabolic activity in the left nasopharynx directed by PET/CT.
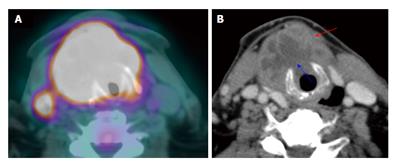
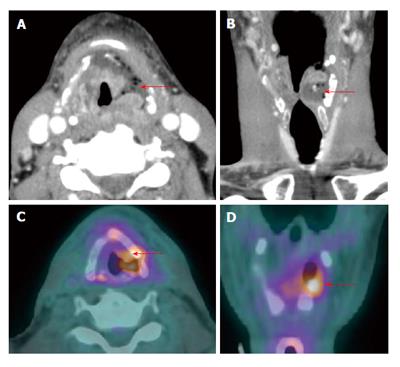
Figure 7 Laryngeal cartilage invasion.
A large T4a squamous cell carcinoma of the larynx with through-and-through cricoid cartilage invasion (blue arrow) and extralaryngeal invasion (red arrow) demonstrated on both positron emission tomography/computed tomography (CT) (A) and contrast-enhanced CT (B).
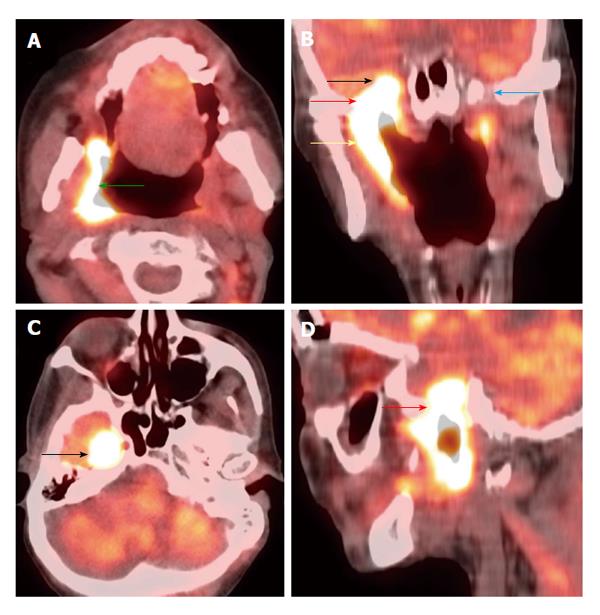
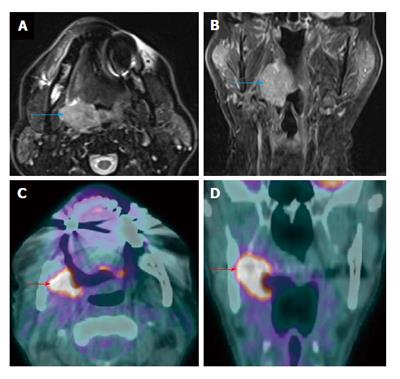
Figure 8 Perineural spread.
Positron emission tomography/computed tomography (A: Axial; B: Coronal; C: Axial; D: Sagittal) demonstrates a T4b right oropharyngeal squamous cell carcinoma (green arrow) spreading along the mandibular branch of the trigeminal nerve (yellow arrow) through the right foramen ovale (red arrows) to involve the right cavernous sinus (black arrows). The left mandibular nerve in the foramen ovale is normal (blue arrow).
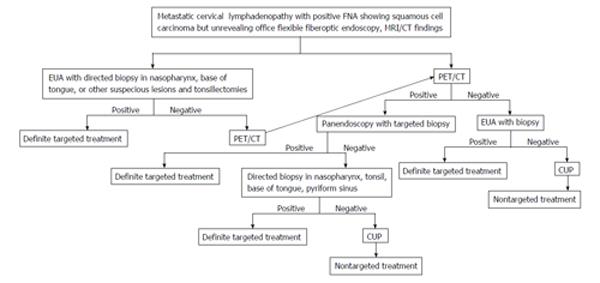
Figure 9 Algorithm in diagnosis and management of carcinoma of unknown primary.
MRI: Magnetic resonance imaging; PET/CT: Positron emission tomography/computed tomography; CUP: Carcinoma of unknown primary.
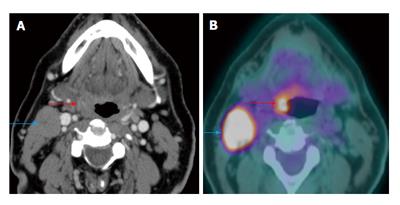
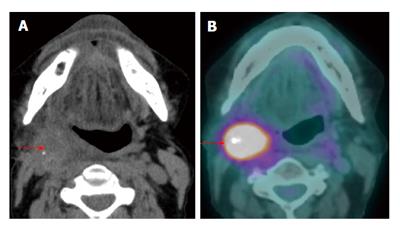
Figure 10 Carcinoma of unknown primary.
The patient presented with palpable right level IIa lymphadenopathy (blue arrows). Fine needle aspiration of the lymph node was positive for squamous cell carcinoma. Panendoscopy without biopsy and contrast-enhanced computed tomography (CT) (A) were unremarkable. Positron emission tomography/CT (B) showed a small hypermetabolic area in the right palatine tonsil (red arrows) proven to be squamous cell carcinoma by biopsy.
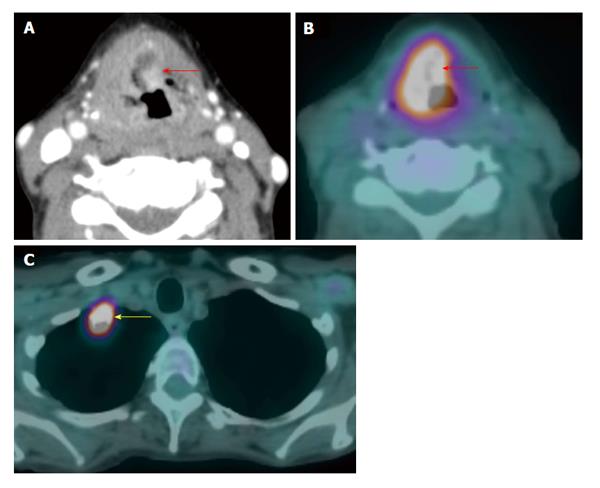
Figure 11 Synchronous second primary malignancy in the lung.
A T4a supraglottic squamous cell carcinoma (red arrows) with extralaryngeal invasion is well demonstrated on computed tomography (CT) (A) and positron emission tomography/CT (B). There is a 3-cm hypermetabolic second primary squamous cell carcinoma (yellow arrow) in the right lung apex, discovered at the same time in this patient who had an extensive smoking and drinking history. The rest of the exam is unremarkable.
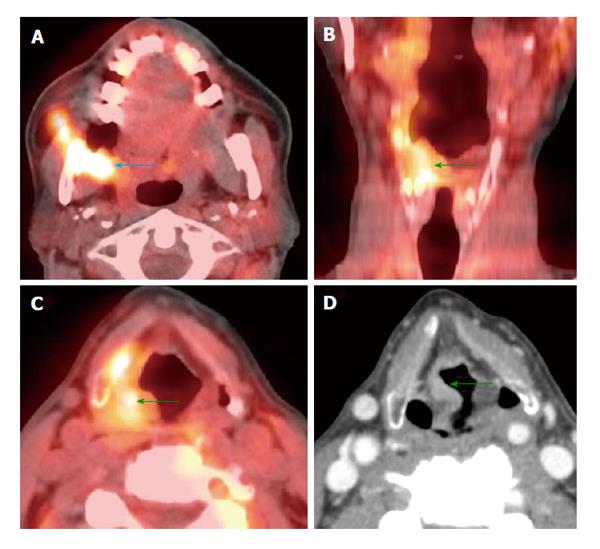
Figure 12 Synchronous second primary malignancy in the head and neck region.
A T4b right retromolar trigone squamous cell carcinoma involving the masticator space (blue arrow) was seen on positron emission tomography/computed tomography (PET/CT) (A). There was another second primary tumor in the right aryepiglottic fold (green arrows) causing no symptoms, demonstrated by both PET/CT (B and C) and contrast-enhanced CT (D).
Figure 13 Hypometabolic necrotic lymph node.
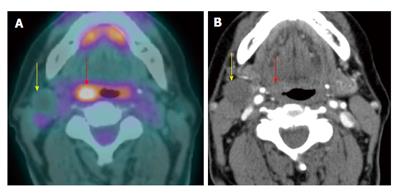
A T1N1M0 right glossopharyngeal sulcus squamous cell carcinoma (red arrow) is FDG avid on positron emission tomography/computed tomography (PET/CT) (A). There is a 1.7-cm necrotic right level IIa lymph node seen on contrast-enhanced CT (B). The necrotic lymph node is hypometabolic and may potentially cause a false negative result if the CT portion of the PET/CT or corresponding contrast-enhanced CT were not correlated.
Figure 14 Lung metastasis at initial staging.
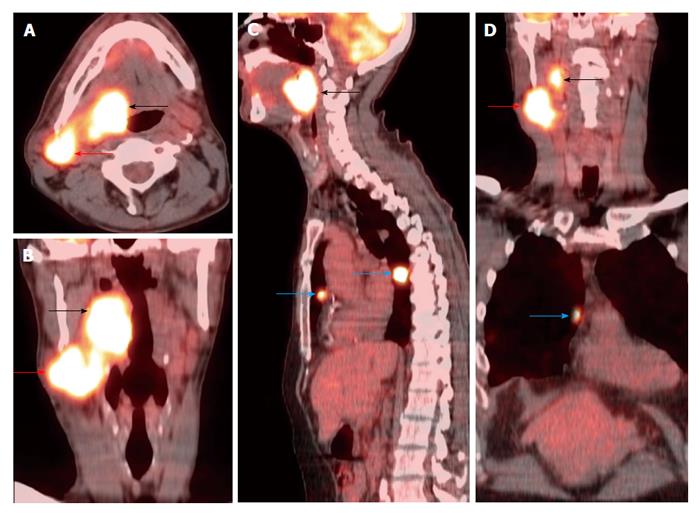
A T3N2bM1 right base of tongue squamous cell carcinoma (black arrows) was FDG avid on positron emission tomography/computed tomography (A-D) with metastasis to the right level IIa (red arrows) and lung (blue arrows).
Figure 15 Complete treatment response at the primary tumor site.
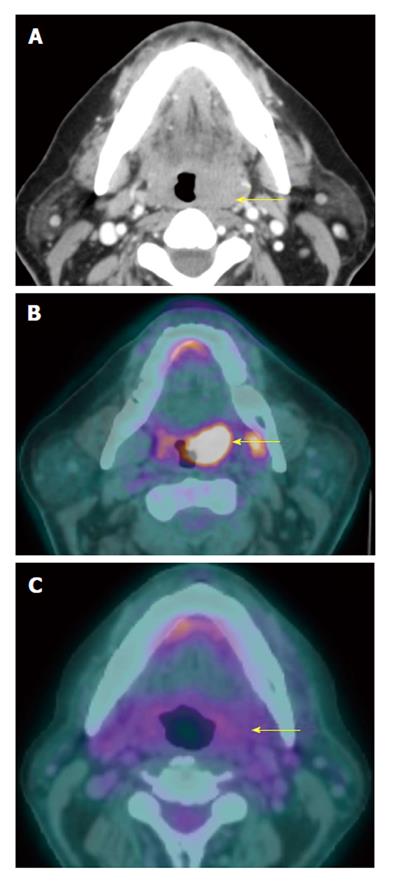
A T2N0M0 oral tongue squamous cell carcinoma (yellow arrow) seen on contrast-enhanced computed tomography (CT) (A) and positron emission tomography/CT (PET/CT) (B) showed complete response after 3 mo of chemoradiation demonstrated on PET/CT (C). The tumor is no longer hypermetabolic. The patients remained disease free for 3 years, proving true negative result of PET/CT.
Figure 16 Complete response of a metastatic lymph node.
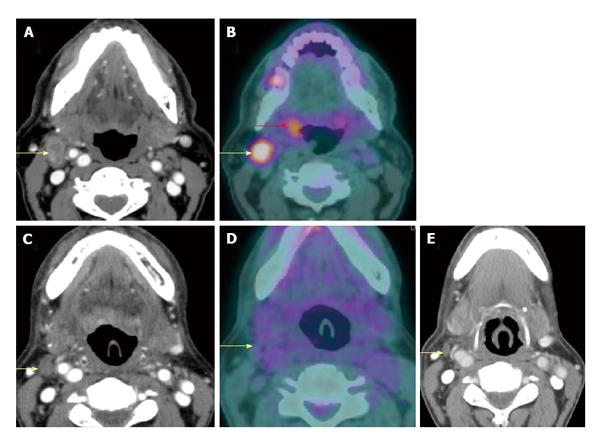
A T2N2bM0 right palatine tonsil squamous cell carcinoma (red arrow) and right level IIa metastatic lymph node (yellow arrows) were seen on both contrast-enhanced computed tomography (CT) (A) and positron emission tomography/CT (PET/CT) (B). After chemoradiation, the node was smaller on contrast-enhanced CT at 6 wk (C) and hypometabolic on PET/CT at 4 mo (D), representing complete response to treatment. Negative physical examination and PET/CT at 1 year (E) confirmed true negative result of the PET/CT performed at 4 mo.
Figure 17 False positive positron emission tomography/computed tomography result due to post treatment infection.
A T3N0M0 left supraglottic squamous cell carcinoma showed edema and necrosis at the tumor site (red arrows) on contrast-enhanced computed tomography (CT) (A and B) at 5 wk after chemoradiation and increased uptake on positron emission tomography/CT (PET/CT) (C and D) at 10 wk. The patient had severe throat pain and fever. A residual tumor can not be excluded, therefore endoscopy with biopsy was performed showing radiation-induced inflammation, tumor necrosis and superimposed actinomycosis causing a false positive result on PET/CT. Due to lack of viable tumor, no salvage surgery was performed. The patient was disease free at two-year follow up.
Figure 18 Recurrent primary tumor detected by positron emission tomography/computed tomography.
A T3N0M0 right palatine tonsil squamous cell carcinoma was demonstrated on axial T2W magnetic resonance imaging (MRI) (blue arrow) (A) and coronal contrast-enhanced T1W MRI (B). MRI and positron emission tomography/computed tomography (PET/CT) performed 2 and 3 mo after completion of chemoradiation demonstrated complete treatment response (not shown). Surveilance PET/CT (C and D) revealed intense increase metabolism in the right palatine tonsil and medial pterygoid muscle (red arrows) representing a recurrent squamous cell carcinoma.
Figure 19 Recurrent nodal disease.
A T2N1M0 right hypopharyngeal squamous cell carcinoma status post completed chemoradiation 2.5 years ago with complete response (not shown). The patient presented with right sided level II lymphadenopathy. Computed tomography (CT) without contrast (A) showed an ill-defined mass in the right level II. Positron emission tomography/CT (PET/CT) (red arrow) (B) demonstrated very intense metabolism in the mass. Biospy confirmed a recurrent squamous cell carcinoma in the right level IIa node.
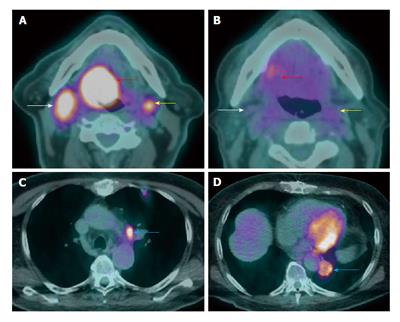
Figure 20 Failure of treatment due to distant metastasis.
A T4aN2cM0 right base of tongue squamous cell carcinoma (red arrow) with bilateral level IIa metastatic lymphadenopathy (white and yellow arrows) seen on positron emission tomography/computed tomography (PET/CT) at initial staging (A and B). The patient received chemoradiation. PET/CT (C and D) performed at 3 mo after treatment showed new lung metastases (blue arrow).
Figure 21 Metachronous second primary tumor.
A T1N0M0 left floor of mouth squamous cell carcinoma (SCC) (not shown) s/p wide local excision with primary closure and selective neck dissection 3 yr ago. Surveilance positron emission tomography/computed tomography (A-C) showed a recurent SCC at left floor of mouth (yellow arrow) and two metachronous second primaries at the left hypopharyngx (black arrow) and left base of tongue (red arrow).
- Citation: Tantiwongkosi B, Yu F, Kanard A, Miller FR. Role of 18F-FDG PET/CT in pre and post treatment evaluation in head and neck carcinoma. World J Radiol 2014; 6(5): 177-191
- URL: https://www.wjgnet.com/1949-8470/full/v6/i5/177.htm
- DOI: https://dx.doi.org/10.4329/wjr.v6.i5.177


