©2014 Baishideng Publishing Group Co.
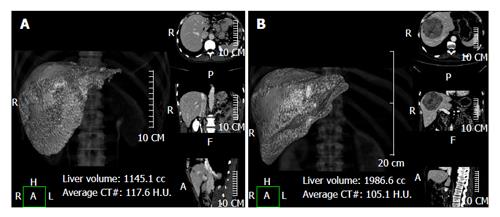
Figure 1 Using a semi-automatic method liver analysis application provides a 3D and a multi-planar reconstruction of the liver.
A case of hilar cholangiocarcinoma involving the left hepatic duct, with marked hypotrophy of the left lobe (type IIIb according to the Bismuth-Corlette classification) (A) and a case of hepatocarcinoma in segments 4-5-8 (B) are shown.
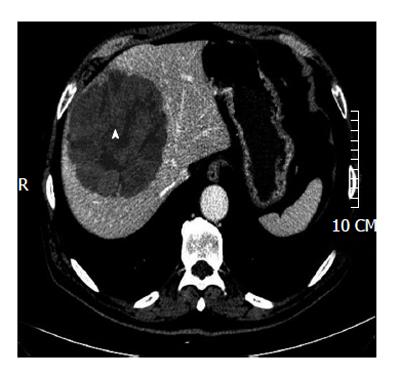
Figure 2 For intra-hepatic masses the manual segmentation of the lesion is needed.
A huge hepatocarcinoma (arrowhead) in segments 4-8-5 is shown.
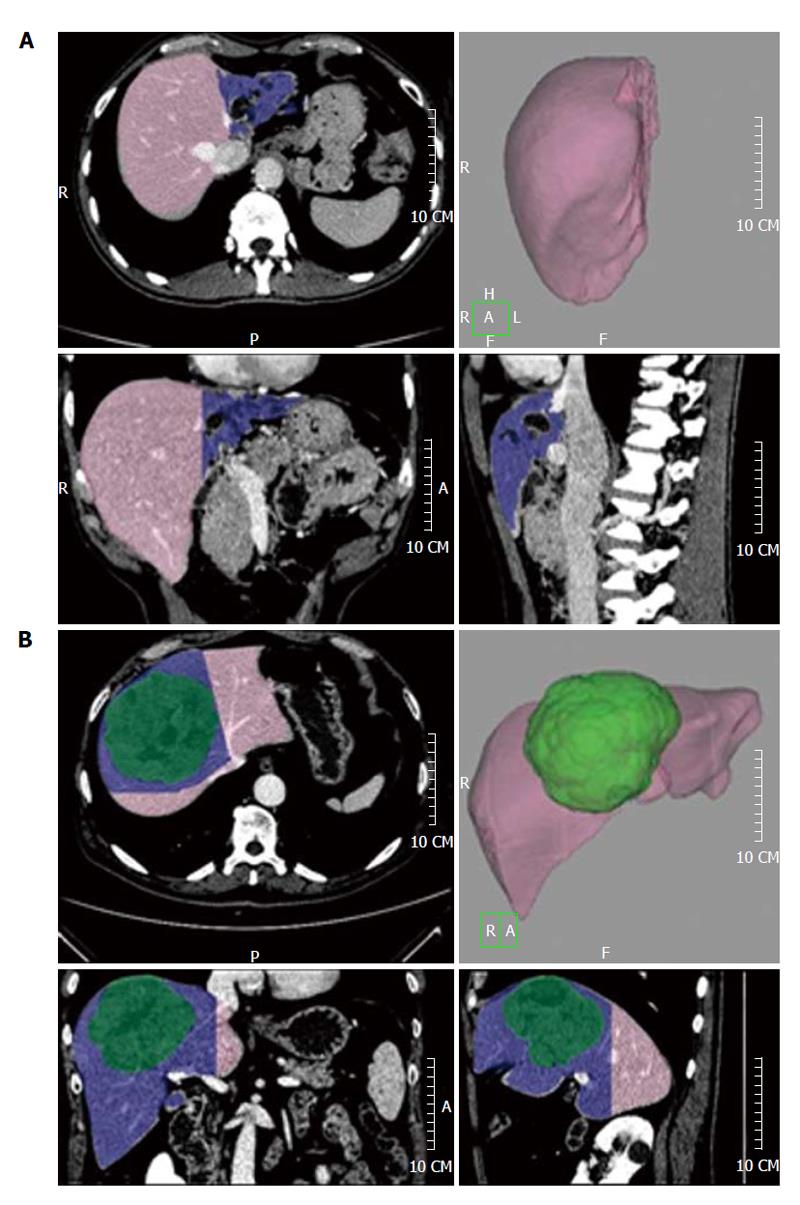
Figure 3 The future liver remnant volume is shown in pink, while the resection volume is shown in blue.
A left hepatectomy for a hilar cholangiocarcinoma involving the left hepatic duct (A) and a mesohepatectomy (resection of liver segments 4-8-5) for a hepatocarcinoma (shown in green, B) are shown.
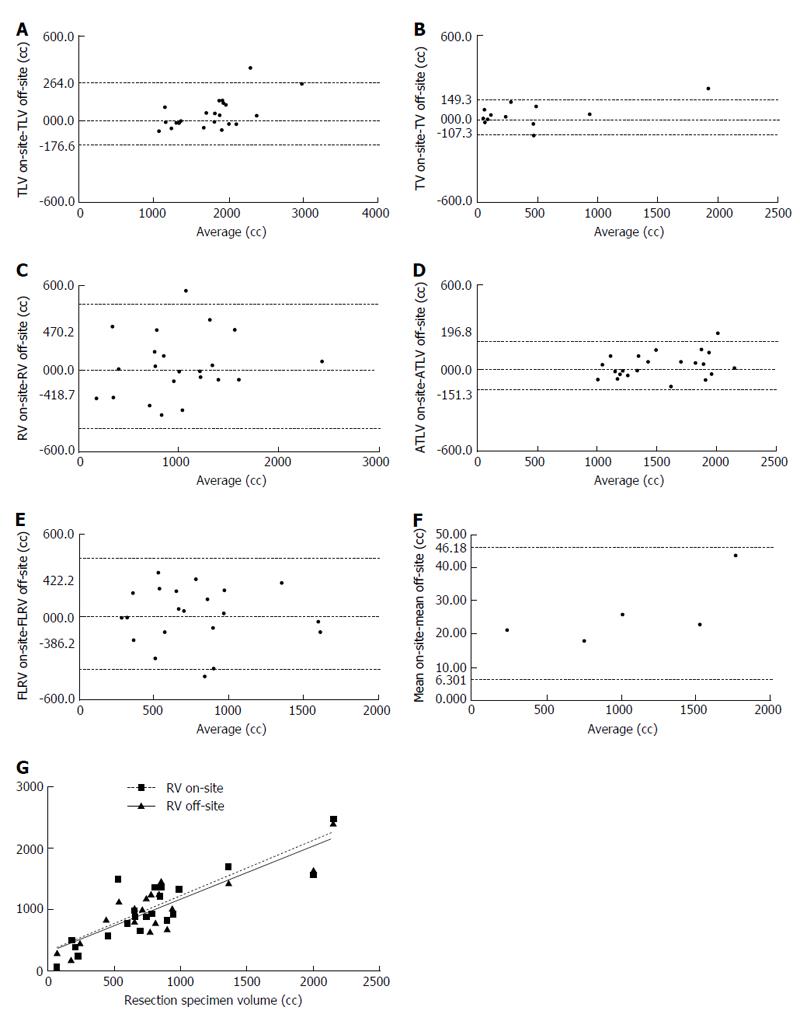
Figure 4 Bland-Altman graphs plotting the mean against the difference for total liver volume (A), tumor volume (B), resection volume (C), actual total liver volume (D), future liver remnant volume (E), and overall mean (F) with the two measurement methods; the correlation lines for the comparison between the resection volume and the actual volume of the resection specimens obtained with Pearson’s correlation test are shown in (G).
TLV: Total liver volume; TV: Tumor volume; RV: Resection volume; ATLV: Actual total liver volume; FLRV: Future liver remnant volume.
- Citation: D’Onofrio M, De Robertis R, Demozzi E, Crosara S, Canestrini S, Pozzi Mucelli R. Liver volumetry: Is imaging reliable? Personal experience and review of the literature. World J Radiol 2014; 6(4): 62-71
- URL: https://www.wjgnet.com/1949-8470/full/v6/i4/62.htm
- DOI: https://dx.doi.org/10.4329/wjr.v6.i4.62


