©2014 Baishideng Publishing Group Co.
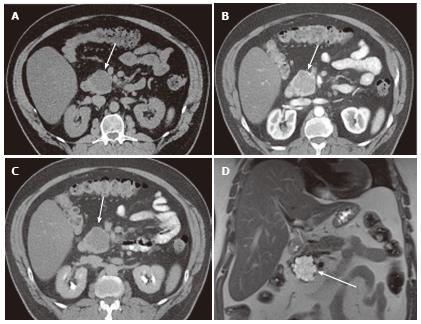
Figure 1 A 65-year-old male with clinically diagnosed typical microcystic serous cystic neoplasm.
A: Unenhanced axial computed tomography (CT) shows a low density mass (arrow) relative to the pancreatic head; B: The pancreatic parenchymal phase of a contrast-enhanced CT shows mild patchy tumor enhancement (arrow); C: The equilibrium phase shows the mass to be low density (arrow); D: Coronal T2-weighted single-shot fat saturation-echo magnetic resonance image clearly demonstrate the mass (arrow) consisting of a cluster of microcysts (honeycomb pattern).
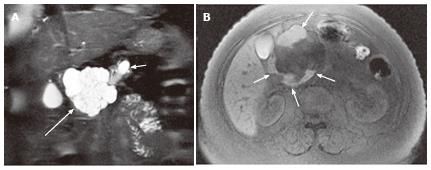
Figure 2 A 57-year-old female with mixed microcystic and macrocystic serous cystic neoplasm.
A: Coronal T2-weighted single-shot fast spin-echo magnetic resonance (MR) image with fat saturation shows a cystic mass (large arrow) in the pancreatic head consisting of central microcysts and peripheral macrocysts. The small arrow indicates dilatation of the upstream main pancreatic duct. B: Axial T1-weighted gradient-echo MR image with fat saturation shows high intensity fluid in the macrocysts (arrows), representing hemorrhage. Hemorrhage may be seen in macrocysts, although it is uncommon.
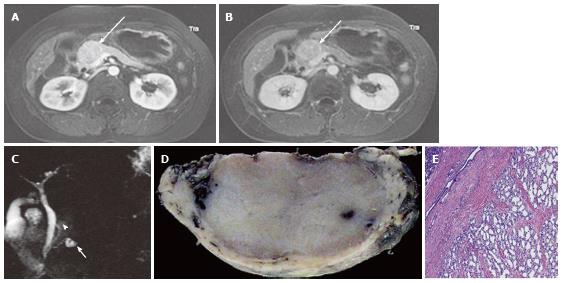
Figure 3 A 43-year-old female with solid-appearing serous cystic neoplasm in the pancreatic head.
A: The arterial phase of an axial contrast enhanced (CE) T1-weighted gradient-echo (GRE) magnetic resonance (MR) image with fat saturation shows an enhancing mass in the pancreatic head (arrow); B: The equilibrium phase of an axial CE T1-weighted GRE MR imaging shows the tumor (arrow) to be low intensity (wash-out); C: The pancreatic head mass (arrowhead) is not clearly demonstrated on MR cholangiopancreatography. The pancreatic head mass appears radiologically solid (solid-appearing). An arrow shows a concomitant small intraductal papillary mucinous neoplasm; D: Macroscopic view of the resected specimen shows the mass appears solid; E: Microscopic view shows the tumor consisting of small cystic structures with intervening fibrous stroma.
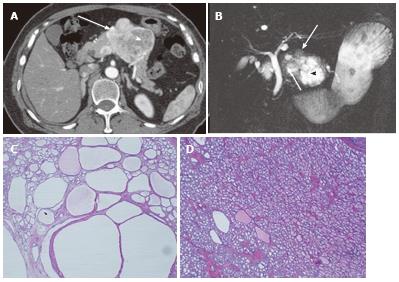
Figure 4 A 64-year-old female with mixed microcystic and solid-appearing serous cystic neoplasm.
A: The pancreatic parenchymal phase of an axial contrast enhanced-computed tomography (CT) shows a large enhancing mass in the pancreatic body. The right side of the tumor shows avid arterial enhancement (arrow), and the left side is low density (arrowheads); B: Magnetic resonance cholangiopancreatography shows a microcystic component at the left side of the tumor (arrowhead) that corresponds to the low density area on CT. In contrast, the right side of the tumor is radiologically solid-appearing (arrow); C: Microscopic view of the left side of the tumor [microcystic component (arrowheads in A and B)] consists of various sizes of small cystic spaces; D: Microscopic view of the right side of the tumor [solid-appearing component (arrows in A and B)] consists of smaller sized microcysts. It is radiologically solid-appearing but histologically microcystic.
Figure 5 A 40-year-old female with oligocystic serous cystic neoplasm (unilocular).
A: The pancreatic parenchymal phase of an axial contrast enhanced-computed tomography shows a unilocular cystic mass arising from the pancreatic body (arrow); B: The equilibrium phase shows no cyst wall enhancement (arrow).
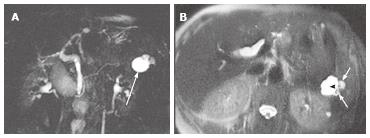
Figure 6 A 61-year-old female with oligocystic serous cystic neoplasm showing a cyst-by-cyst pattern.
A: Magnetic resonance cholangiopancreatography demonstrates a cystic mass (arrow) in the pancreatic tail consisting of a macrocyst and two adjacent smaller cysts; B: Axial T2-weighted single-shot fast spin-echo magnetic resonance image shows a lobulated macrocyst (arrowhead) with adjacent smaller cysts (small arrows) in the pancreatic tail (cyst-by-cyst pattern).
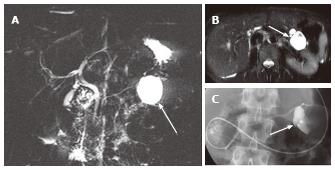
Figure 7 A 45-year-old female with branch duct type intraductal papillary mucinous neoplasm mimicking oligocystic serous cystic neoplasm (also see Figure 6).
A: Magnetic resonance cholangiopancreatography shows a cystic mass (arrow) in the body of the pancreas. The communication with the main pancreatic duct (MPD) is not apparent even with the source images (not shown). There is no downstream MPD dilatation; B: Axial T2-weighted single-shot fast spin-echo magnetic resonance image with fat saturation demonstrates a mass showing a cyst-by-cyst pattern (arrow); C: Endoscopic retrograde pancreatography shows the cystic lesion to be opacified (arrow), representing communication with the pancreatic duct.
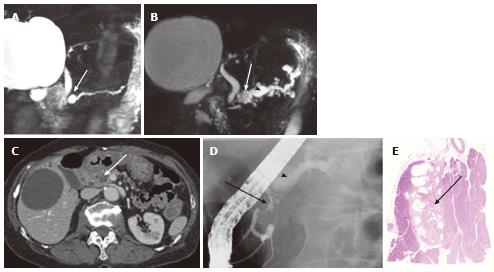
Figure 8 A 74-year-old female with microcystic serous cystic neoplasm and intraductal papillary mucinous neoplasm.
A: Magnetic resonance cholangiopancr -eatography (MRCP) shows a cystic mass (arrow) in the pancreatic head with mild upstream main pancreatic duct (MPD) dilatation; B: Follow-up MRCP 5 years after Figure 8A shows interval increase in size of the cystic lesion (arrow) with fusiform dilatation of the upstream MPD (arrowhaed) and cystic dilatation of multiple branch ducts. In retrospect, the cystic lesion in the pancreatic head appears microcystic without downstream MPD dilatation; C: The portal venous phase of an axial contrast enhanced-computed tomography shows an enhancing component (arrow) within the cystic lesion. Intraductal papillary mucinous neoplasm (IPMN) with solid component was suspected; D: Endoscopic retrograde pancreatography shows extrinsic compression of the MPD due to the cystic lesion in the pancreatic head (arrow) without cyst opacification, although fusiform dilatation of the upstream MPD (arrowhead) is demonstrated; E: Resected specimen shows the cystic mass in the pancreatic head consisting of microcysts. The enhancing component eventually represented fibrosis (arrow) within microcystic serous cystic neoplasm. In addition, the fusiform dilatation of the MPD turned out to be IPMN.
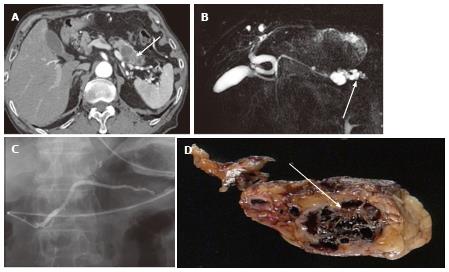
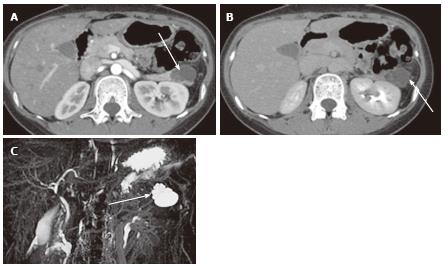
Figure 9 A 74-year-old male with microcystic serous cystic neoplasm mischaracterized as intraductal papillary mucinous neoplasm with a solid component.
A: The pancreatic parenchymal phase of an axial contrast enhanced-computed tomography shows a cystic lesion with an enhancing component (arrow) in the pancreatic tail; B: Magnetic resonance cholangiopancreatography (MRCP) shows the cystic lesion to be elongated, and the upstream main pancreatic duct (MPD) appears to be dilated (arrow). There is no dilatation of the downstream MPD. The extrahepatic bile duct is tortuous, likely due to distal gastrectomy (Billroth I reconstruction); C: Endoscopic retrograde pancreatography shows the cystic lesion to be unopacified. There is no communication with the pancreatic duct or upstream MPD dilatation. MRCP findings eventually represented a part of the cystic lesion along the course of the pancreas rather than MPD dilatation (arrow, B); D: Macroscopic view of the resected specimen (short axis cut section) shows the cystic lesion consisting of microcysts and fibrosis (arrow).
Figure 10 A 27-year-old female with mixed microcystic and macrocystic serous cystic neoplasm.
A: The pancreatic parenchymal phase of an axial contrast enhanced- computed tomography shows a lobulated cystic mass (arrow) in the pancreatic tail; B: The equilibrium phase shows no cyst wall enhancement (arrow); C: Magnetic resonance cholangiopancreatography clearly shows a cluster of microcysts (honeycomb pattern) in the peripheral portion of this cystic lesion (arrow).
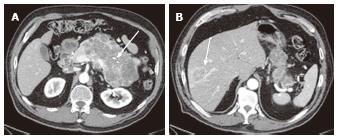
Figure 11 A 78-year-old female with a large serous cystic neoplasm with liver metastasis.
A: The pancreatic parenchymal phase of an axial contrast enhanced- computed tomography (CT) demonstrates a large low density mass with patchy enhancement in the body and tail of the pancreas. Central calcification is noted (arrow); B: Axial CT cranial to Figure 11A shows a low density liver mass with peripheral and patchy enhancement in segment VIII (arrow). The appearance is similar to the pancreatic mass.
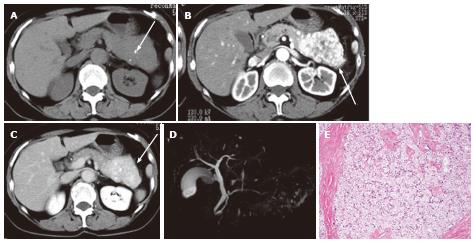
Figure 12 A 65-year-old female with solid serous adenoma.
A: Unenhanced axial computed tomography shows a large mass with central calcification (arrow) in the tail and body of the pancreas. The lesion is isodense to the normal pancreatic parenchyma; B: The pancreatic parenchymal phase shows avid tumor enhancement (arrow); C: The equilibrium phase shows the mass to be high density (arrow) relative to the normal pancreatic parenchyma, representing persistent enhancement (no wash-out); D: Magnetic resonance cholangiopancreatography does not show the mass or cystic spaces; E: Microscopic view of the resected specimen shows a solid nest of tumor cells with abundant fibrous stroma.
Figure 13 A 65-year-old male with neuroendocrine tumor (well-differentiated neuroendocrine carcinoma).
A: Unenhanced axial computed tomography shows a large mass with central calcification (arrow) in the pancreatic body; B: The venous phase shows moderate and relatively homogeneous tumor enhancement (arrow). (The arterial phase was not available for this case); C: The delayed phase shows the tumor to be low density (arrow). Wash-out may not always be suggestive of serous cystic neoplasm (also see Figure 12).
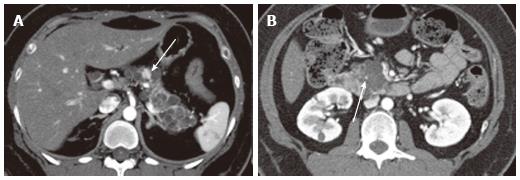
Figure 14 A 43-year-old female with von Hippel-Lindau disease.
A: The arterial phase of an axial contrast enhanced-computed tomography demonstrates numerous cystic lesions in the body and tail of the pancreas. There is a solid hypervascular lesion in the pancreatic body (arrow), representing neuroendocrine tumor; B: A multilocular cystic lesion in the pancreatic head consists of a punctate central calcification (arrow) with microcystic (right side) and macrocystic (left side) components, representing serous cystic neoplasm.
Figure 15 A 72-year-old female with pancreatic lymphoepithelial cyst.
A: Axial T2-weighted fast spin-echo magnetic resonance (MR) image with fat saturation shows a high intensity mass (arrow), which is exophytic from the neck of the pancreas (not shown); B: Axial T1-weighted gradient-echo (GRE) MR image with fat saturation shows the mass to be high intensity (arrow). Findings on T2-weighted image (Figure 14A) may mimic microcystic serous cystic neoplasm (SCN). However, the widespread distribution of high signal is somewhat unlikely for hemorrhage within microcysts of SCN because each locule should be separated by multiple septations; C: Axial diffusion-weighted MR image (b-factor = 1000) shows the mass to be high intensity (arrow), unlikely for SCN.
Figure 16 A 39-year-old male with solid pseudopapillary neoplasm.
A: Magnetic resonance cholangiopancreatography shows a high intensity pancreatic tail mass (arrow) that appears as a cluster of microcysts, mimicking microcystic serous cystic neoplasm (SCN); B: Axial diffusion-weighted magnetic resonance (MR) image (b-factor = 1000) shows the mass to be high intensity (arrow), unlikely for microcystic SCN; C: The equilibrium phase of an axial contrast enhanced T1-weighted gradient-echo MR image shows peripheral solid enhancing component within the tumor (arrows).
Figure 17 A 32-year-old female with lymph node metastasis from mucinous adenocarcinoma of the transverse colon (not shown).
A: The portal venous phase of an axial computed tomography shows a low density mass (arrow) adjacent to the pancreatic head (asterisk); B: Axial magnetic resonance cholangiopancreatography shows the mass to be high intensity, mimicking microcystic serous cystic neoplasm (SCN). However, the presence of primary tumor and the lesion location (transverse mesocolon) are suggestive of lymph node metastasis rather than microcystic SCN.
Figure 18 A 56-year-old male with chronic pancreatic pseudocyst.
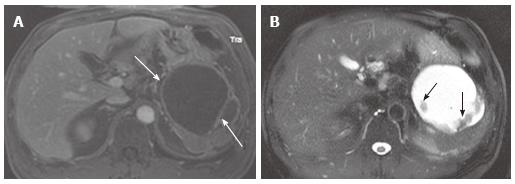
A: The venous phase of an axial contrast enhanced T1-weighted gradient-echo magnetic resonance image demonstrates a cystic lesion with thick cyst wall and septation (arrows) arising from the pancreatic tail. Although this is a male patient, making mucinous cystic neoplasm unlikely, imaging findings of chronic pseudocyst may still mimic mucinous cystic neoplasm; B: The axial fast spin-echo T2-weighted magnetic resonance image with fat saturation shows non-enhancing debris (A) attached to the cyst wall and the septum (arrows).
- Citation: Ishigami K, Nishie A, Asayama Y, Ushijima Y, Takayama Y, Fujita N, Takahata S, Ohtsuka T, Ito T, Igarashi H, Ikari S, Metz CM, Honda H. Imaging pitfalls of pancreatic serous cystic neoplasm and its potential mimickers. World J Radiol 2014; 6(3): 36-47
- URL: https://www.wjgnet.com/1949-8470/full/v6/i3/36.htm
- DOI: https://dx.doi.org/10.4329/wjr.v6.i3.36


