Copyright
©2013 Baishideng Publishing Group Co.
World J Radiol. Apr 28, 2013; 5(4): 187-192
Published online Apr 28, 2013. doi: 10.4329/wjr.v5.i4.187
Published online Apr 28, 2013. doi: 10.4329/wjr.v5.i4.187
Figure 1 Magnetic resonance imaging scan showed a fusiform posterior epidural mass compressing the thoracic cord over two vertebral body segments between T3-T4.
A: Sagittal T1 weighted magnetic resonance imaging (MRI) shows a posterior epidural mass with inhomogeneous isointensity constricting the spinal cord (arrow); B: Sagittal T2 weighted MRI shows a fusiform mass with slightly inhomogeneous hyperintensity (arrow); C: Sagittal fat-saturated T2-weighted image shows a hyperintense tumor (arrow); D: Post-contrast sagittal T1-weighted MRI with fat-saturation technique shows an inhomogeneously enhancing mass (arrow); E: Post-contrast axial T1 weighted MRI show crack like low signal between spinal cord and the lesion, with compression and displacement of the spinal cord (arrow).
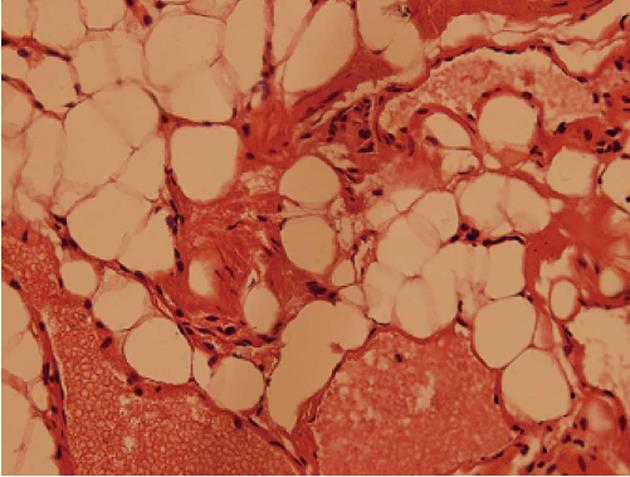
Figure 2 Histomicrograph of the surgical specimen shows typical angiolipoma.
Composed of mature fat cells and abnormal vascular elements.
- Citation: Meng J, Du Y, Yang HF, Hu FB, Huang YY, Li B, Zee CS. Thoracic epidural angiolipoma: A case report and review of the literature. World J Radiol 2013; 5(4): 187-192
- URL: https://www.wjgnet.com/1949-8470/full/v5/i4/187.htm
- DOI: https://dx.doi.org/10.4329/wjr.v5.i4.187


