©2012 Baishideng Publishing Group Co.
World J Radiol. Aug 28, 2012; 4(8): 379-386
Published online Aug 28, 2012. doi: 10.4329/wjr.v4.i8.379
Published online Aug 28, 2012. doi: 10.4329/wjr.v4.i8.379
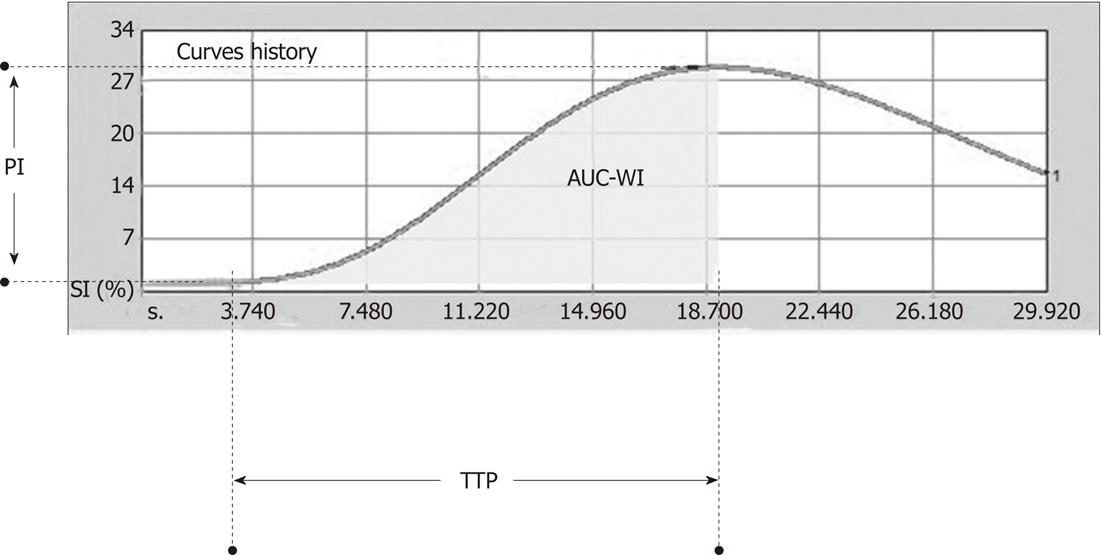
Figure 1 Graph showing the time-intensity curve, which depicts the changes in signal intensity within the selected region of interest during the 30-s acquisition and the three derived parameters: Peak intensity, area under the curve during wash-in phase and time to peak.
PI: Peak intensity; AUC-WI: Area under the curve during wash-in; SI: Signal intensity; TTP: oTime to peak.
Figure 2 Box and whisker plots showing the statistically significant changes observed after transarterial chemoembolization in peak intensity and area under the curve during wash-in, while changes in time to peak were not statistically significant (the upper and lower end of each box corresponds to the 1st and 3rd quartile, respectively, and the horizontal line inside the box corresponds to the median value).
PI: peak intensity; AUC-WI: area under the curve during wash-in; a.u: Arbitrary units; TACE: Transarterial chemoembolization.
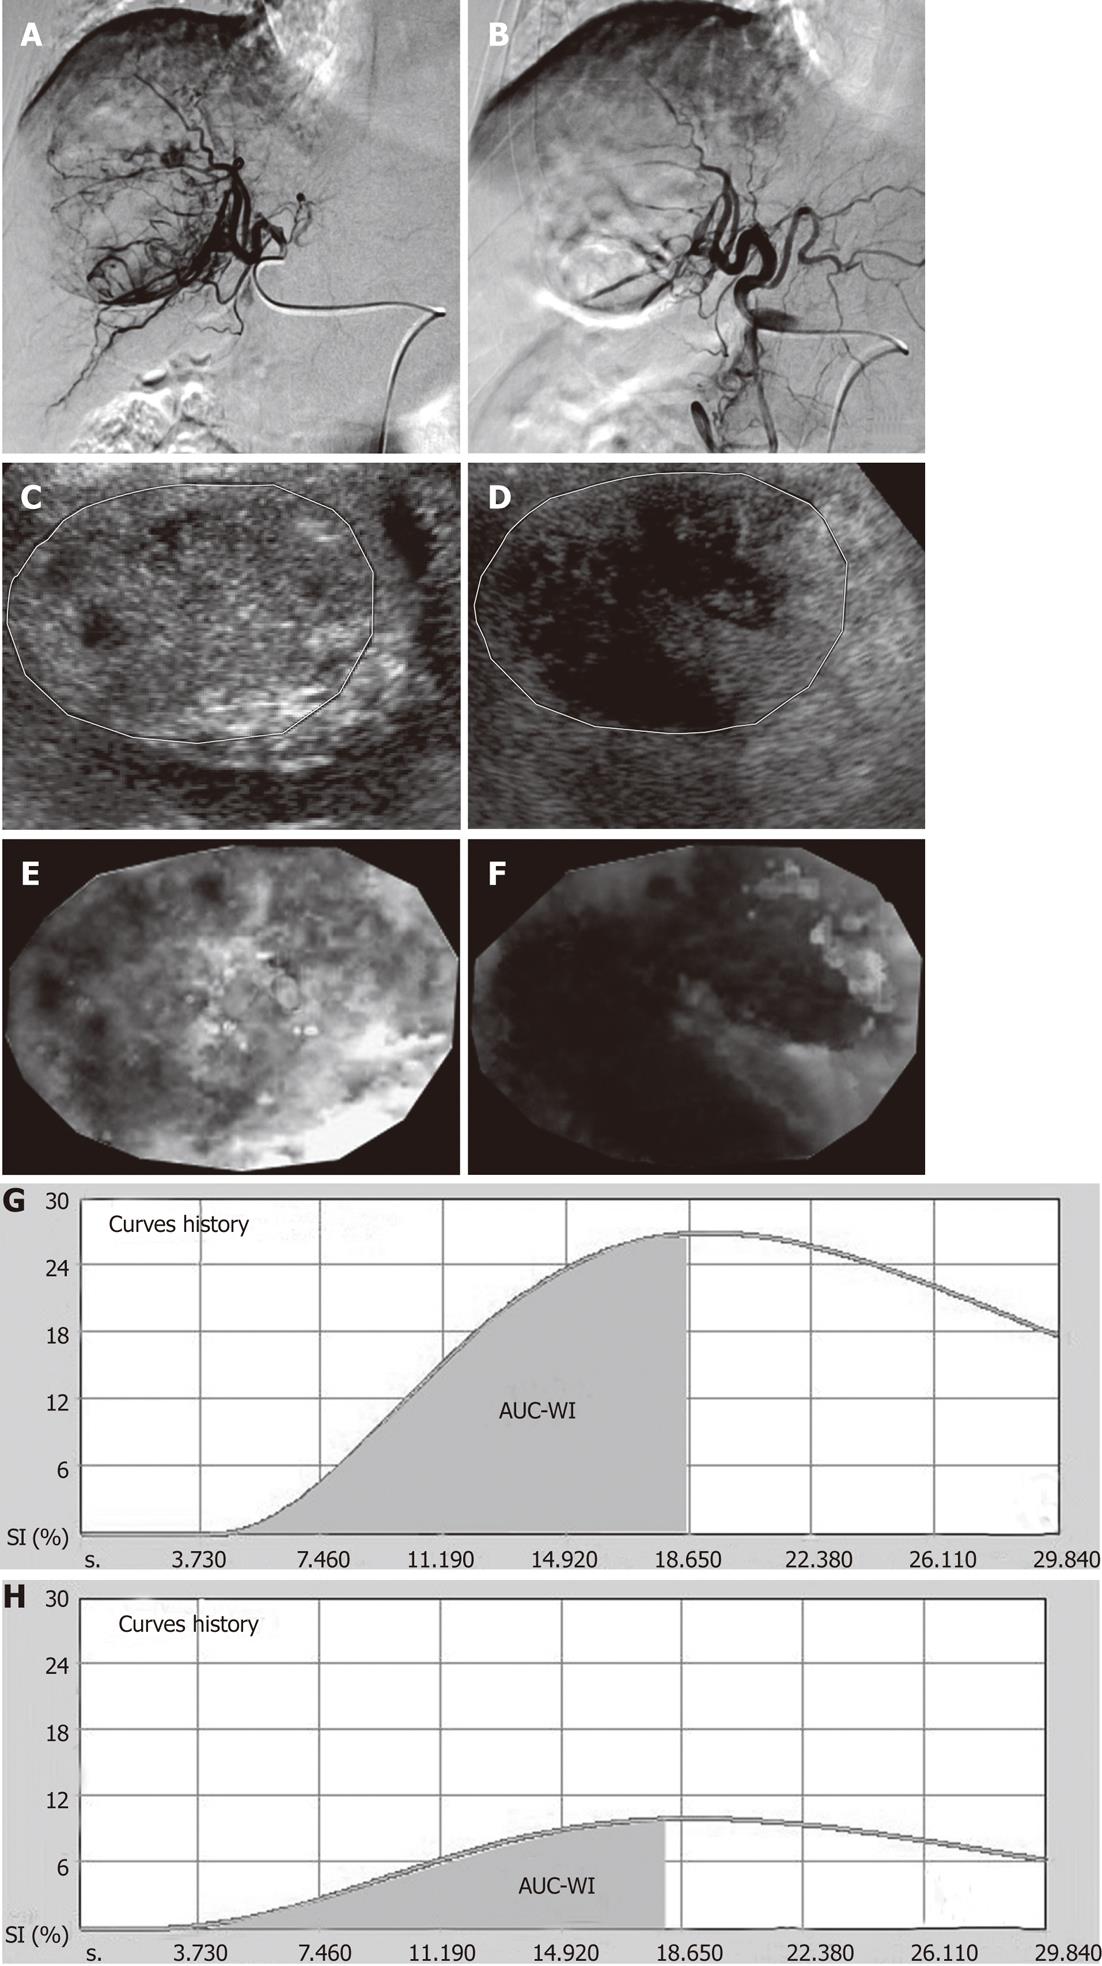
Figure 3 A case of hepatocellular carcinoma studied with non-parametric contrast-enhanced ultrasonography and parametric contrast-enhanced ultrasound before and after the first session of transarterial chemoembolization.
A, B: Digital subtraction angiography of the tumor prior to (A) and post transarterial chemoembolization (TACE) (B), shows significant reduction in the angiographically detectable neovascularity after chemoembolization; C, D: Non-parametric contrast-enhanced ultrasonography (npCEUS) at the plane of longest tumor diameter prior to (C) and post TACE (D), shows post-therapeutic reduction in tumoral enhancement with non-enhanced, as well as hypoenhanced areas; E, F: Parametric images produced by analysis of tumor perfusion prior to (E) and post TACE (F), at the same plane as npCEUS. Lighter tones of gray represent areas with higher peak intensity (PI), while darker tones of gray represent hypoperfused areas, with lower PI; G, H: Time-intensity curves prior to (G) and post TACE (H) show an obvious reduction in PI and area under the curve during wash-in (AUC-WI) after TACE. SI: Signal intensity.
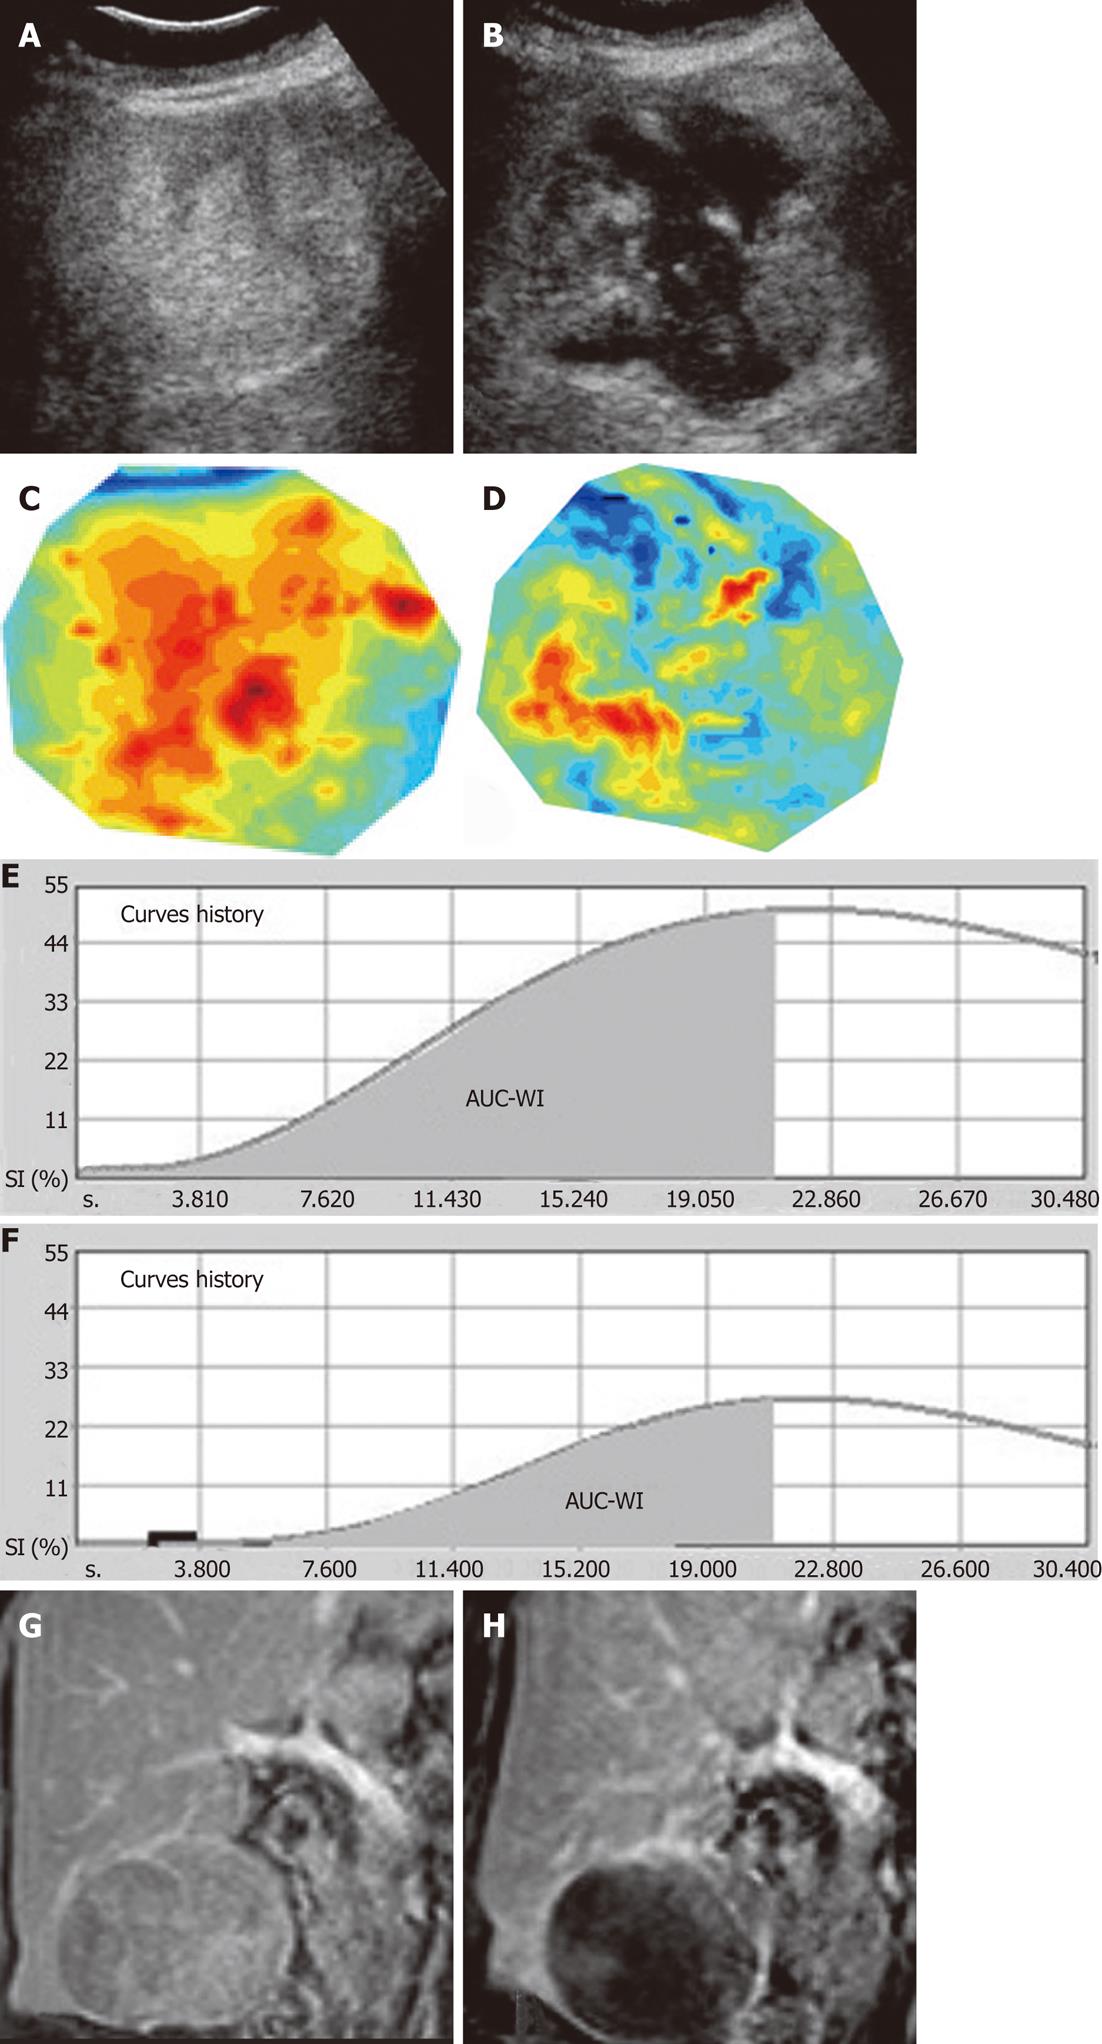
Figure 4 Another case of hepatocellular carcinoma studied with non-parametric contrast-enhanced ultrasonography and parametric contrast-enhanced ultrasound before and after the first session of transarterial chemoembolization.
A, B: Non-parametric contrast-enhanced ultrasonography (npCEUS) at the plane of longest tumor diameter prior to (A) and post transarterial chemoembolization (TACE) (B), shows non-enhancing (necrotic) areas post-TACE as well as multiple residual enhancing components; C, D: parametric images prior to (C) and post TACE (D) depict well-perfused areas with red and yellow tones, while hypoperfused areas are depicted with tones of blue; E, F: Time-intensity curves prior to (E) and post TACE (F), confirm a reduction in peak intensity (PI) and area under the curve during wash-in (AUC-WI) after TACE; G, H: Corresponding coronal, T1-weighted, gadolinium-enhanced magnetic resonance images of the same tumor, prior to (G) and post TACE (H) correlate favorably with contrast-enhanced ultrasonography images and confirm the significant reduction in lesional enhancement, but no tumor shrinkage. SI: Signal intensity.
- Citation: Moschouris H, Malagari K, Marinis A, Kornezos I, Stamatiou K, Nikas G, Papadaki MG, Gkoutzios P. Hepatocellular carcinoma treated with transarterial chemoembolization: Evaluation with parametric contrast-enhanced ultrasonography. World J Radiol 2012; 4(8): 379-386
- URL: https://www.wjgnet.com/1949-8470/full/v4/i8/379.htm
- DOI: https://dx.doi.org/10.4329/wjr.v4.i8.379


