Copyright
©2011 Baishideng Publishing Group Co.
World J Radiol. Jun 28, 2011; 3(6): 159-168
Published online Jun 28, 2011. doi: 10.4329/wjr.v3.i6.159
Published online Jun 28, 2011. doi: 10.4329/wjr.v3.i6.159
Figure 1 Registration of 3-D volume and 2-D angiography of a patient’s aorta[3].
A: The original 3-D volume; B: Aorta segmentation and coronary ostia landmark detection; C: Aortic angiography; D: Overlay of aortic angiography with the contour of the 3-D model after registration.
Figure 2 Spine-based 2-D/3-D registration examples for electrophysiology[9].
A: Spine-enhanced fluoroscopy with the edge contours depicted; B: Digitally reconstructed radiographs (DRRs) before registration overlaid with the edge contours from fluoroscopy; C: DRRs after registration overlaid with the edge contours from fluoroscopy; D: 2-D/3-D overlay used for electrophysiology procedures. The 3-D mesh model is generated from the segmentation of the left atrium and pulmonary veins, and is overlaid with fluoroscopy by the proposed spine-based 2-D/3-D registration technique.
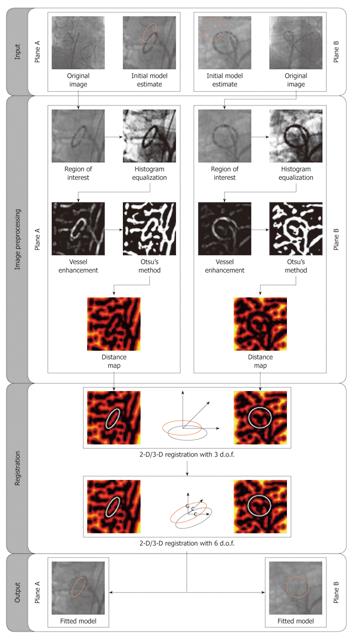
Figure 3 Workflow of image processing and 2-D/3-D registration for lasso catheter-based motion compensation for electrophysiology radio-frequency catheter ablation[15].
Figure 4 Curve-based 2-D/3-D registration for chronicle total occlusion revascularization[21].
A: Curves of the LCx (green) and LAD (red) identified on fluoroscopic images (in bold) using a semi-automatic tool based on the vesselness measure, fast marching, and B-Spline fitting. The 2-D projection of the corresponding curve segments from the 3-D multi-slice computed tomography (MSCT) is shown with an offset (in dashed). The image frame used for registration is selected to match the acquisition cardiac phase of the MSCT volume, expressed by a percentage of the R-R interval from the electrocardiogram; B, C: The distance transform image obtained from the curve identified on the LCx and the LAD; D: Registration results obtained by selecting the LCx and LAD. The mesh model of the segmented MSCT is overlaid on top of the fluoroscopic image after registration.
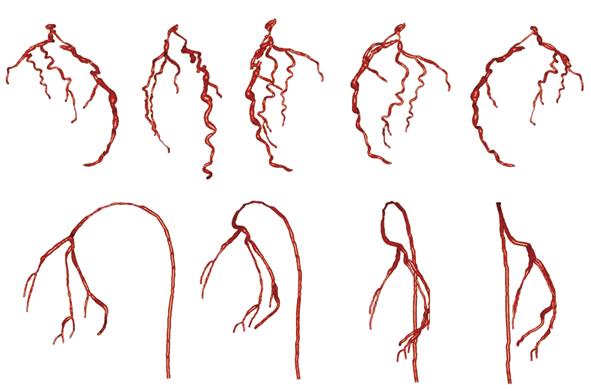
Figure 5 Two examples of 3-D reconstruction of the coronary artery tree from an X-ray rotational angiography viewed at different angles[28].
Figure 6 Graph-based deformable 2-D/3-D registration for abdominal aortic aneurysm stenting[30].
A: An example of patient computed tomography data, with abdominal aortic aneurysm segmented and shown in mesh; B: The 3-D graph and the ground truth with synthesized deformation for patient one; C: Registration results of (B); D: The 3-D graph and the ground truth with natural deformation for patient two; E: Registration result of (D).
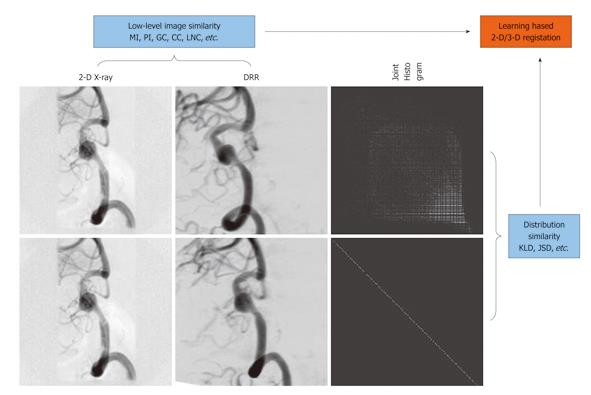
Figure 7 Learning-based 2-D/3-D registration[33].
DRR: Digitally reconstructed radiograph.
- Citation: Liao R. Rui Liao’s work on patient-specific 3-D model guidance for interventional and hybrid-operating-room applications. World J Radiol 2011; 3(6): 159-168
- URL: https://www.wjgnet.com/1949-8470/full/v3/i6/159.htm
- DOI: https://dx.doi.org/10.4329/wjr.v3.i6.159


