©2010 Baishideng Publishing Group Co.
World J Radiol. Sep 28, 2010; 2(9): 358-367
Published online Sep 28, 2010. doi: 10.4329/wjr.v2.i9.358
Published online Sep 28, 2010. doi: 10.4329/wjr.v2.i9.358
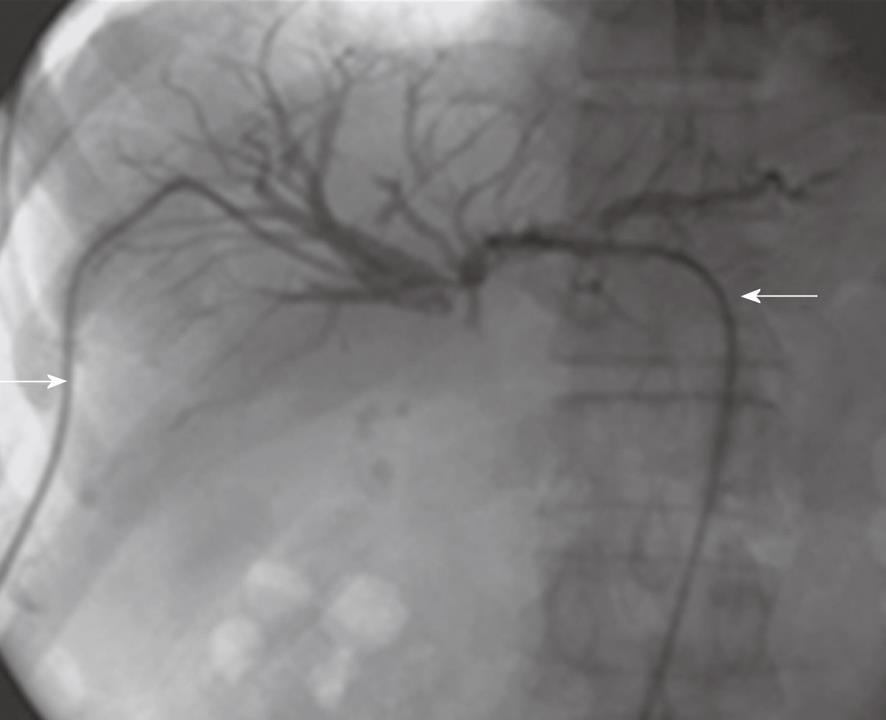
Figure 1 A case of malignant obstructive jaundice secondary to head of pancreas cancer.
Fluoroscopy-guided right and left external drainage tubes are seen in situ (arrows).
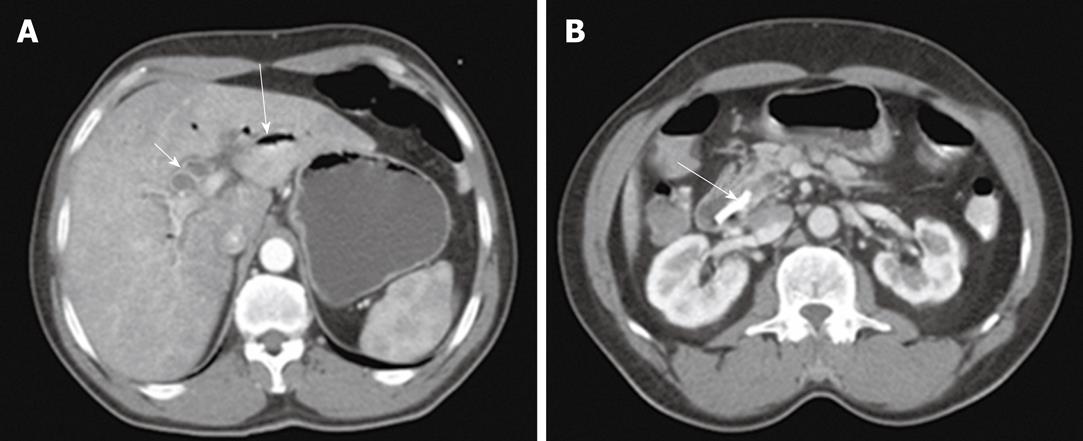
Figure 2 A case of obstructive jaundice secondary to head of pancreas cancer obstructing the common bile duct.
A: Computed tomography (CT)-guided percutaneous transhepatic cholangiography shows opacification of markedly dilated intrahepatic biliary radicles (arrow); B: CT-guided internal drainage stent seen along the course of the common bile duct surrounded by the pancreatic mass (arrow).
Figure 3 A case of acute cholangitis.
A: Computed tomography (CT) scan shows pneumobilia (long arrow), dilated intrahepatic biliary radicles, with enhancing walls (short arrow); B: CT-guided internal drainage stent seen along the common bile duct (arrow).
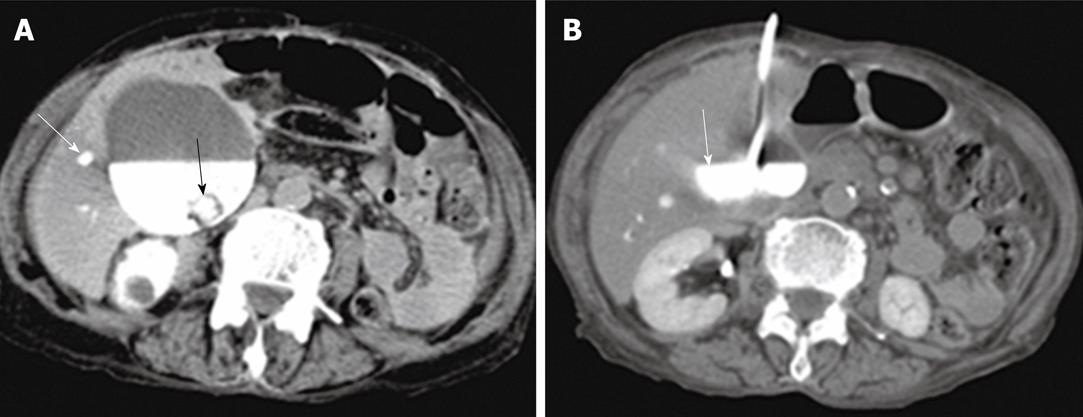
Figure 4 A case of gallbladder empyema.
A: Computed tomography (CT)-guided cholecystostomy shows opacification of a markedly dilated gallbladder with intraluminal filling defect due to the presence of gallstones (black arrow). The intrahepatic biliary ducts (white arrow) were opacified after endoscopic retrograde cholangiopancreatography, which failed to drain the biliary ducts; B: Follow up CT scan shows well-drained gallbladder (arrow).
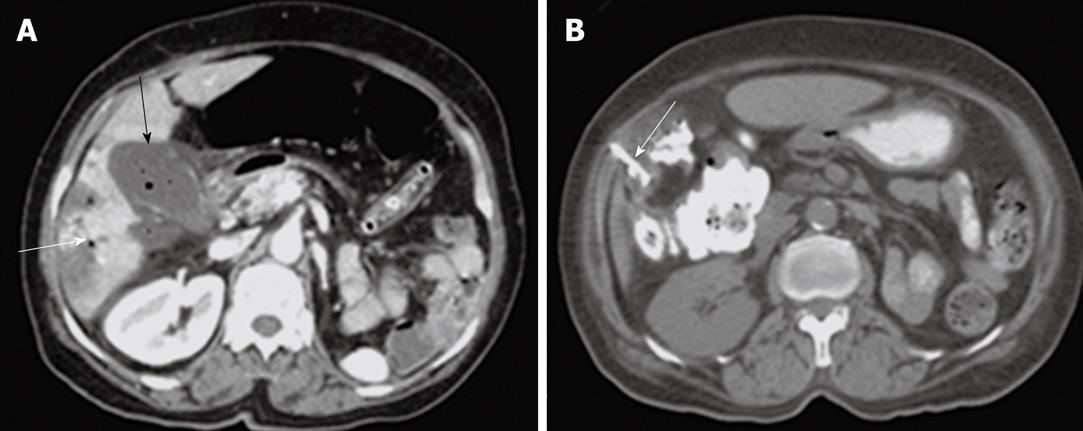
Figure 5 A case of emphysematous cholecystitis.
A: Post contrast computed tomography (CT) scan shows thick-enhancing walled gallbladder with turbid fluid content and air loculi seen within its lumen (black arrow). Minimal free pericholecystic fluid collection. Pneumobilia seen within the intrahepatic biliary radicles (white arrow); B: Follow up CT-guided cholecystostomy with drainage catheter seen within the gallbladder lumen (arrow).
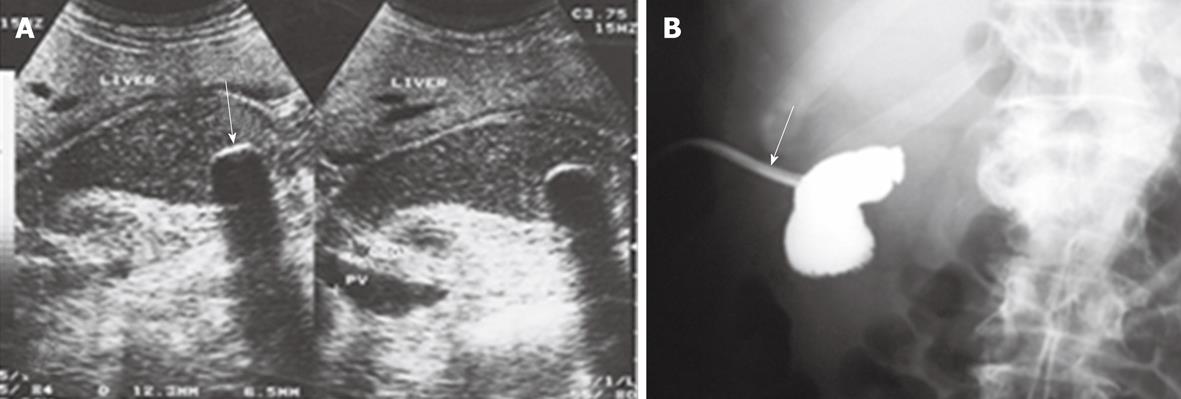
Figure 6 A case of acute calcular cholecystitis.
A: Abdominal sonography shows thickening and stripping of its wall with stones and biliary mud seen within its lumen (arrow); B: Fluoroscopy image after ultrasonography-guided percutaneous cholecystostomy shows good position of the drainage tube (arrow).
Figure 7 A case of acute cholecystitis with pericholecystic abscess.
A: Computed tomography (CT) scan shows a pericholecystic abscess (black arrow) adjacent to acutely inflamed gallbladder (white arrow); B: Follow up after CT-guided drainage of the pericholecystic abscess shows marked resolution of the abscess with drainage tube seen within (arrow).
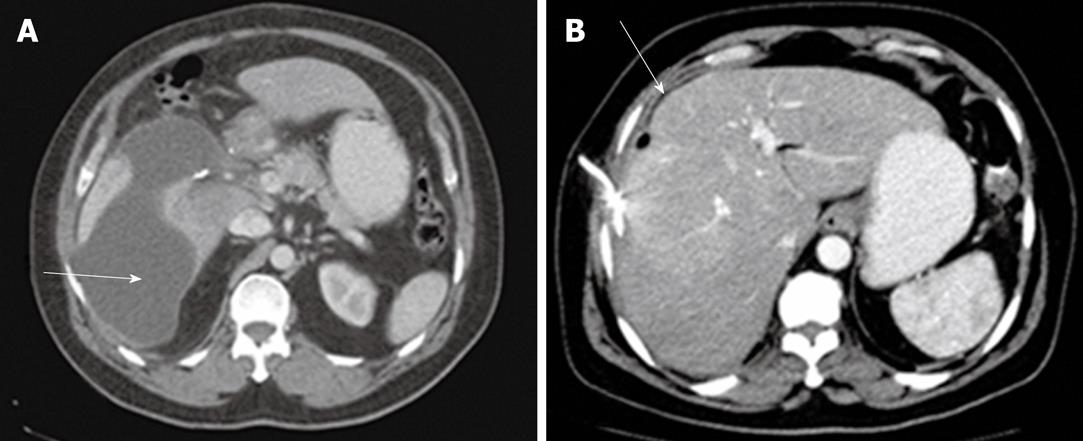
Figure 8 A case of post cholecystectomy biloma.
A: Abdominal computed tomography (CT) shows a large subhepatic biloma (arrow); B: CT-guided drainage of the biloma shows marked regression of the volume of the collection (arrow).
Figure 9 A case of acute cholecystitis complicated by hepatic abscess.
A: Computed tomography (CT) scan shows a large intrahepatic abscess with air/fluid level within (arrow); B: CT-guided drainage of the hepatic abscess which is seen adjacent to acute cholecystitis (arrow).
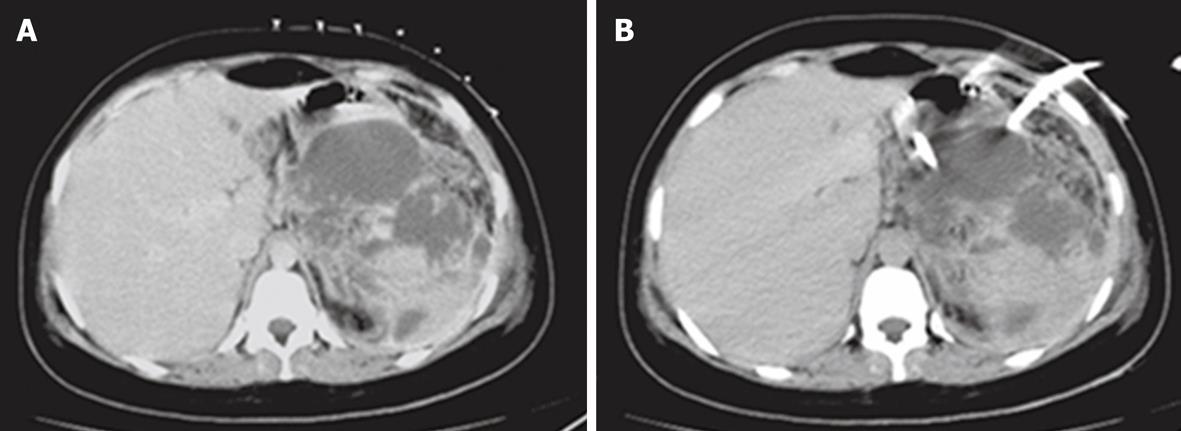
Figure 10 A case of pseudopancreatic cyst secondary to biliary pancreatitis.
A: Computed tomography (CT) scan shows a large multilocular pseudopancreatic cyst with localized skin grid seen over the skin before the drainage procedure; B: CT-guided drainage catheter seen within the cavity of the pseudopancreatic cyst.
- Citation: Donkol RH, Latif NA, Moghazy K. Percutaneous imaging-guided interventions for acute biliary disorders in high surgical risk patients. World J Radiol 2010; 2(9): 358-367
- URL: https://www.wjgnet.com/1949-8470/full/v2/i9/358.htm
- DOI: https://dx.doi.org/10.4329/wjr.v2.i9.358


