©2010 Baishideng Publishing Group Co.
World J Radiol. Aug 28, 2010; 2(8): 298-308
Published online Aug 28, 2010. doi: 10.4329/wjr.v2.i8.298
Published online Aug 28, 2010. doi: 10.4329/wjr.v2.i8.298
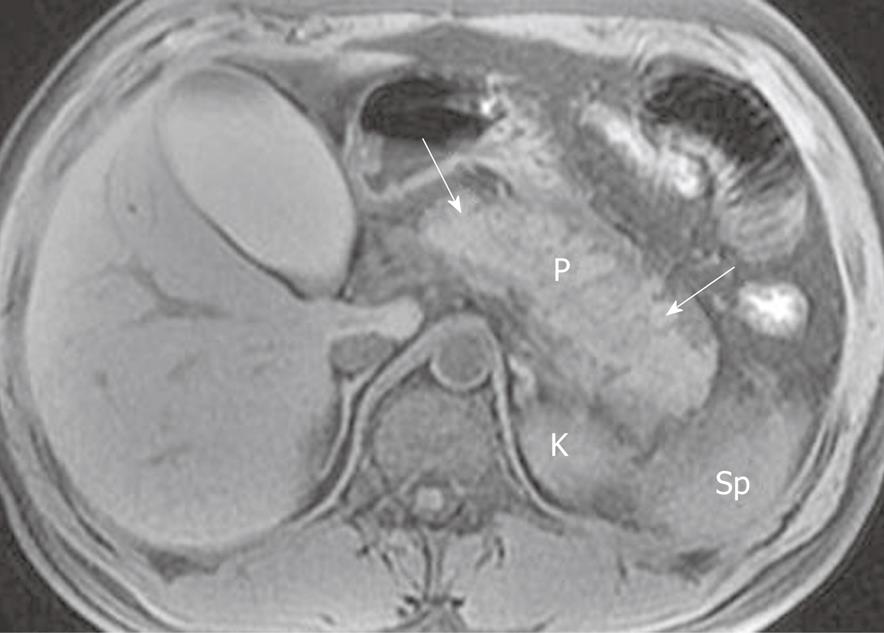
Figure 1 Acute pancreatitis in a 37-year-old man.
Axial non-enhanced magnetic resonance T1-weighted with fat-suppression image obtained at the time of hospital admission shows an edematous, homogeneously enlarged pancreas (arrows). Pancreatic boundaries are blurred due to peripancreatic fluid exudations. K: Kidney; P: Pancreas; Sp: Spleen.
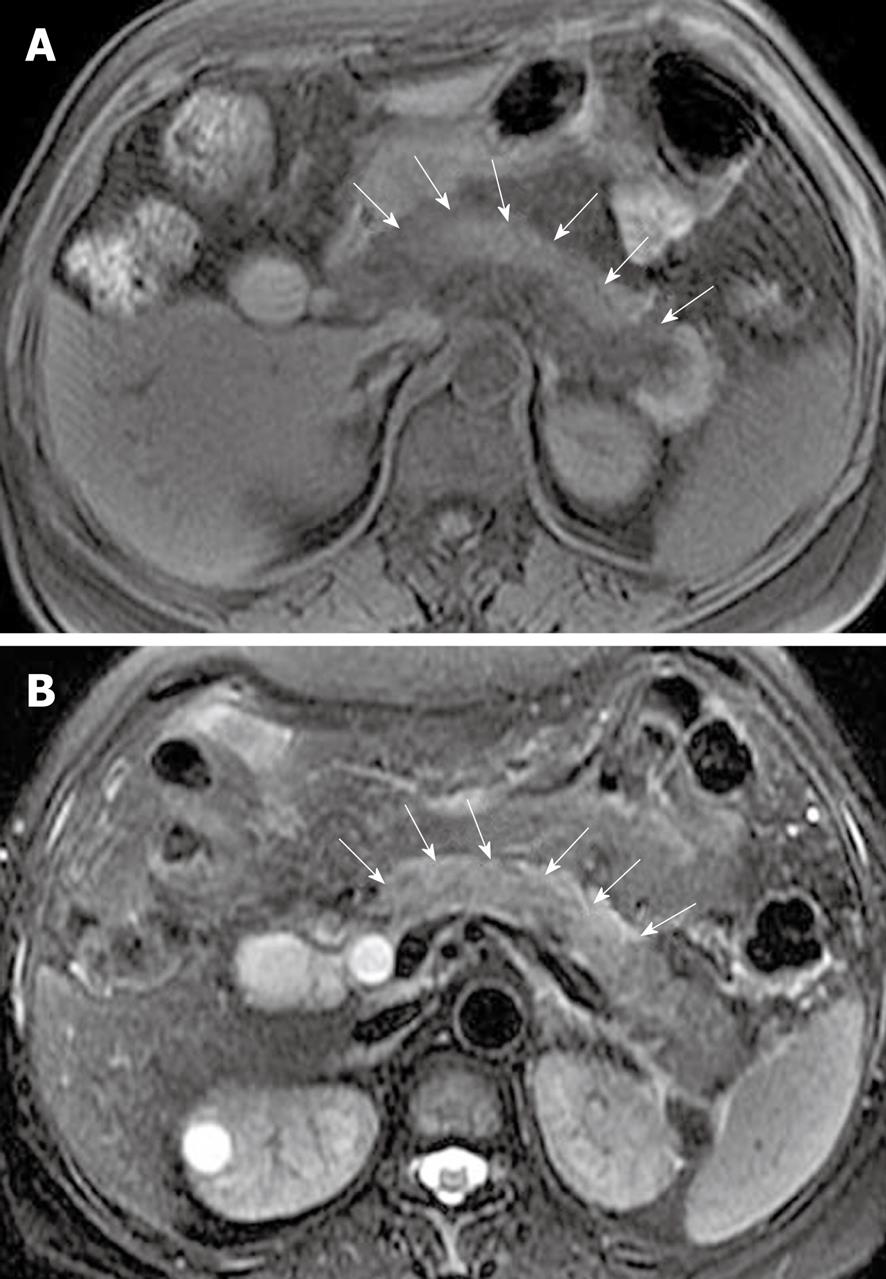
Figure 2 Acute edematous pancreatitis in a 29-year-old man.
Axial non-enhanced magnetic resonance T1-weighted with fat-suppression image (A) and axial T2-weighted with fat-suppression image (B) show that the parenchyma of the pancreatic head, body and part of the tail is hypointense (arrows in A) and hyperintense (arrows in B) relative to the liver.
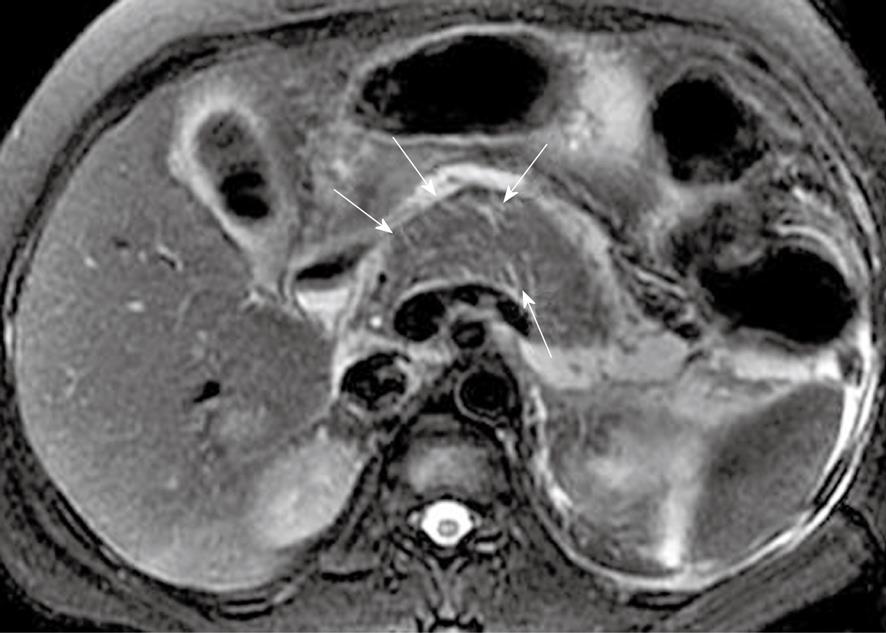
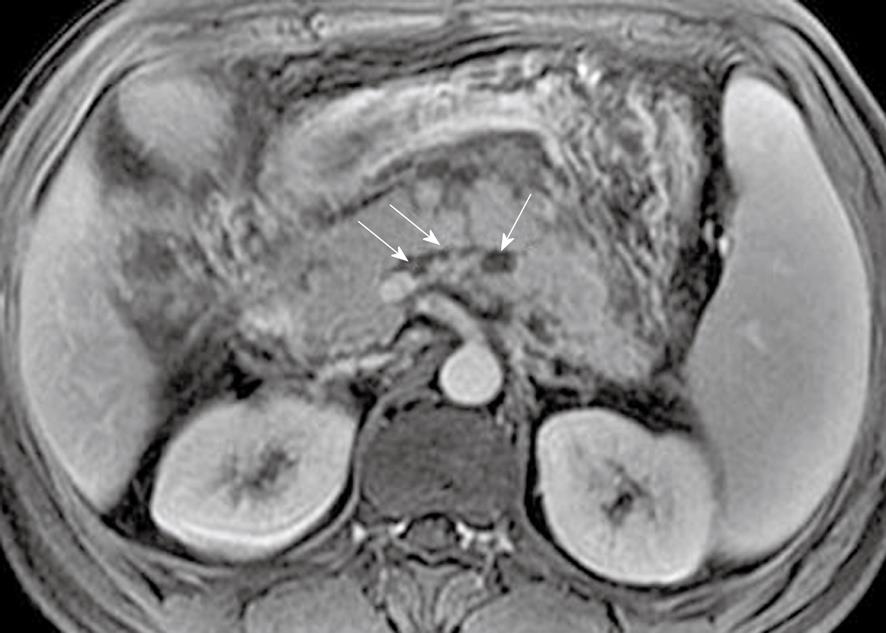
Figure 3 Acute pancreatitis in a 42-year-old man.
Axial magnetic resonance T2-weighted with fat-suppression image shows intrapancreatic threadlike hyperintense structures consistent with interlobular septal inflammation (arrows).
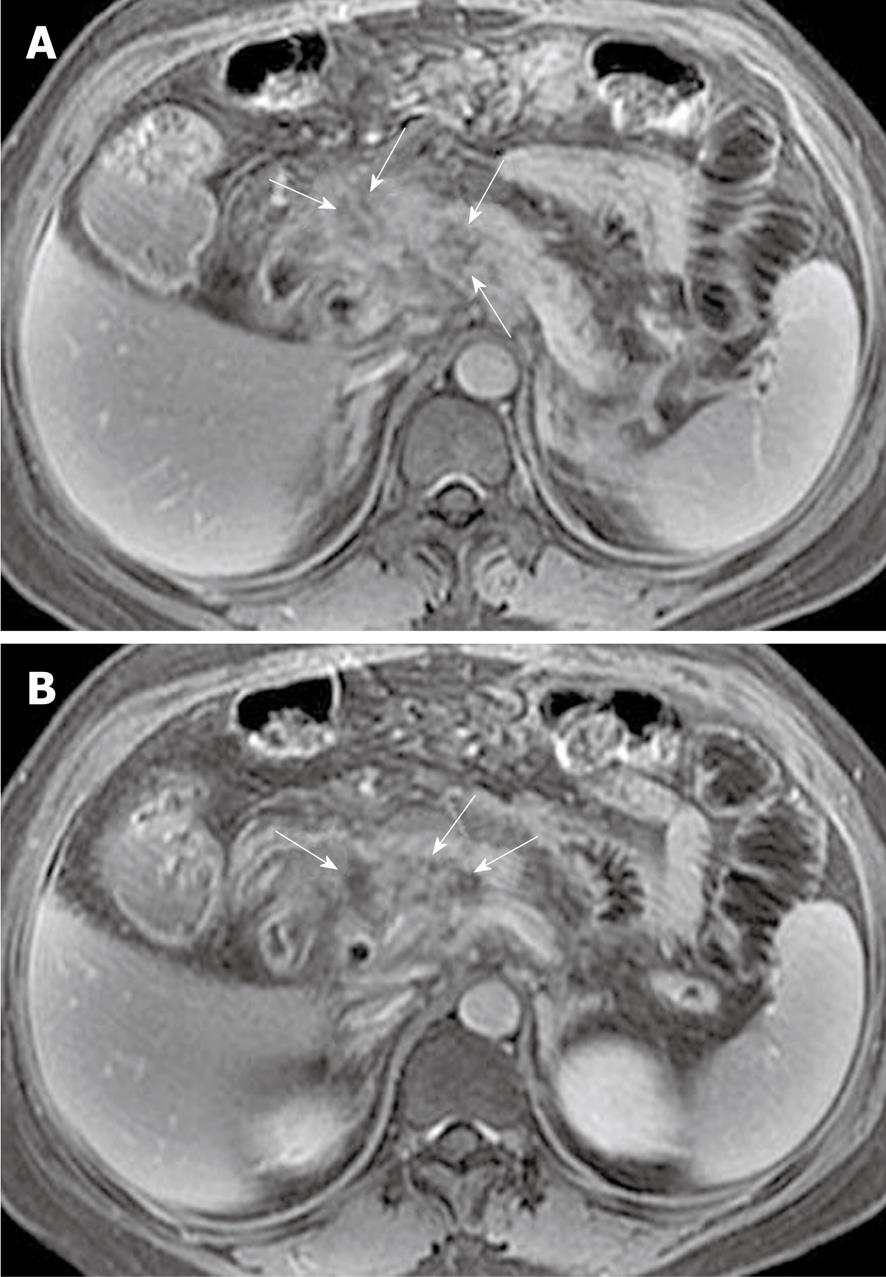
Figure 4 Pancreatic focal necrosis in a 43-year-old woman after an episode of acute pancreatitis.
A, B: Axial magnetic resonance T1-weighted images obtained after intravenous contrast material reveal the spotted, patchy necrosis (like “pepper”) (arrows) in the head and body of the pancreas. The extent of necrosis is < 30% of the pancreatic gland.
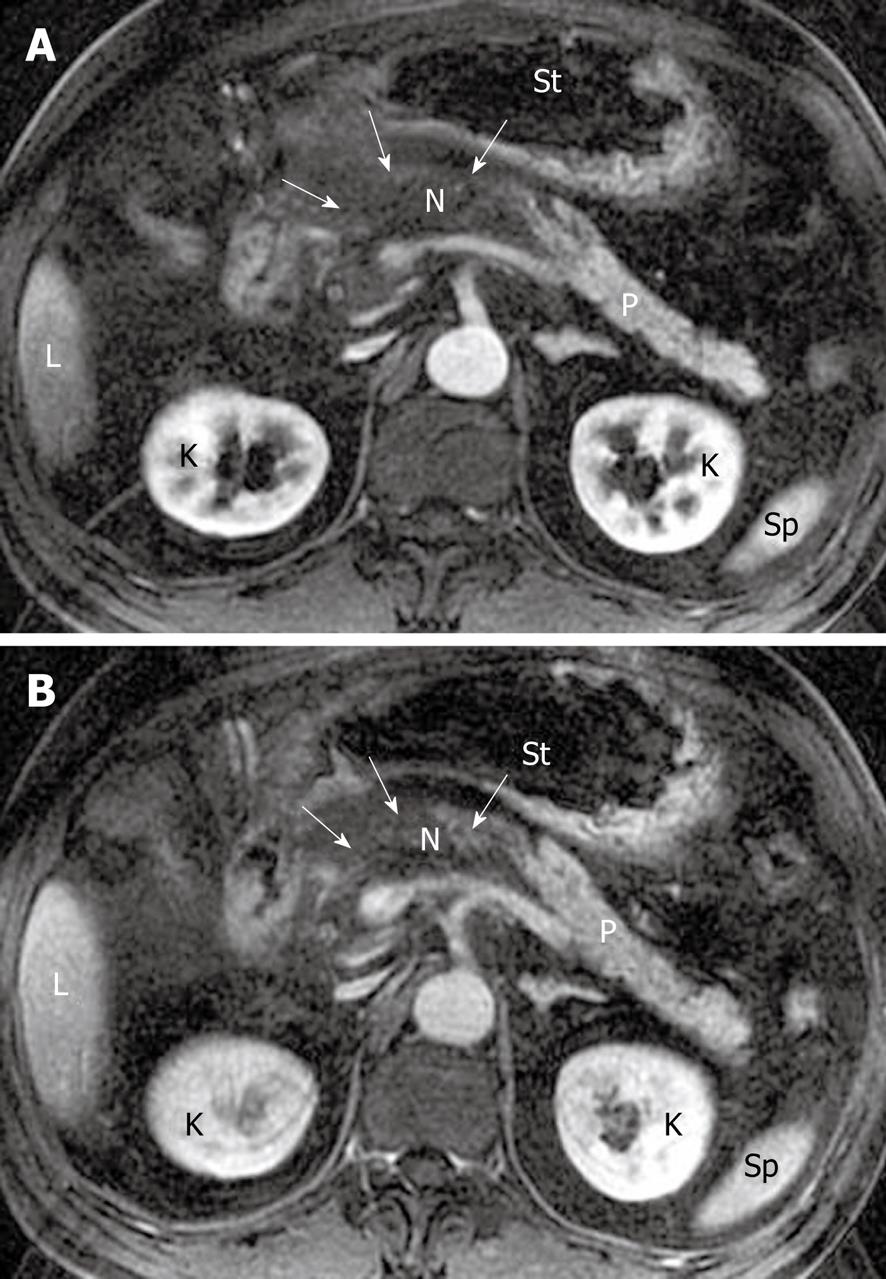
Figure 5 Pancreatic diffuse necrosis in a 65-year-old man after an episode of acute pancreatitis.
A, B: Axial magnetic resonance T1-weighted images obtained in late arterial phase and venous phase reveal large necrotic areas (arrows) (“black pancreas”) in the pancreatic head, neck and part of the body. The extent of necrosis is up to 30-50% of the pancreatic gland. N: Necrosis; K: Kidney; L: Liver; P: Pancreas; Sp: Spleen; St: Stomach.
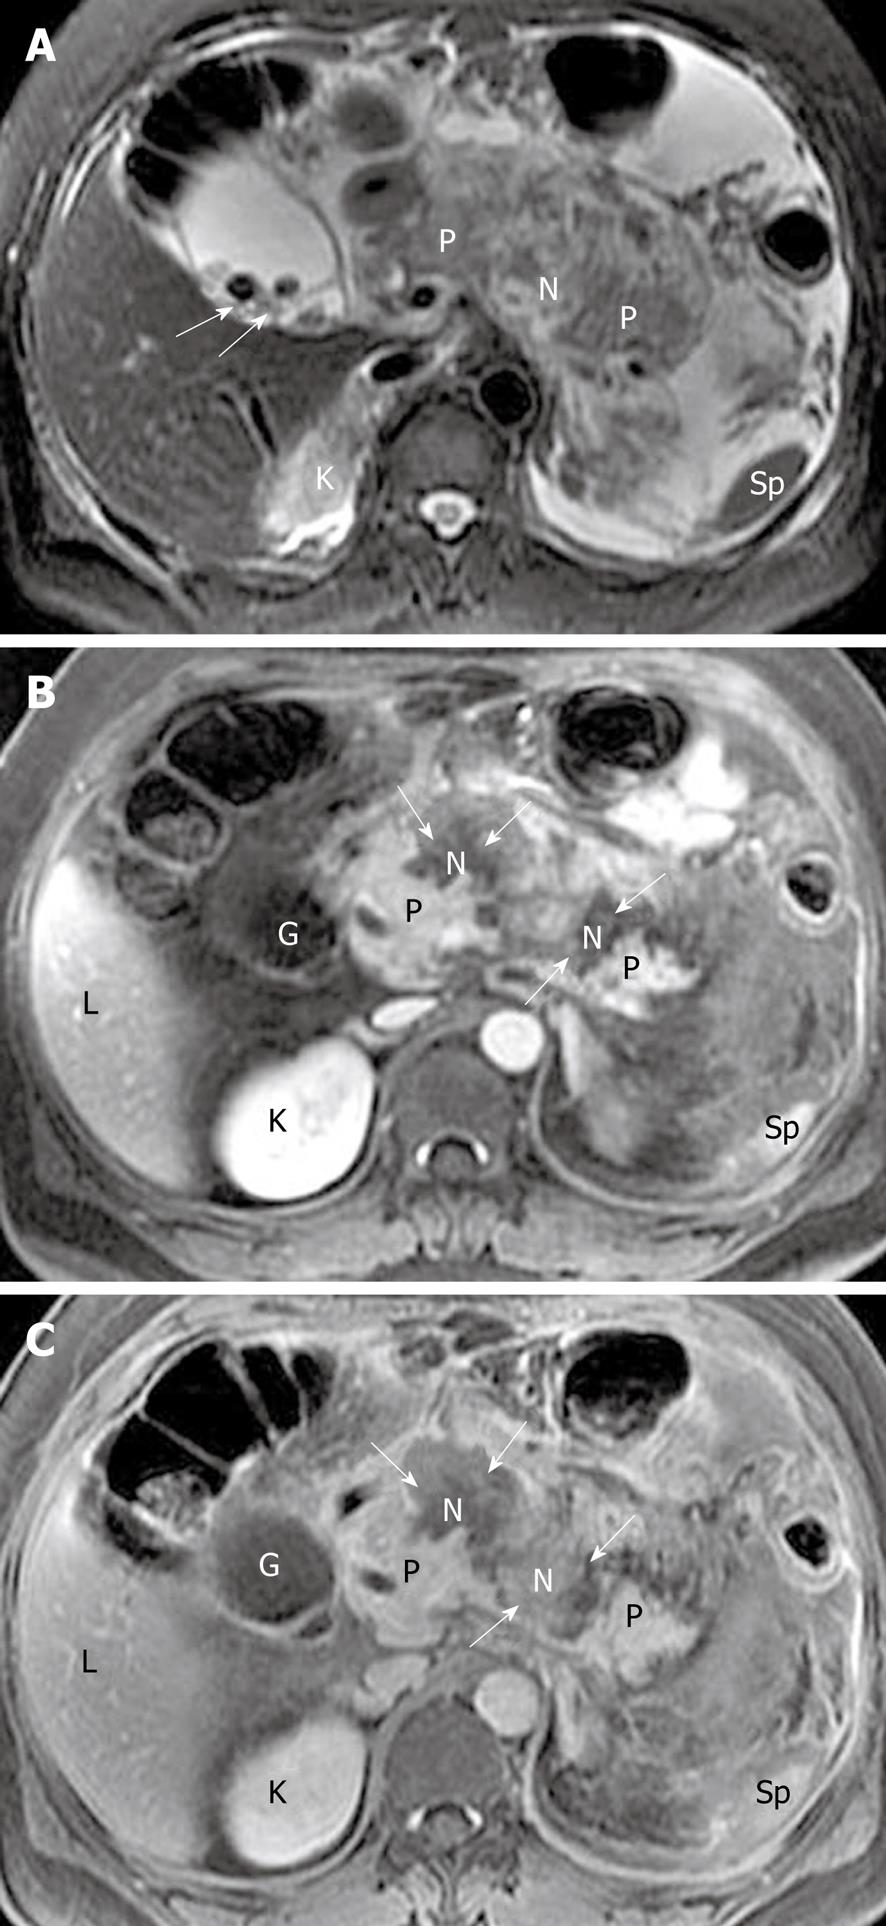
Figure 6 Gallstones, acute pancreatitis, and gland liquefied necrosis in a 33-year-old woman.
Axial magnetic resonance T2-weighted with fat-suppression image (A) shows hypointense gallstones (arrows), and axial T1-weighted images obtained in late arterial phase (B) and venous phase (C) reveal two zones (arrows) of pancreatic liquefied necrosis in the neck and body of the gland (like “rupture of the pancreas”). The extent of necrosis is > 50% of the pancreatic gland. The head and the tail of the pancreas are still enhancing (P). N: Liquefied gland necrosis; G: Gallbladder; K: Kidney; L: Liver; P: Pancreas; Sp: Spleen.
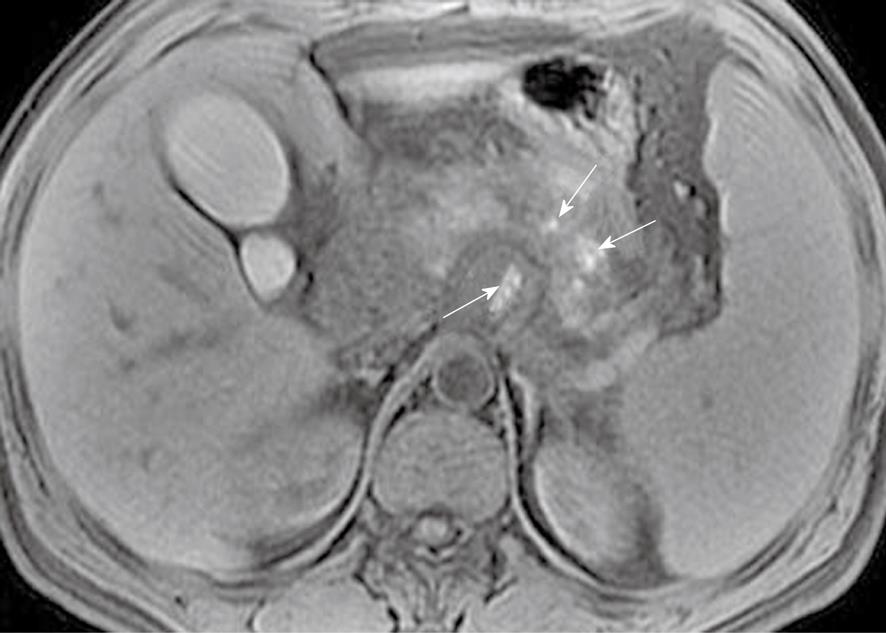
Figure 7 Acute pancreatitis in a 30-year-old man.
Axial non-enhanced magnetic resonance T1-weighted with fat-suppression image obtained at the time of hospital admission shows multiple patchy hemorrhagic foci (like “salt”) (arrows) in the pancreas and in the fatty tissue behind the pancreas.
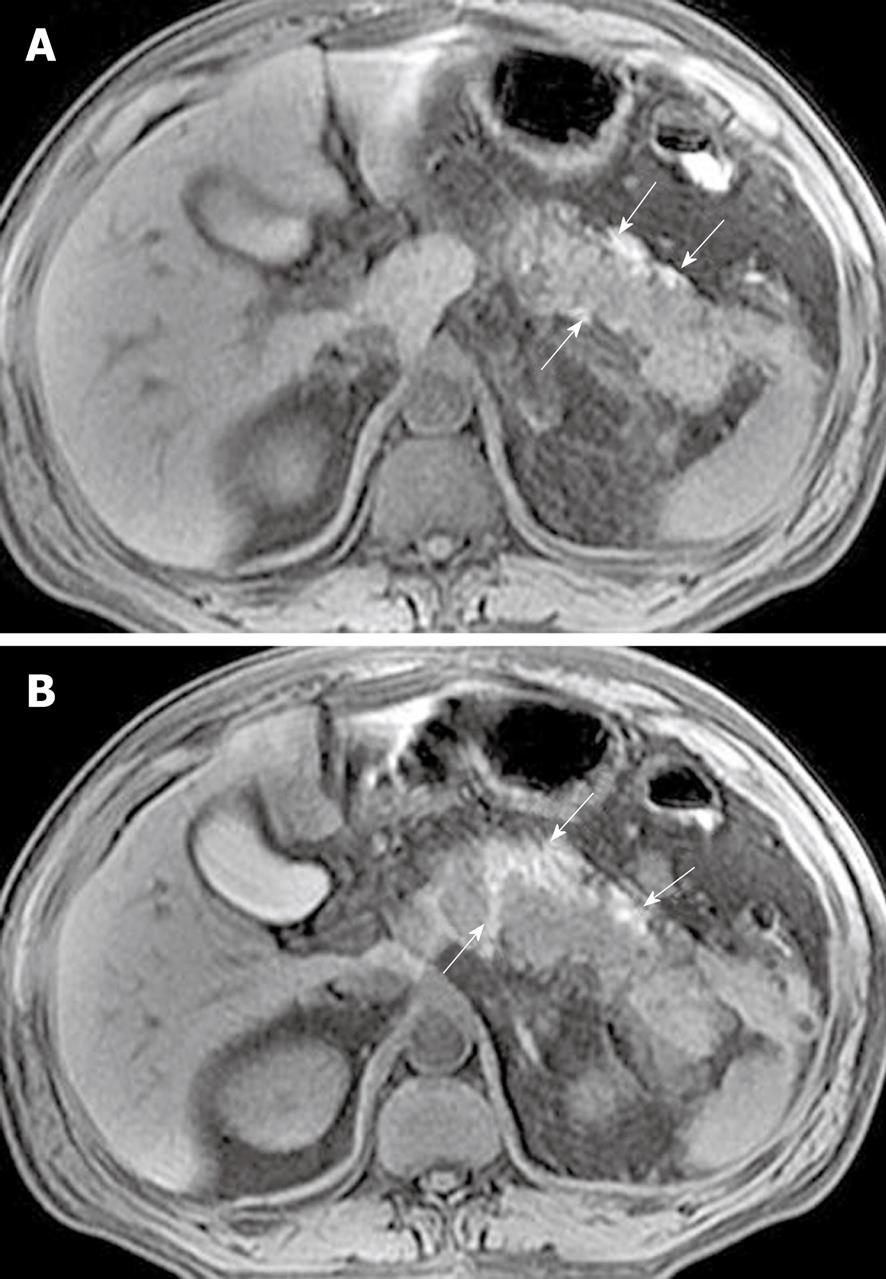
Figure 8 Acute pancreatitis in a 50-year-old man.
Axial non-enhanced magnetic resonance T1-weighted with fat-suppression images (A, B) reveal areas of pancreatic and peripancreatic hemorrhage. Hemorrhage involvement adjacent to the pancreas exhibits threadlike, girdle-shaped hyperintense areas (arrows).
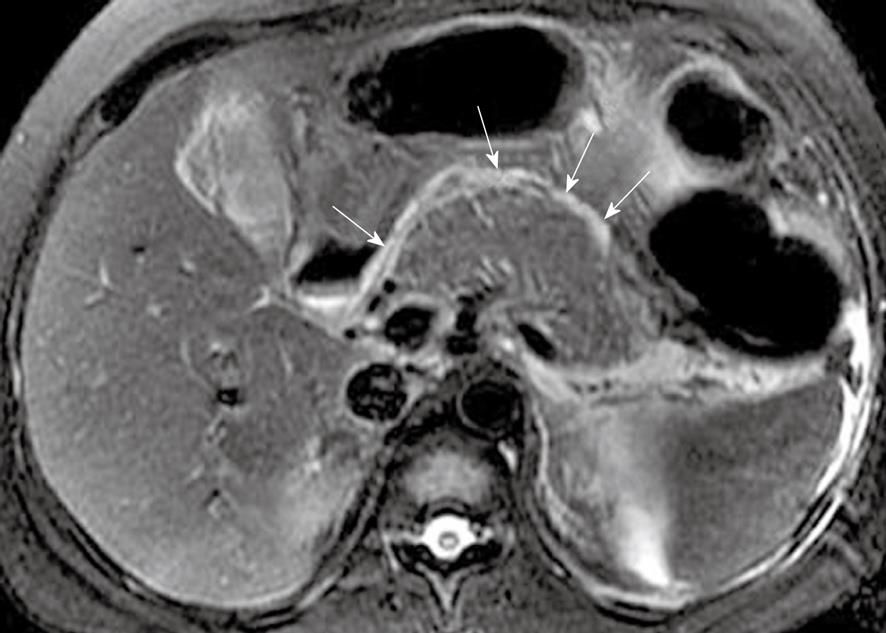
Figure 9 Acute pancreatitis and inflammatory extension to pancreatic capsule in a 42-year-old man.
Axial magnetic resonance T2-weighted with fat-suppression image shows thickening of pancreatic capsule co-existing with subcapsular fluid collections with threadlike or strip-line hyperintense (arrows).
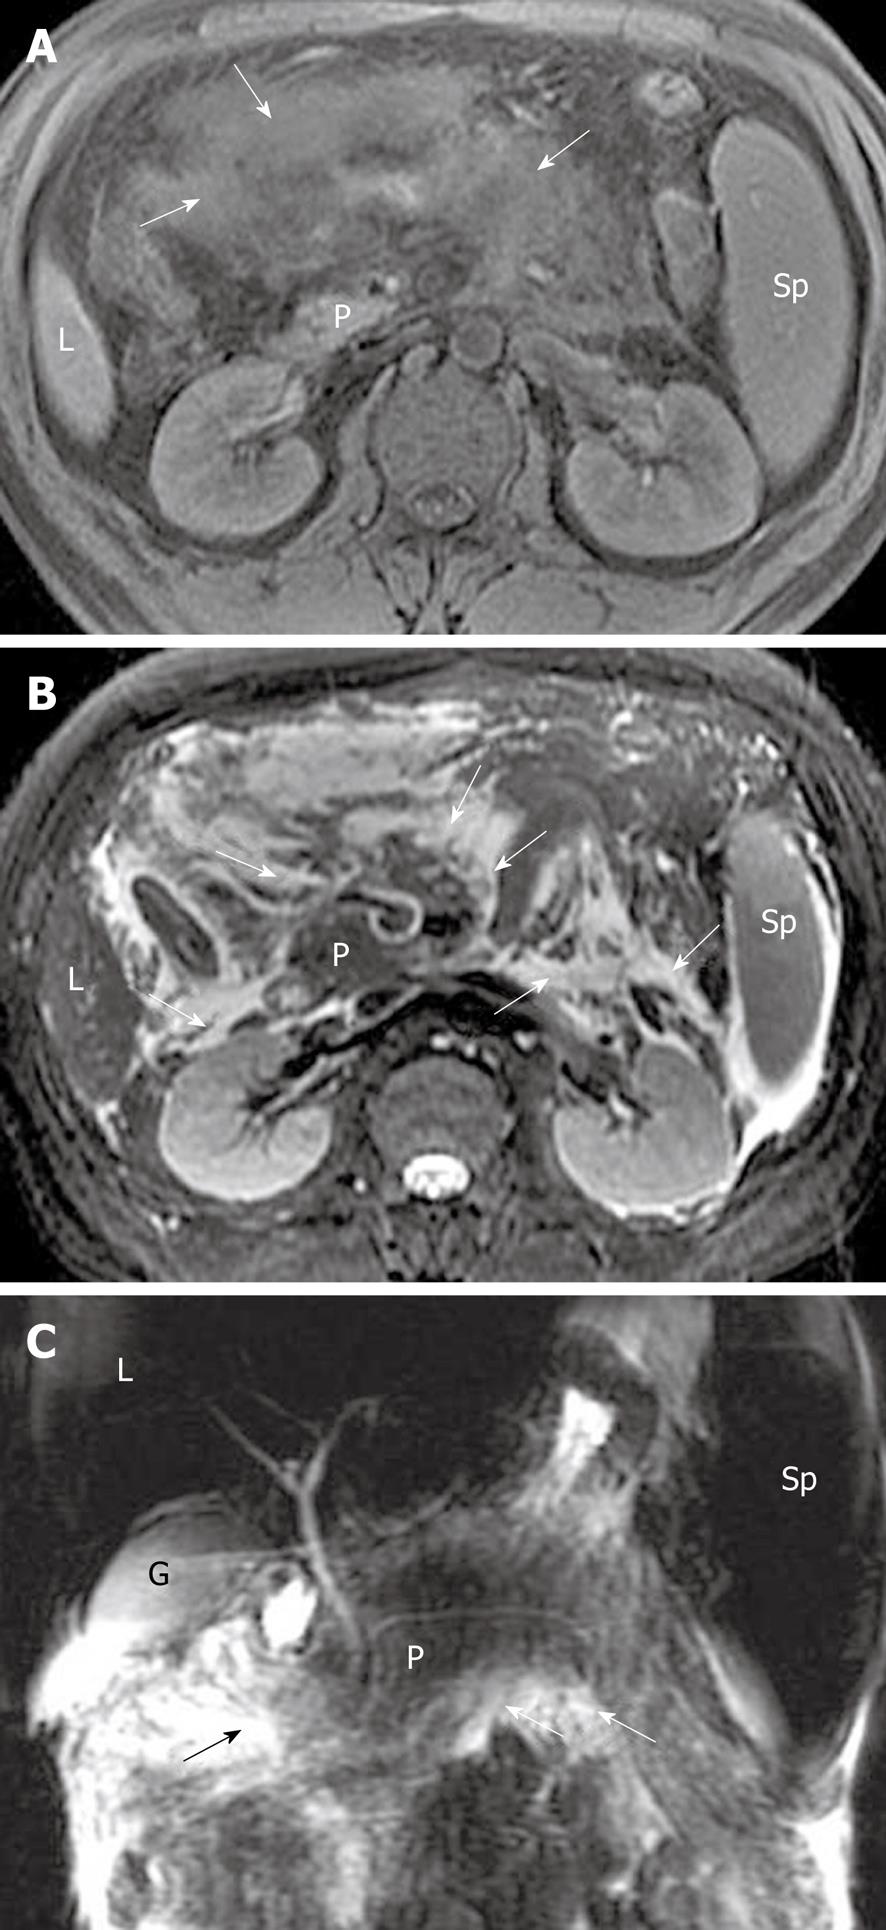
Figure 10 Acute pancreatitis in a 34-year-old man.
Axial magnetic resonance (MR) T1-weighted with fat-suppression (A) and T2-weighted with fat-suppression (B) images reveal peripancreatic inflammation extension co-existing with fat necrosis (arrows) in mesenteric fat tissue regions and anterior pararenal space of both kidneys. Extravasated fluid (arrows) is also present around the gland on MR cholangiopancreatography (C). L: Liver; P: Pancreas; Sp: Spleen; G: Gallbladder.
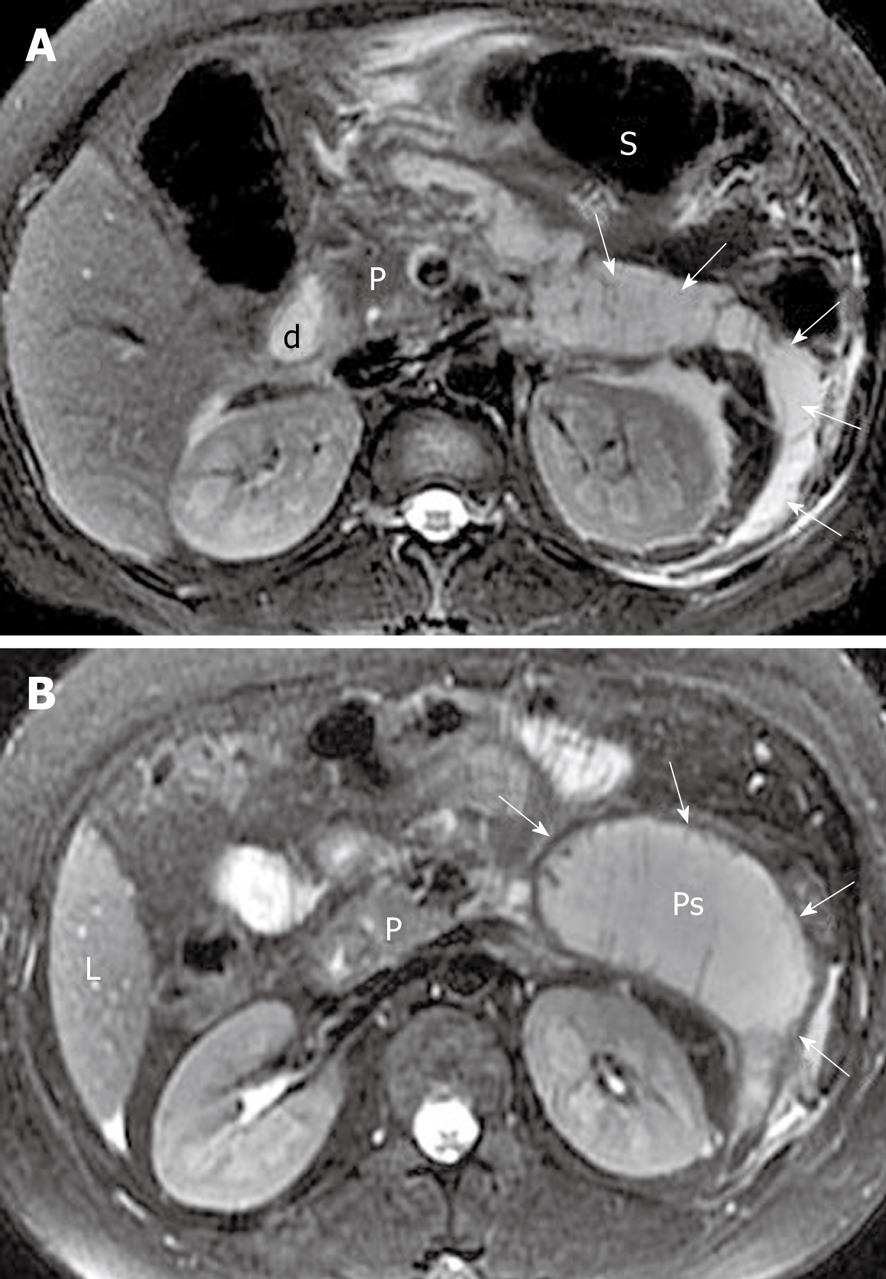
Figure 11 Acute pancreatitis and peripancreatic and retroperitoneal fluid collections in a 42-year-old man.
A: Axial magnetic resonance T2-weighted with fat-suppression image obtained at the time of hospital admission shows large heterogeneous fluid collections (arrows) associated with areas of tissue liquified necrosis in the pararenal space of the left kidney; B: Follow-up axial T2-weighted with fat-suppression image reveals an encapsulated fluid collection (arrows) in the process of the development of a pseudocyst. L: Liver; P: Pancreas; S: Stomach; d: Duodenal bulb; Ps: Pseudocyst.
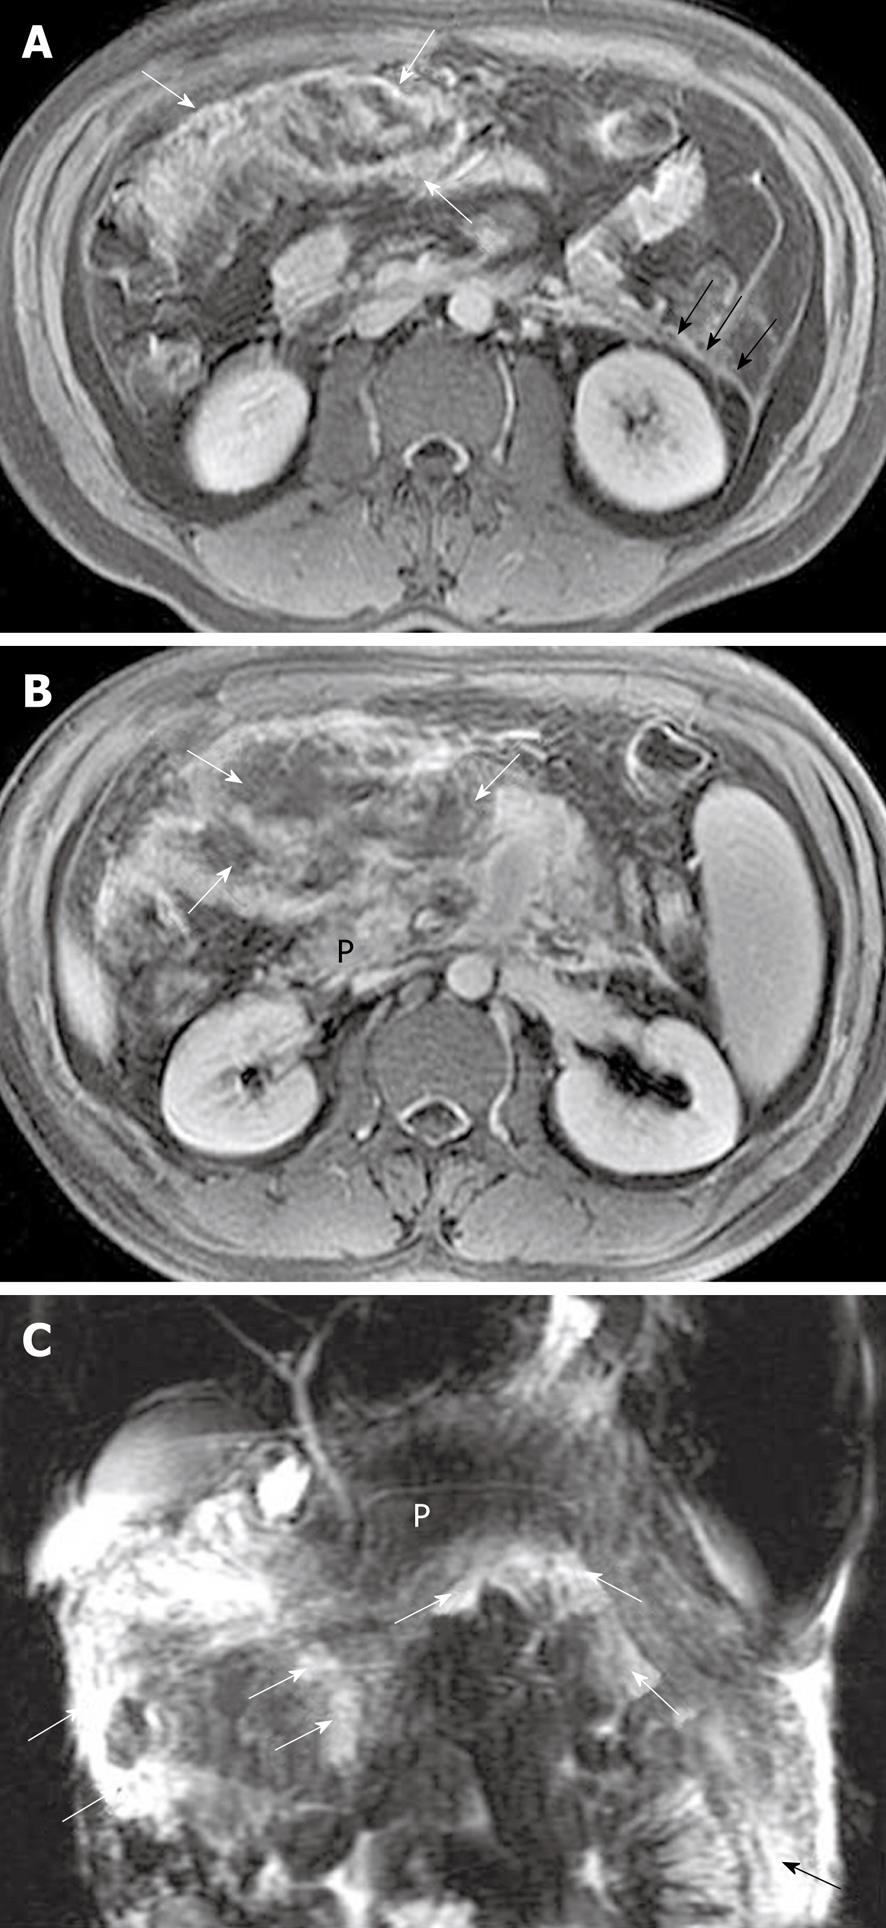
Figure 12 Pancreatic focal necrosis in a 35-year-old man after an episode of acute pancreatitis.
A, B: Enhanced axial T1-weighted images reveal the irregular thickening and heterogeneous enhancement of the intestinal wall (white arrows in A), anterior fascia of the left kidney (black arrows in A), and mesenteric edema associated with fat necrosis (arrows in B); C: Magnetic resonance cholangiopancreatography reveals multiple edema and small fluid collections (arrows) adjacent to small intestine and colon. P: Pancreas.
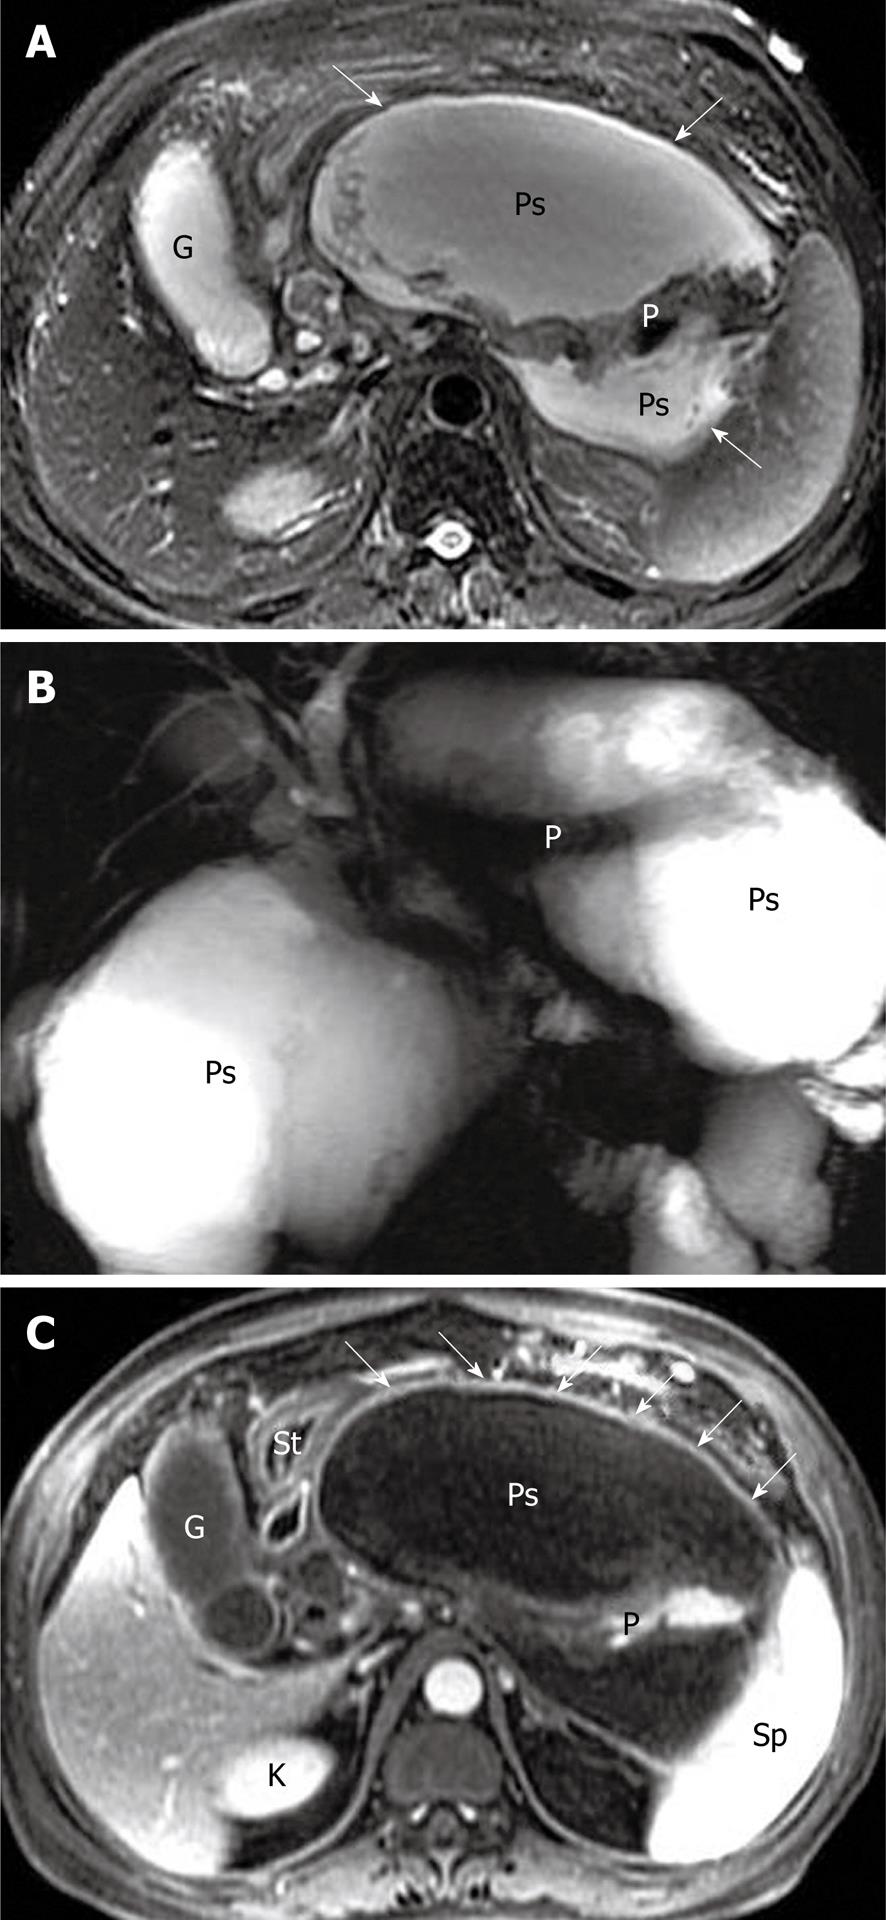
Figure 13 A large peripancreatic pseudocyst in a 41-year-old man who present as abdominal distension after acute post-necrotic pancreatitis.
Axial magnetic resonance (MR) T2-weighted with fat-suppression image (A) and MR cholangiopancreatography (B) show a large pseudocyst (arrows) with homogeneous hypersignal intensity around the pancreas. Axial T1-weighted image obtained with intravenous contrast material (C) reveals the enhancement of the thick wall (arrows) of the pseudocyst. The extrusion and displacement of the stomach (St) is seen due to the tension of the pseudocyst. G: Gallbladder; P: Pancreas; Ps: Pseudocyst; K: Kidney; Sp: Spleen; St: Stomach.
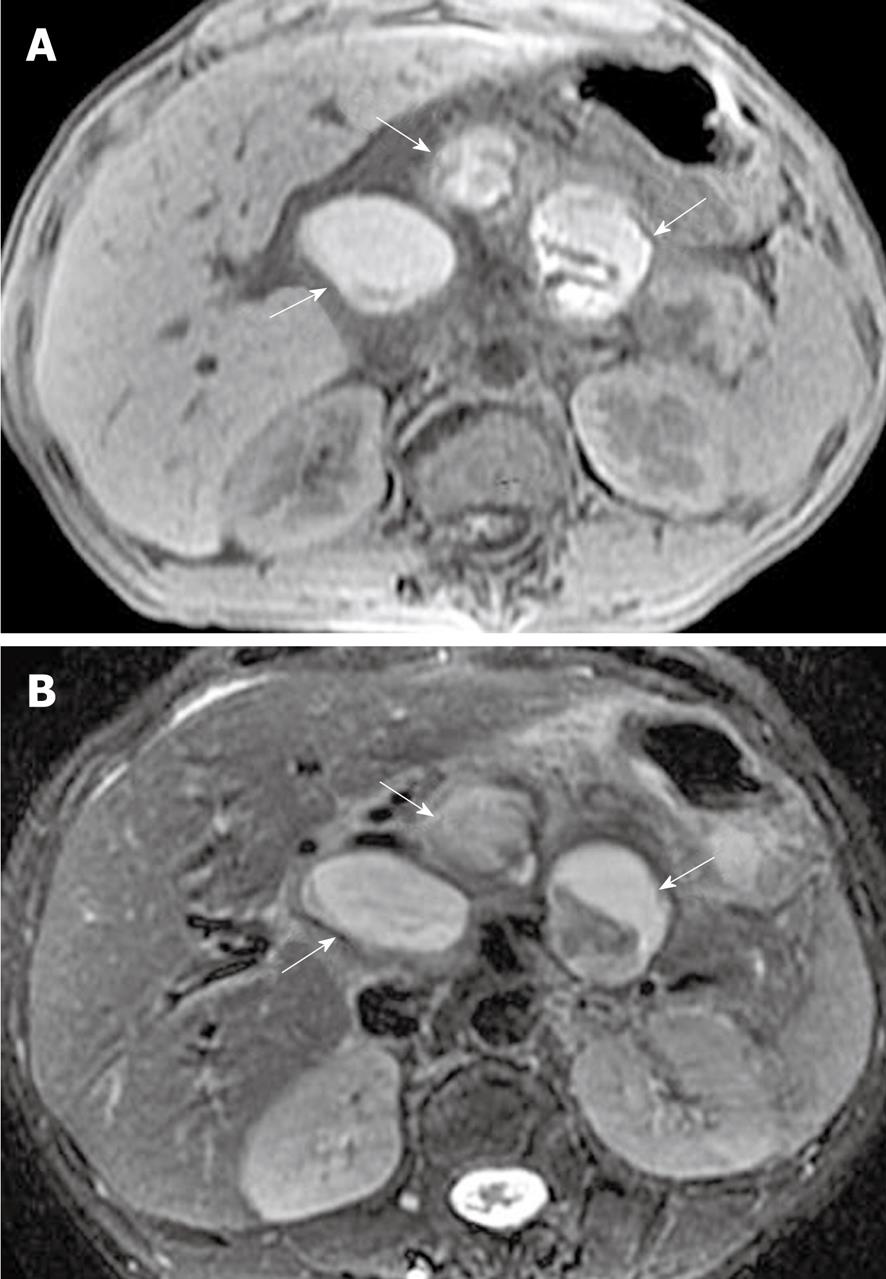
Figure 14 Multiple pseudocysts complicated hemorrhage in a 36-year-old man who had previously suffered from acute pancreatitis.
Axial non-enhanced magnetic resonance T1-weighted with fat-suppression (A) and axial T2-weighted with fat-suppression (B) images reveal multiple hemorrhagic pseudocysts (arrows) with heterogeneous signal intensity.
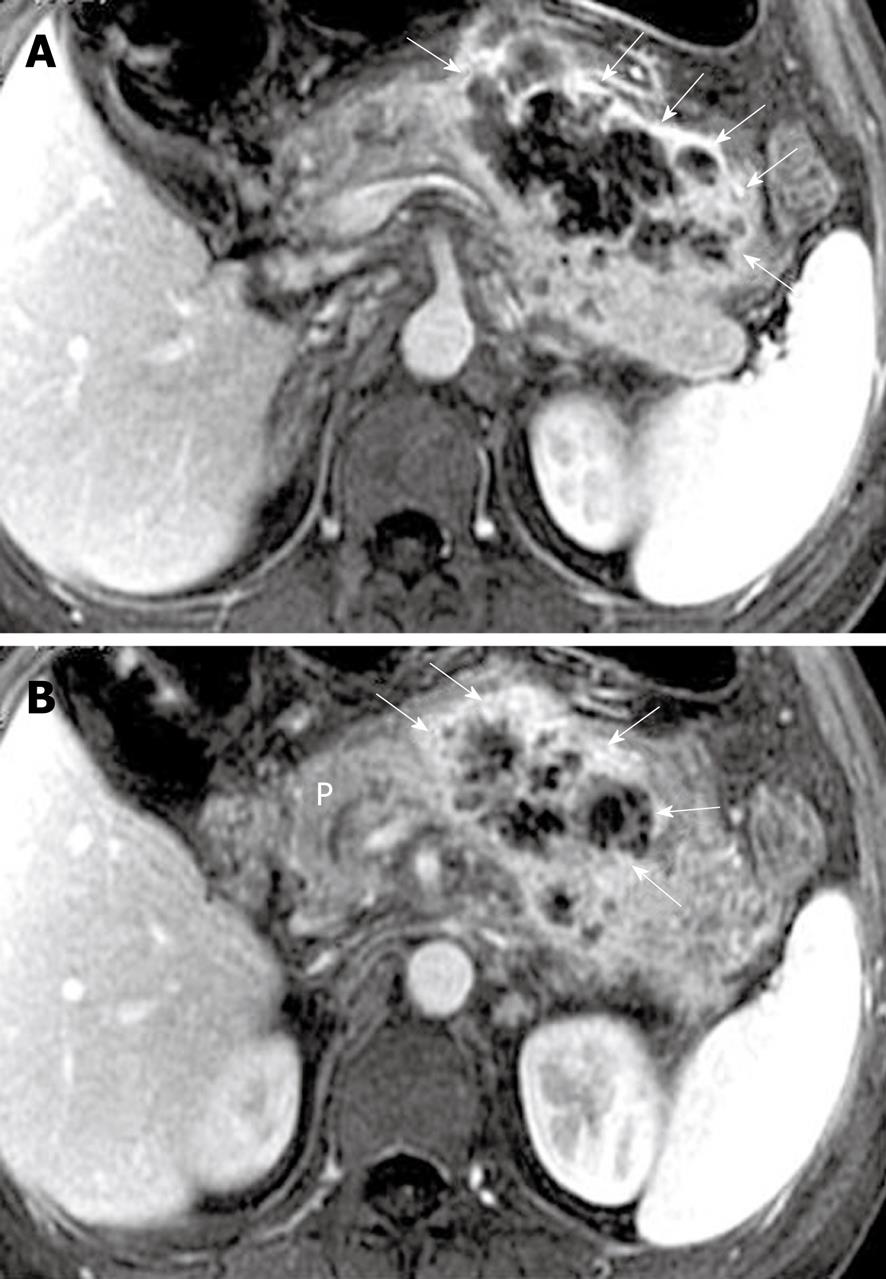
Figure 15 Acute necrotic pancreatitis and peripancreatic cellulitis in a 39-year-old man.
A, B: Axial magnetic resonance T1-weighted images obtained with intravenous contrast material reveal an ill-defined, multilocular, inflammatory mass (arrows) with ring-like and separated enhancement adjacent to the body and tail of the pancreas. P: Pancreas.
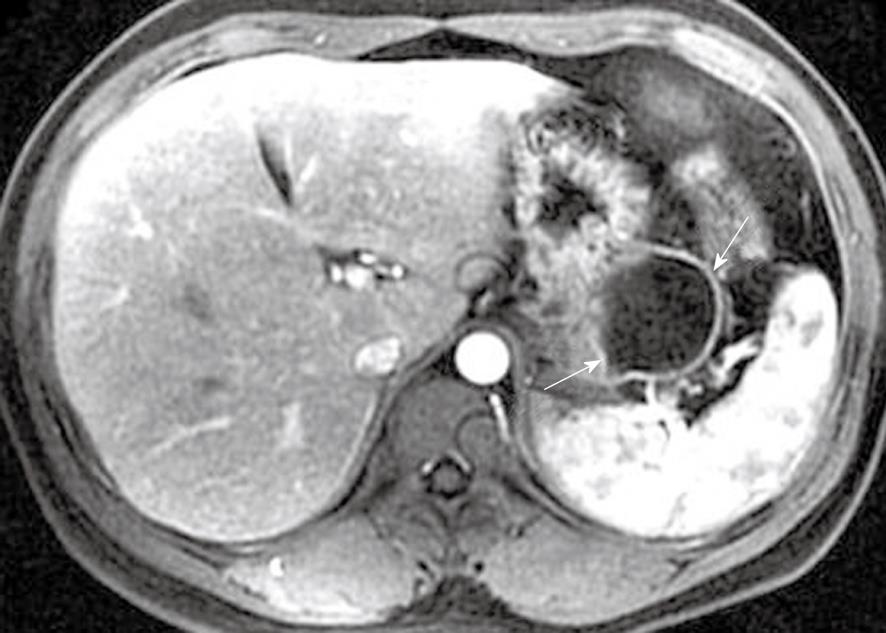
Figure 16 Extrapancreatic abscess confirmed by a surgical operation in a 33-year-old man after acute post-necrotic pancreatitis.
Axial magnetic resonance T1-weighted image with fat suppression obtained with intravenous contrast material shows an encapsulated liquid collection (arrows) with a well-defined, thickened and enhancing wall.
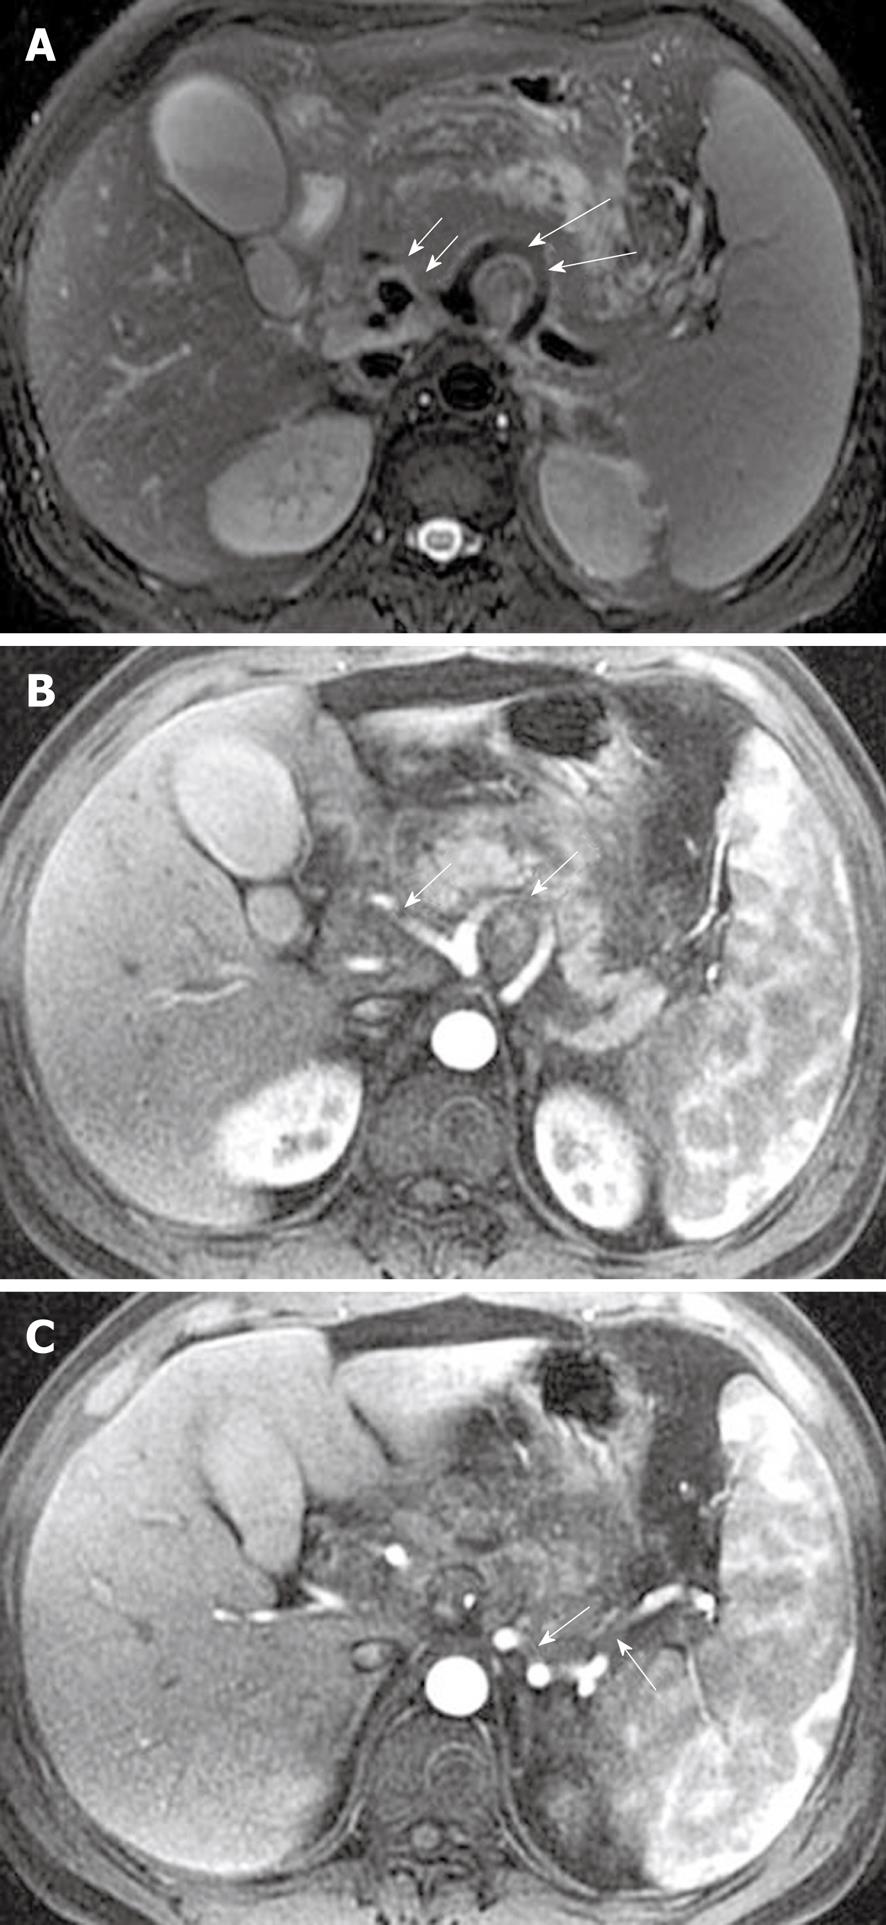
Figure 17 Artery involvement and vasculitis in a 30-year-old man after an episode of acute pancreatitis.
A: Axial magnetic resonance T2-weighted with fat-suppression image shows the loss of vascular flow voiding effect of the involved parts of the common hepatic artery (small arrows) and splenic artery (large arrows); B, C: Axial contrast-enhanced T1-weighted images obtained in arterial phase reveal the poor enhancement of the involved parts of these arteries (arrows) associated with the obscure and rough edges.
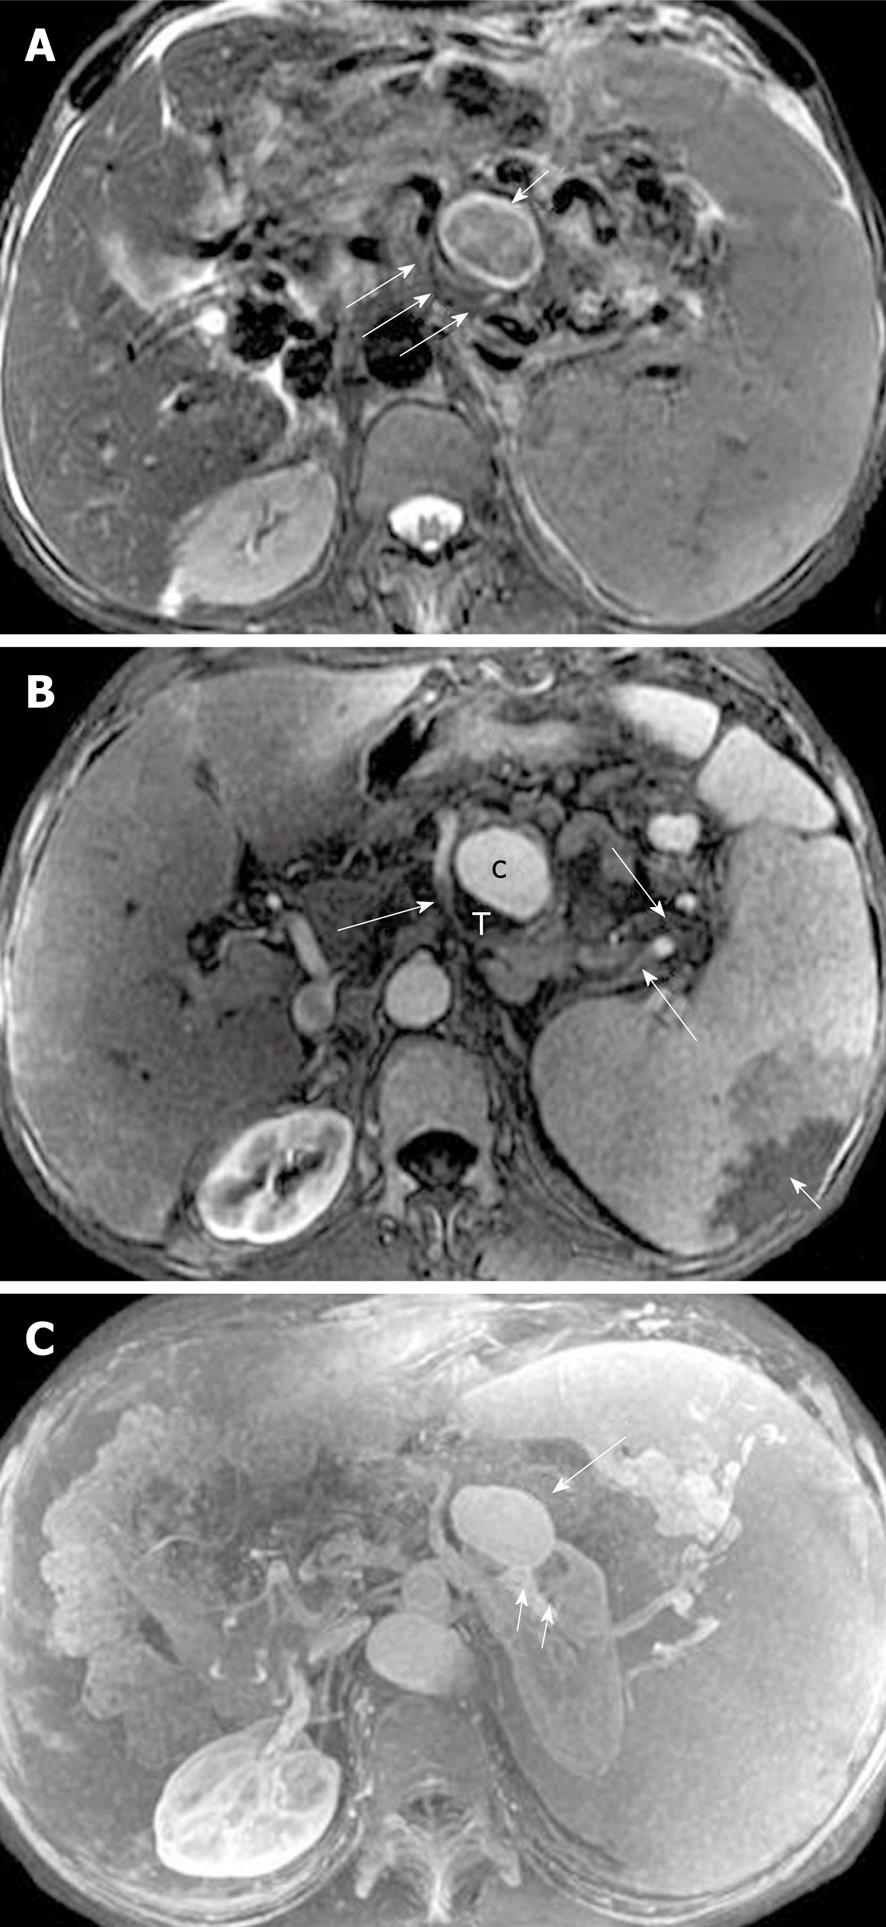
Figure 18 Splenic artery pseudoaneurysm in a 36-year-old man with a history of acute pancreatitis.
A: Axial magnetic resonance (MR) T2-weighted with fat-suppression image shows the involved part of the splenic artery (large arrows) and aneurysmal dilatation (small arrows); B: Axial T1-weighted image obtained with intravenous contrast material reveals enhancement of the pseudoaneurysm cavity (c) and a filling defect present as mural thrombosis (T), and wedge-shape zones of infarction of the spleen (small arrows) due to the involved parts of the splenic artery (large arrows); C: MR angiography further depicts the visualization of the relationship between this pseudoaneurysm (large arrow) and the involved splenic artery (small arrows). c: Cavity of the pseudoaneurysm; T: Mural thrombosis in the pseudoaneurysm.
Figure 19 Acute pancreatitis with splenic venous thrombosis in a 30-year-old man.
Axial magnetic resonance T1-weighted image obtained with intravenous contrast material during the venous phase reveals the involved parts of splenic vein with intravenous filling defects (arrows).
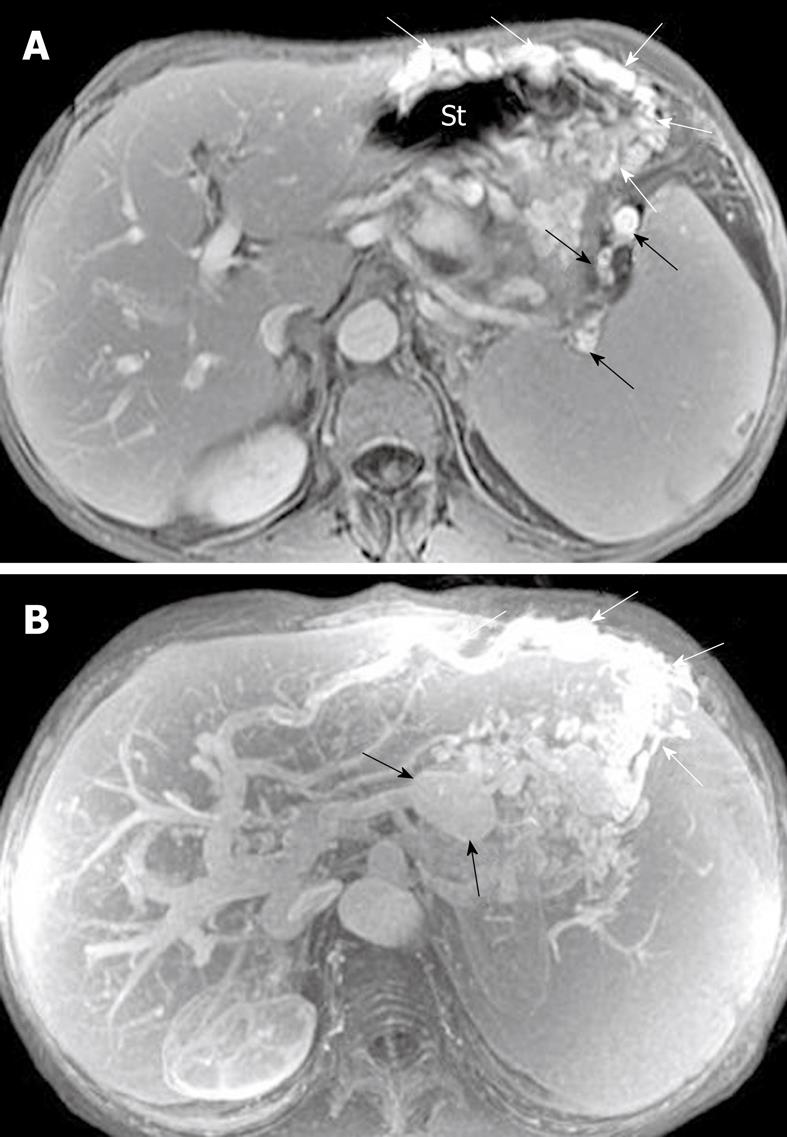
Figure 20 Pancreatic regional portal hypertension in a 36-year-old man with a history of acute pancreatitis.
A: Axial T1-weighted image obtained with intravenous contrast material reveals enhancement of numerous and circuitous veins (white arrows) around the gastric fundus, and splenic veins (black arrows) adjacent to the splenic hilum; B: Magnetic resonance angiography depicts the establishment of numerous and conspicuous collateral vessels due to gastric fundic varices (white arrows) and a pseudoaneurysm (black arrows). St: Stomach.
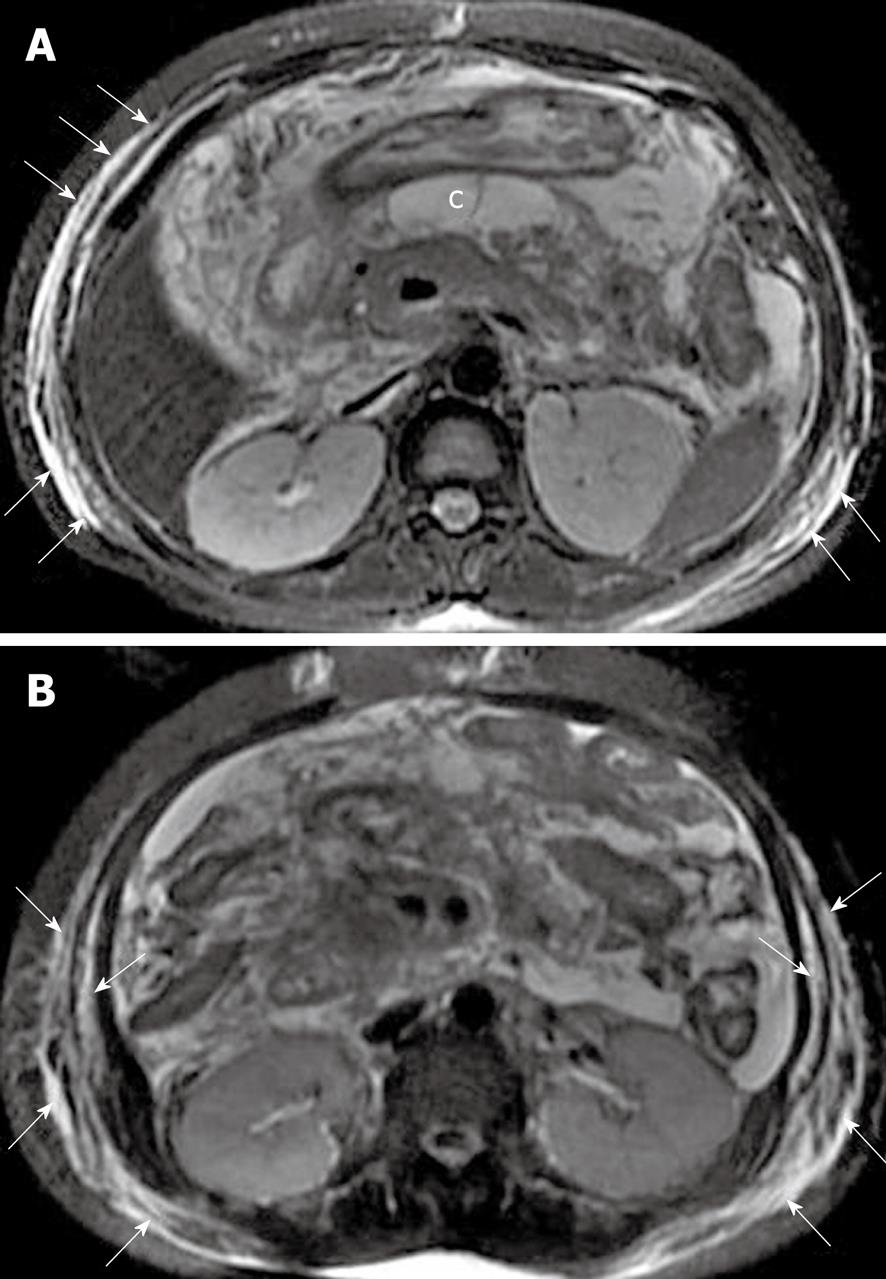
Figure 21 Subcutaneous and intermuscular involvement in a 38-year-old woman after an episode of acute pancreatitis.
A, B: Axial magnetic resonance T2-weighted with fat-suppression images obtained at the time of hospital admission show oval fluid collections (c) in the omental bursa, and bilateral subcutaneous and intermuscular fat edema with hyperintensity (arrows). c: Fluid collections.
- Citation: Xiao B, Zhang XM. Magnetic resonance imaging for acute pancreatitis. World J Radiol 2010; 2(8): 298-308
- URL: https://www.wjgnet.com/1949-8470/full/v2/i8/298.htm
- DOI: https://dx.doi.org/10.4329/wjr.v2.i8.298


