Copyright
©2010 Baishideng Publishing Group Co.
World J Radiol. Apr 28, 2010; 2(4): 135-142
Published online Apr 28, 2010. doi: 10.4329/wjr.v2.i4.135
Published online Apr 28, 2010. doi: 10.4329/wjr.v2.i4.135
Figure 1 Depth dose curves for photons and protons.
Notice the exponential tail seen in the photon curve that results in dose deposition through the entire patient. The proton curve shows that there is no dose deposition after the Bragg peak.
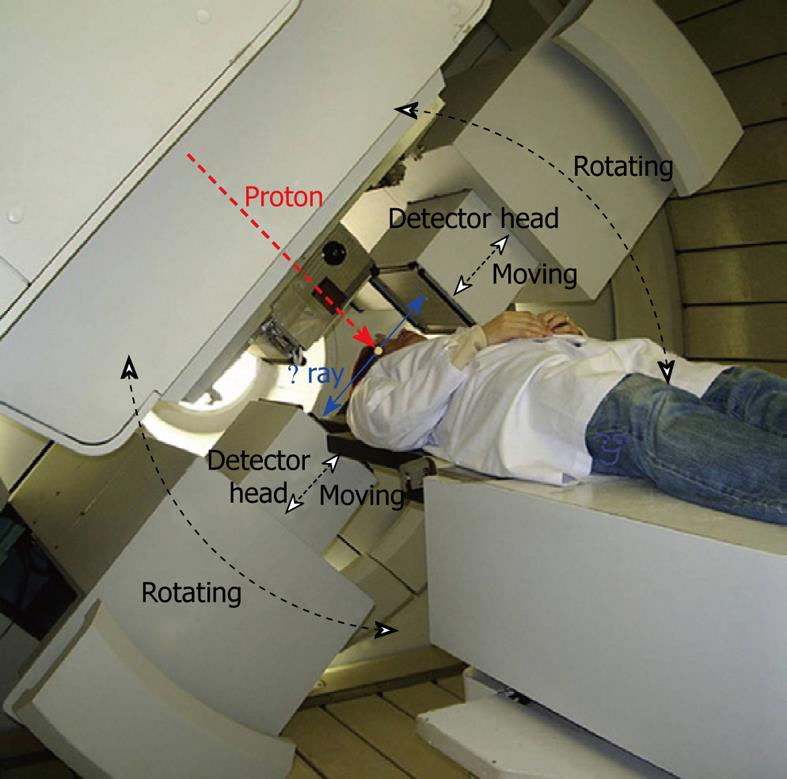
Figure 2 Setup of the on-line positron emission tomography (PET) system mounted on the rotating proton gantry.
The proton beam direction is shown by the red line and the direction of the detected annihilation photons is shown in blue. (Reprinted from[24] with permission from Elsevier Limited).
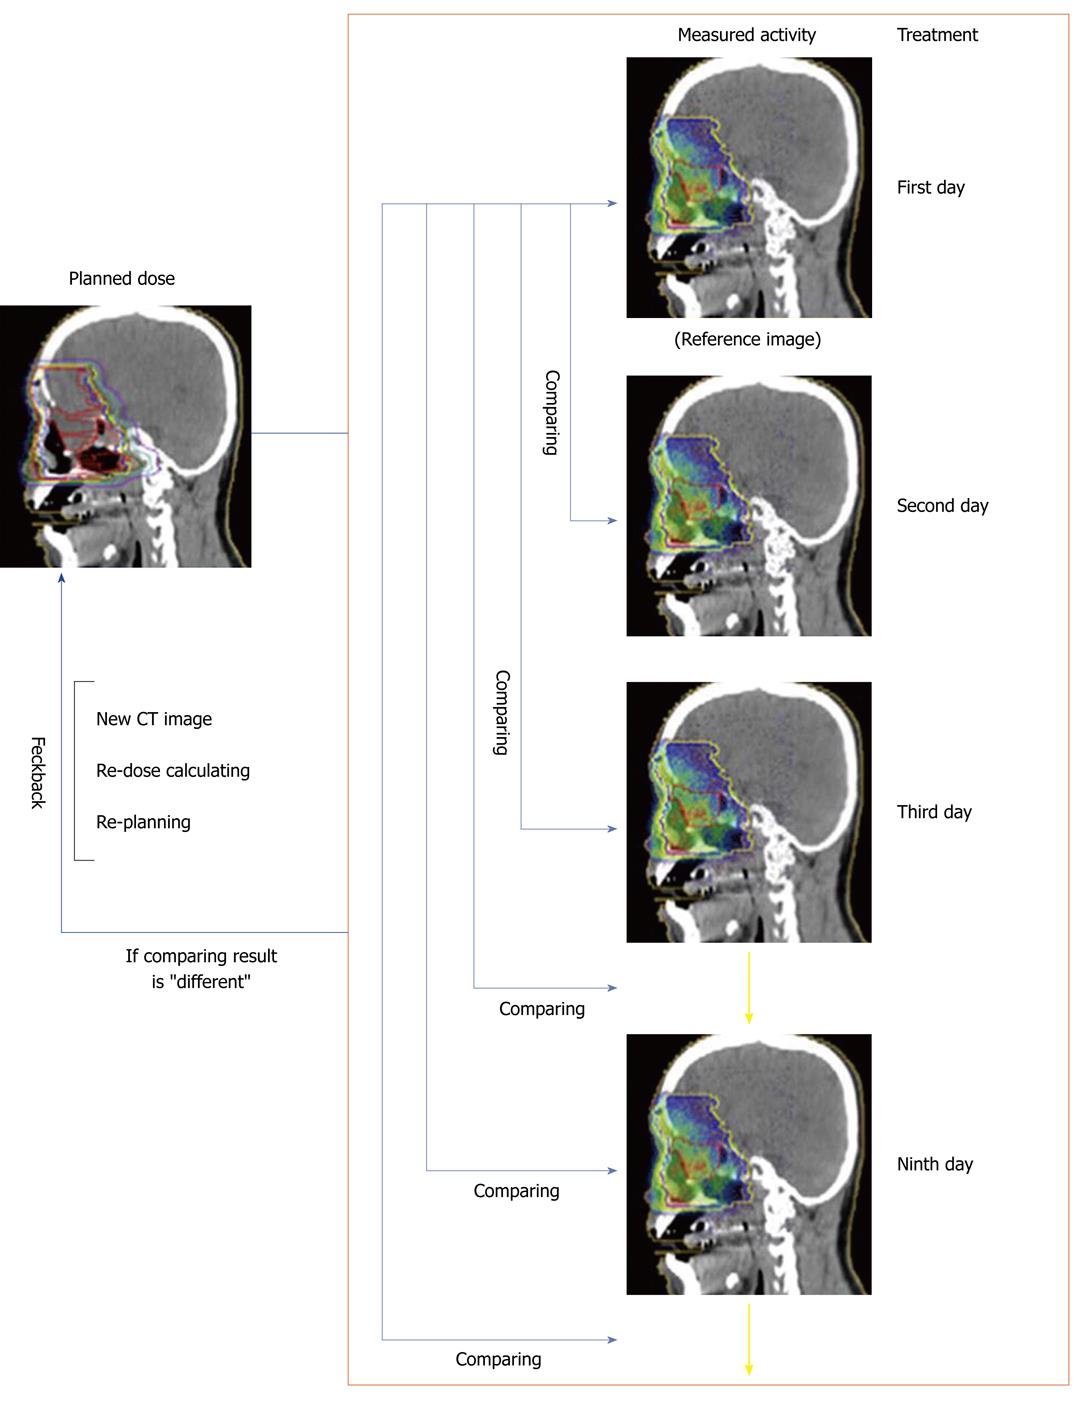
Figure 3 Flow diagram of the procedure for the clinical use of an on-line PET system (Reprinted from[24] with permission from Elsevier Limited).
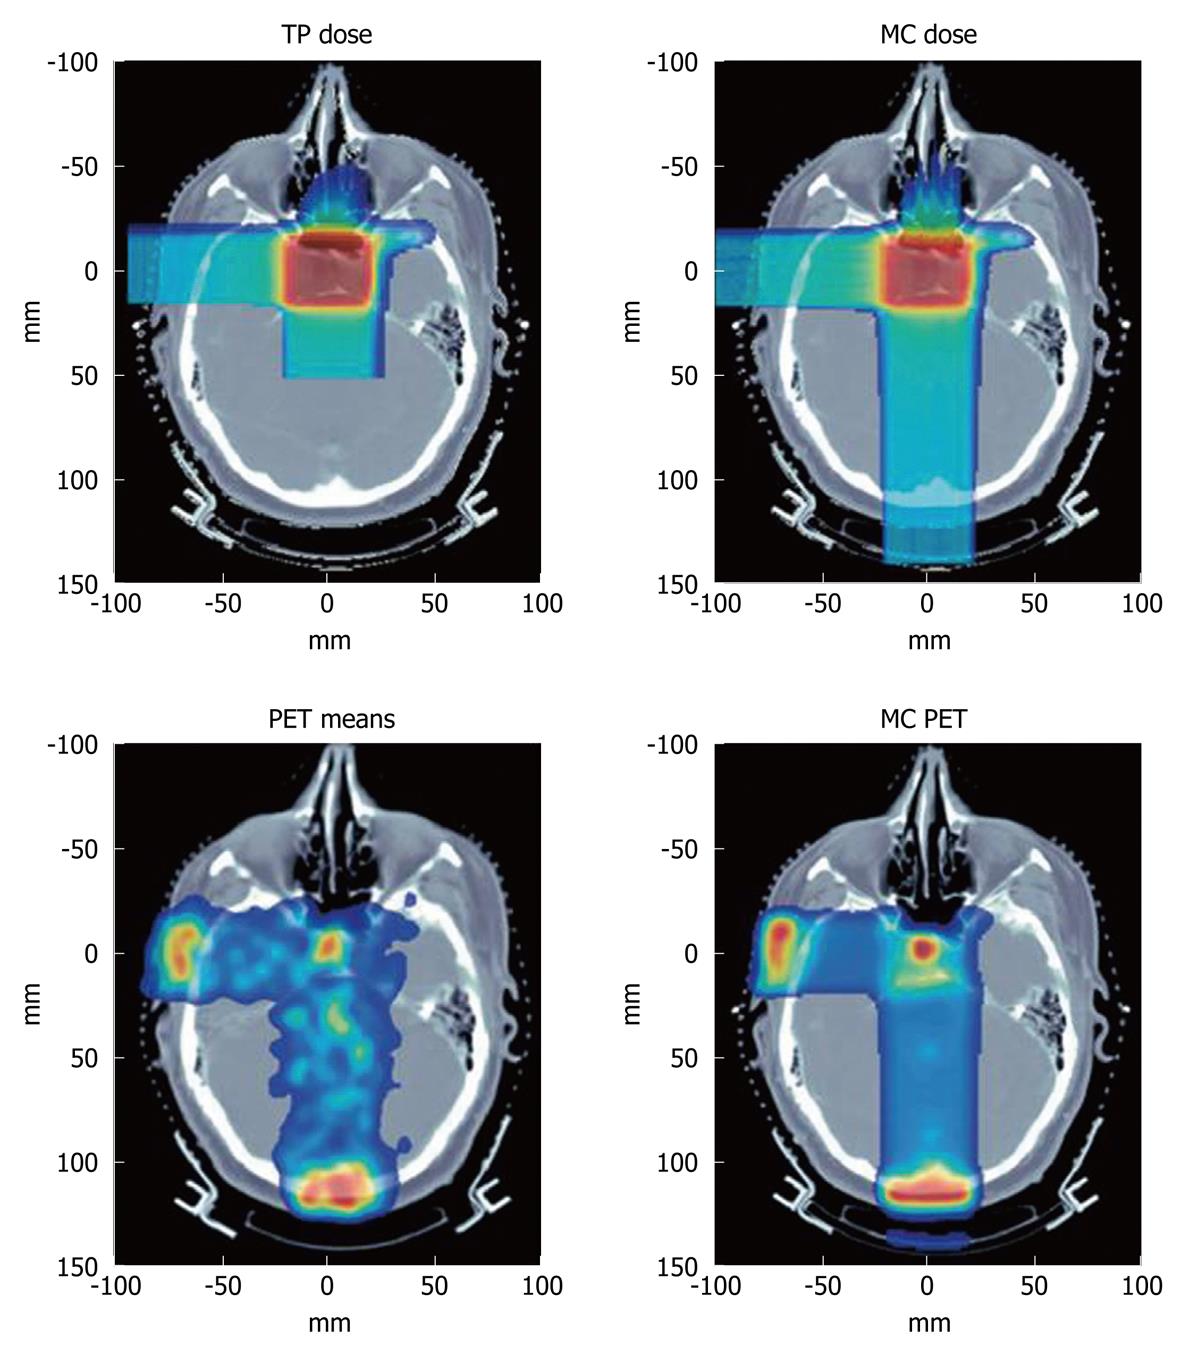
Figure 4 Top: Treatment plan (TP) and Monte Carlo (MC) dose for a patient with pituitary adenoma receiving two orthogonal fields.
Bottom: Measured and Monte Carlo PET images. Delay times from the beginning of imaging were about 26 and 18 min from the end of the first and second field applications, respectively. Range of color wash is from blue (minimum) to red (maximum) (Reprinted from[34] with permission from Elsevier Limited).
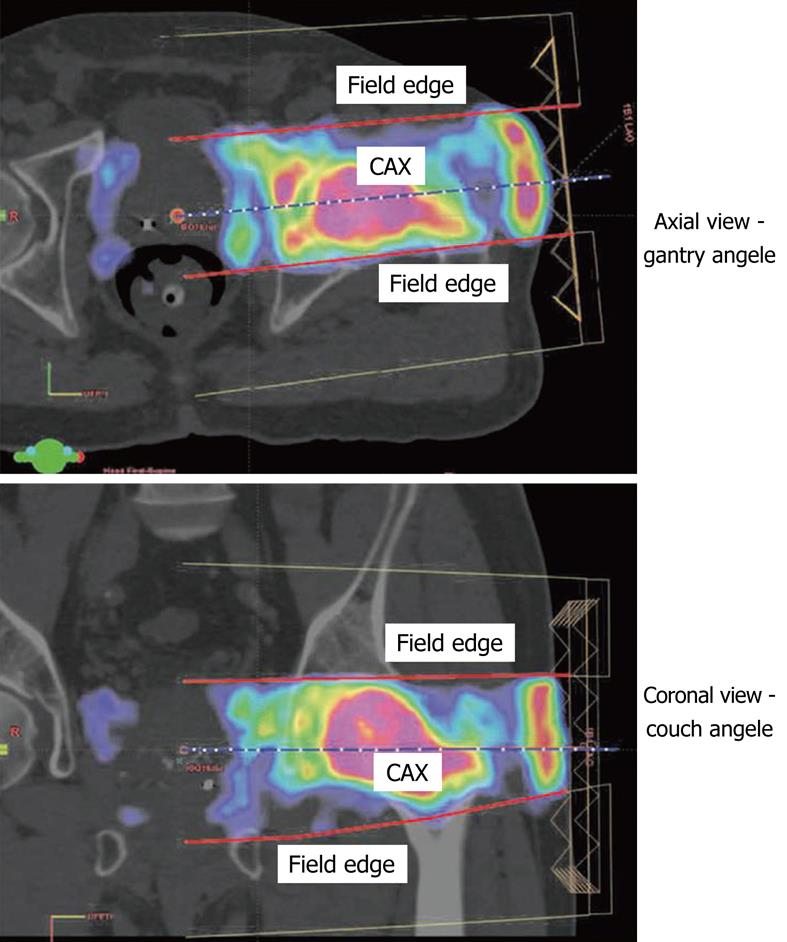
Figure 5 Registered PET images are shown in the axial and coronal views through the prostate.
The PET images are fused with the planning computed tomography (CT). The CAX is the central beam axis. The field edge is only extended to the isocenter as provided by the TPS. The isocenter in the lateral direction was set to be the location of the marker-defined path. Good alignment between the field edge and the outer surface of the emitter distribution suggests that no prostate motion occurred after proton beam delivery (Reprinted from[36] with permission from Medical Physics).
- Citation: Studenski MT, Xiao Y. Proton therapy dosimetry using positron emission tomography. World J Radiol 2010; 2(4): 135-142
- URL: https://www.wjgnet.com/1949-8470/full/v2/i4/135.htm
- DOI: https://dx.doi.org/10.4329/wjr.v2.i4.135


