Copyright
©2010 Baishideng Publishing Group Co.
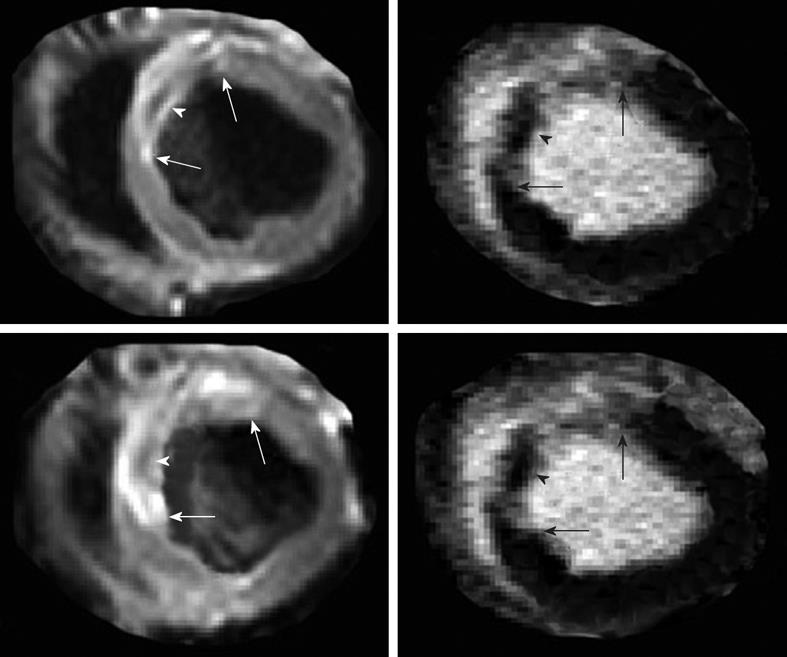
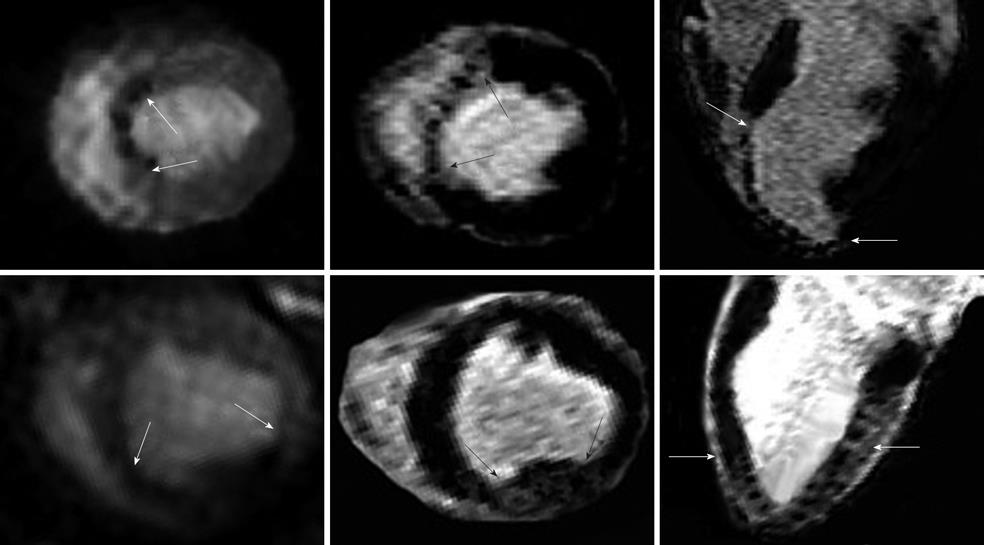
Figure 1 Multi-slice T2-weighted turbo spin echo imaging demonstrates the hyperintense edematous area at risk (white arrows in the left images) with hypoenhanced zone, which may represent microvascular and/or interstitial hemorrhage zone (arrowhead in the left images).
Delayed contrast enhancement magnetic resonance (DE-MR) imaging confirmed the presence of microvascular and/or interstitial hemorrhage zone in the core (black arrowhead in the right images) of hyperenhanced infarcted myocardium (black arrows in the right images).
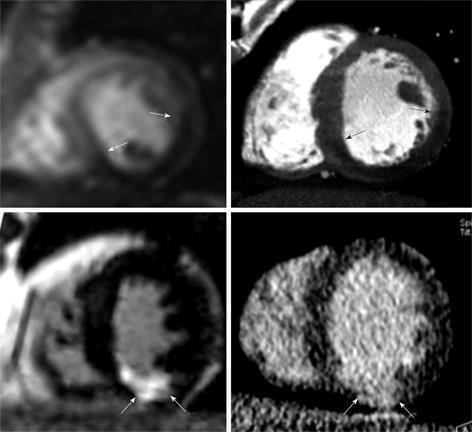
Figure 2 Head-to-head comparison between first pass perfusion MR (top left) and first pass multi-detector computed tomography (MDCT) imaging (top right) in a 42-year-old man with acute reperfused infarct.
Ischemic myocardium (arrows) appears as a hypoenhanced region with comparable extent on both imaging modalities. Bottom: Head-to-head comparison of DE-MR (bottom left) and DE-MDCT imaging (bottom right) shows a bright region comparable in size to enhanced inferior infarct (arrows). Note that the enhanced infarct on DE-imaging is substantially smaller than ischemic myocardium[38].
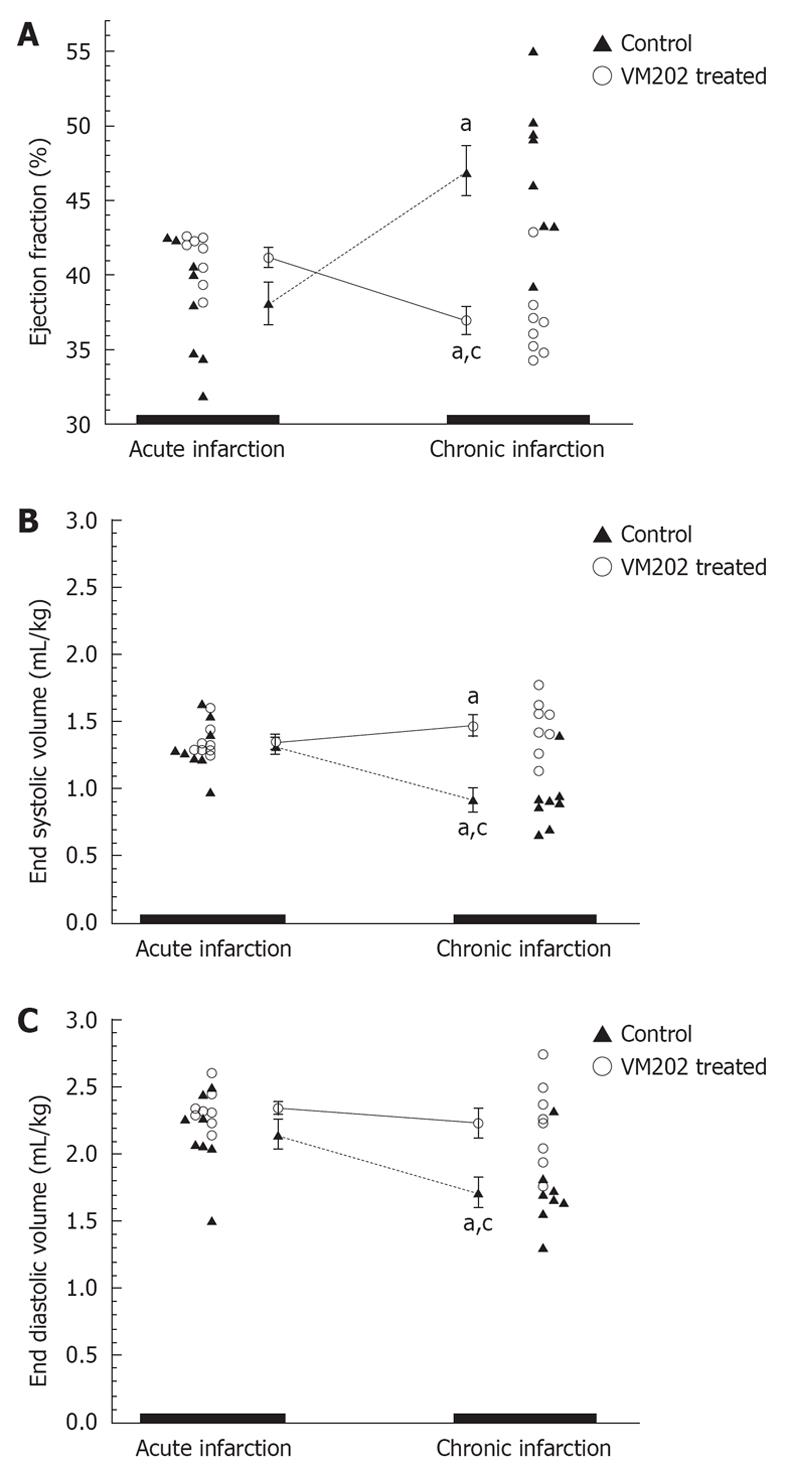
Figure 3 The ejection fraction (A), end systolic volumes (B) and end diastolic volumes (C) are shown for control and hepatocyte growth factor gene (VM202) treated animals.
The hepatocyte growth factor gene administered at 3 d after reperfusion significantly decreased end diastolic (mL/kg) and end systolic volumes at 8 wk compared to 3 d infarct (aP < 0.05) and control group (cP < 0.05). Control animals at 8 wk showed a significant decrease in ejection fraction and significant increase in end systolic and end diastolic volumes compared with 3 d infarct[59].
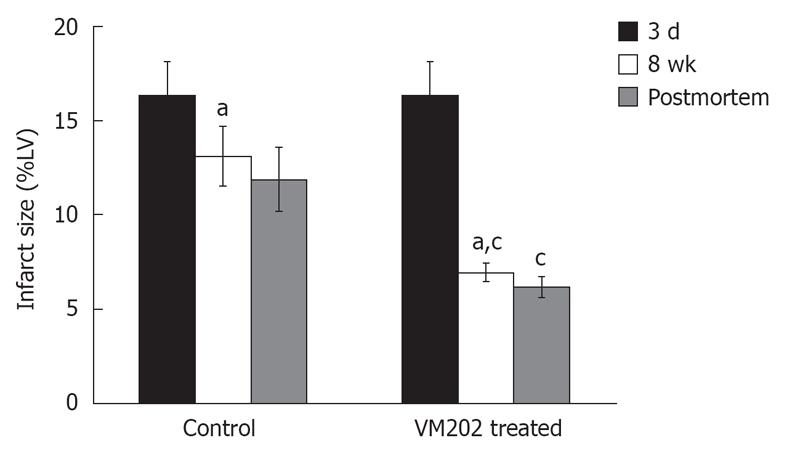
Figure 4 Histogram shows the difference in infarct size prior to intramyocardial gene delivery at 3 d and 8 wk after infarction in control animals (left block) and animals treated with hepatocyte growth factor gene (VM202) (right block) measured on DE-MR imaging (black and white bars) and postmortem (gray bars).
Note the decline in infarct size was greater in gene treated animals compared with control animals. aP < 0.05 compared with 3 d acute infarction. cP < 0.05 compared with 8 wk chronic infarction in control animals. %LV: Percentage of LV mass[59].
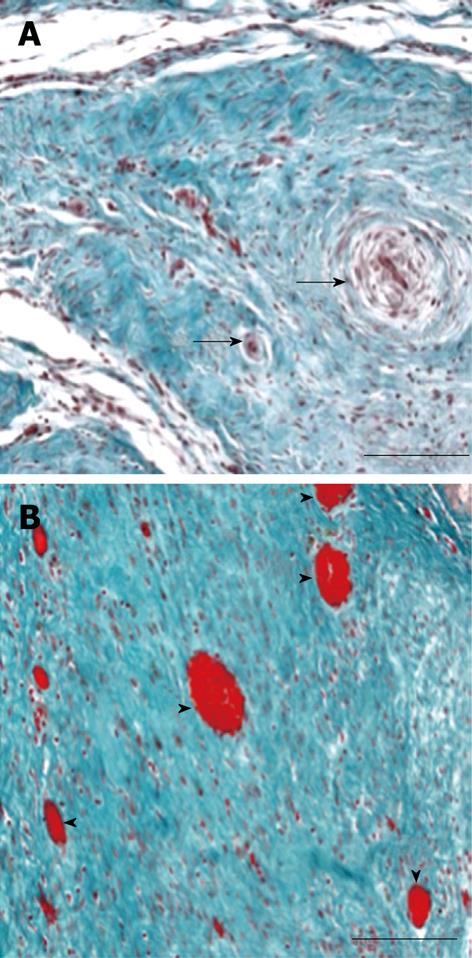
Figure 5 Micrographs of representative infarcts in control and VEGF-gene treated swine.
A: The infarct in the control animal shows no appreciable angiogenesis and residual blood vessels have been remodeled, as shown by the thick vascular wall and small lumen (black arrows). B: VEGF-gene treated animal contains numerous blood vessels (arrowheads) in linear array representing injection track (calibration bar = 200 μm)[60].
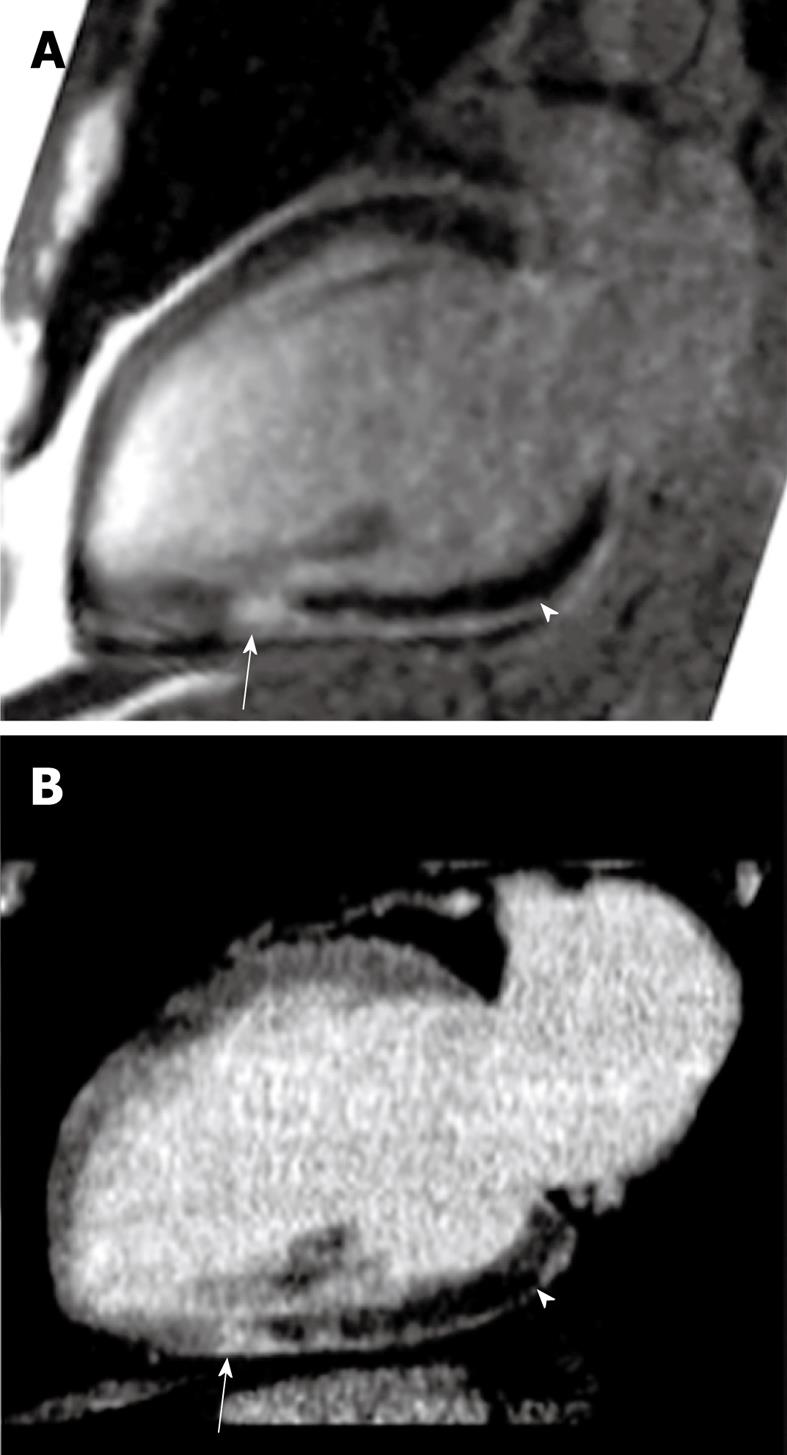
Figure 6 Head-to-head comparison of DE-MR (A) and DE-MDCT images (B) showing the dark MO zone (arrowheads) surrounded by a bright enhanced infarct in a reperfused patient (arrows)[38].
Figure 7 Multislice T2*-weighted (susceptibility) turbo spin echo images show severe interstitial hemorrhage in the core (arrowheads) of the hyperintense edematous area at risk (arrows) 3 d after reperfusion.
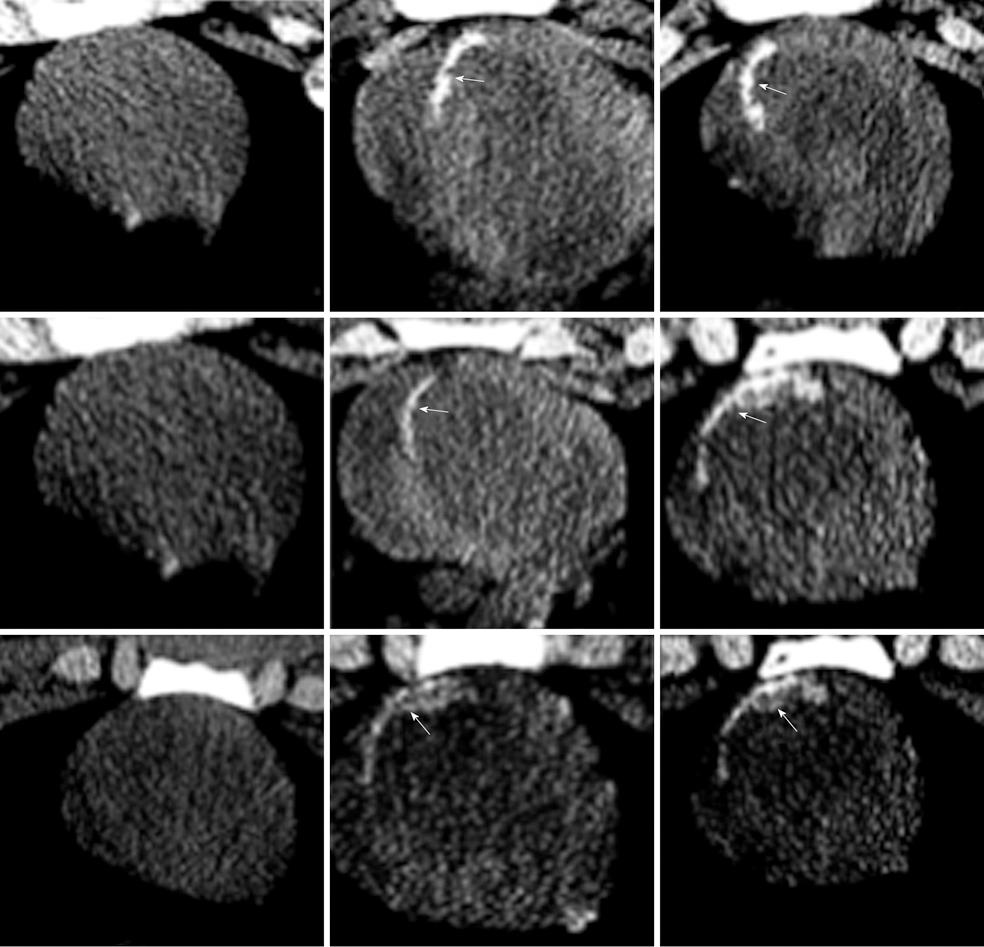
Figure 8 Non-contrast enhanced MDCT imaging demonstrates deposited calcium 7 d after reperfusion (right block arrows).
In all 3 animals (the 3 rows) the deposited calcium was not evident at 2-3 h after reperfusion on non-contrast enhanced MDCT (left block)[102].
Figure 9 Histopathology from at 1-wk-old reperfused infarct shows calcium deposits as a black-brown precipitation product (arrows) on Masson trichrome (A) and the special calcium stain (von Kossa stain) (B).
At 8 wk the stain shows traces of calcium deposits (C, arrow) surrounded by giant cell (arrowhead). Apparently the giant macrophages digest deposited calcium (calibration bars = 20 mm)[102].
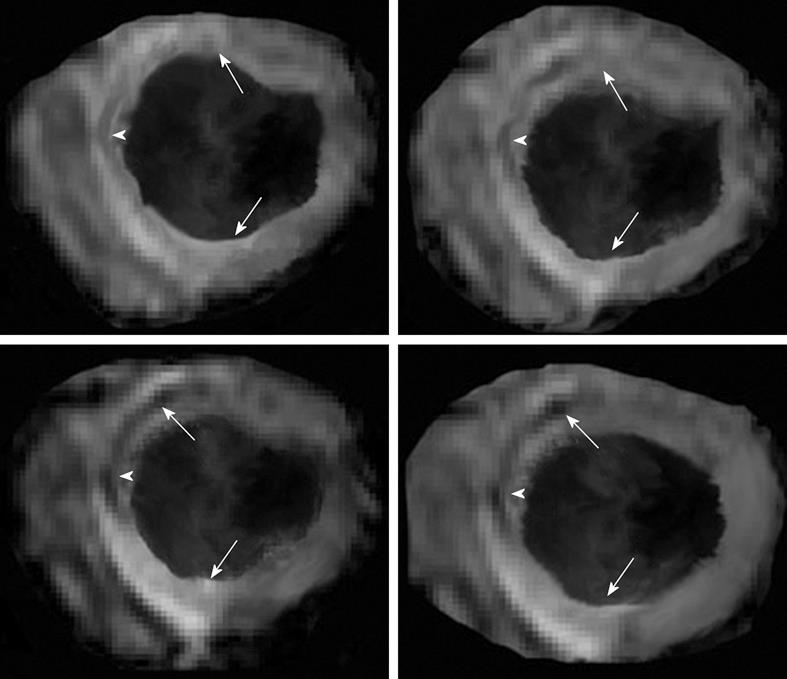
Figure 10 Preclinical study shows the patchy enhanced embolized region in two animals after delivery of embolic materials (7200 microsphere count, 100-300 μm diameters).
Animal one received the embolic materials in the left anterior descending coronary artery causing perfusion deficit in the antero-septal wall 2-3 h after delivery of the embolic materials (top left, arrows), while animal two received the embolic materials in the left circumflex coronary artery causing perfusion deficit in the inferior wall (bottom left, arrows). Short (center images) and long (right images) axis views of DE-MR imaging illustrates the microinfarct of the same ischemic territory 7 d after embolization[114].
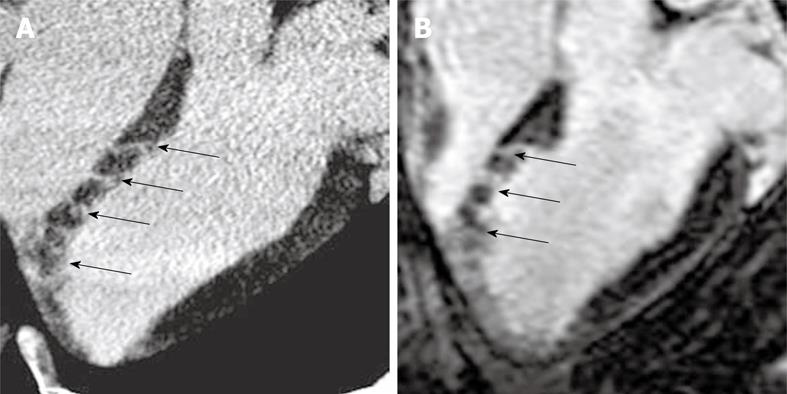
Figure 11 DE-multi-slice MDCT (A) and DE-MR (B) images from experimentally embolized LAD coronary artery show good correspondence between the modalities in defining heterogenous microinfarct.
Both modalities show enhanced stripes (arrows) of microinfarct extending from the epicardium to the endocardium mapping occluded microvessels.
- Citation: Saeed M, Hetts S, Wilson M. Reperfusion injury components and manifestations determined by cardiovascular MR and MDCT imaging. World J Radiol 2010; 2(1): 1-14
- URL: https://www.wjgnet.com/1949-8470/full/v2/i1/1.htm
- DOI: https://dx.doi.org/10.4329/wjr.v2.i1.1


