
















Copyright: ©Author(s) 2026.
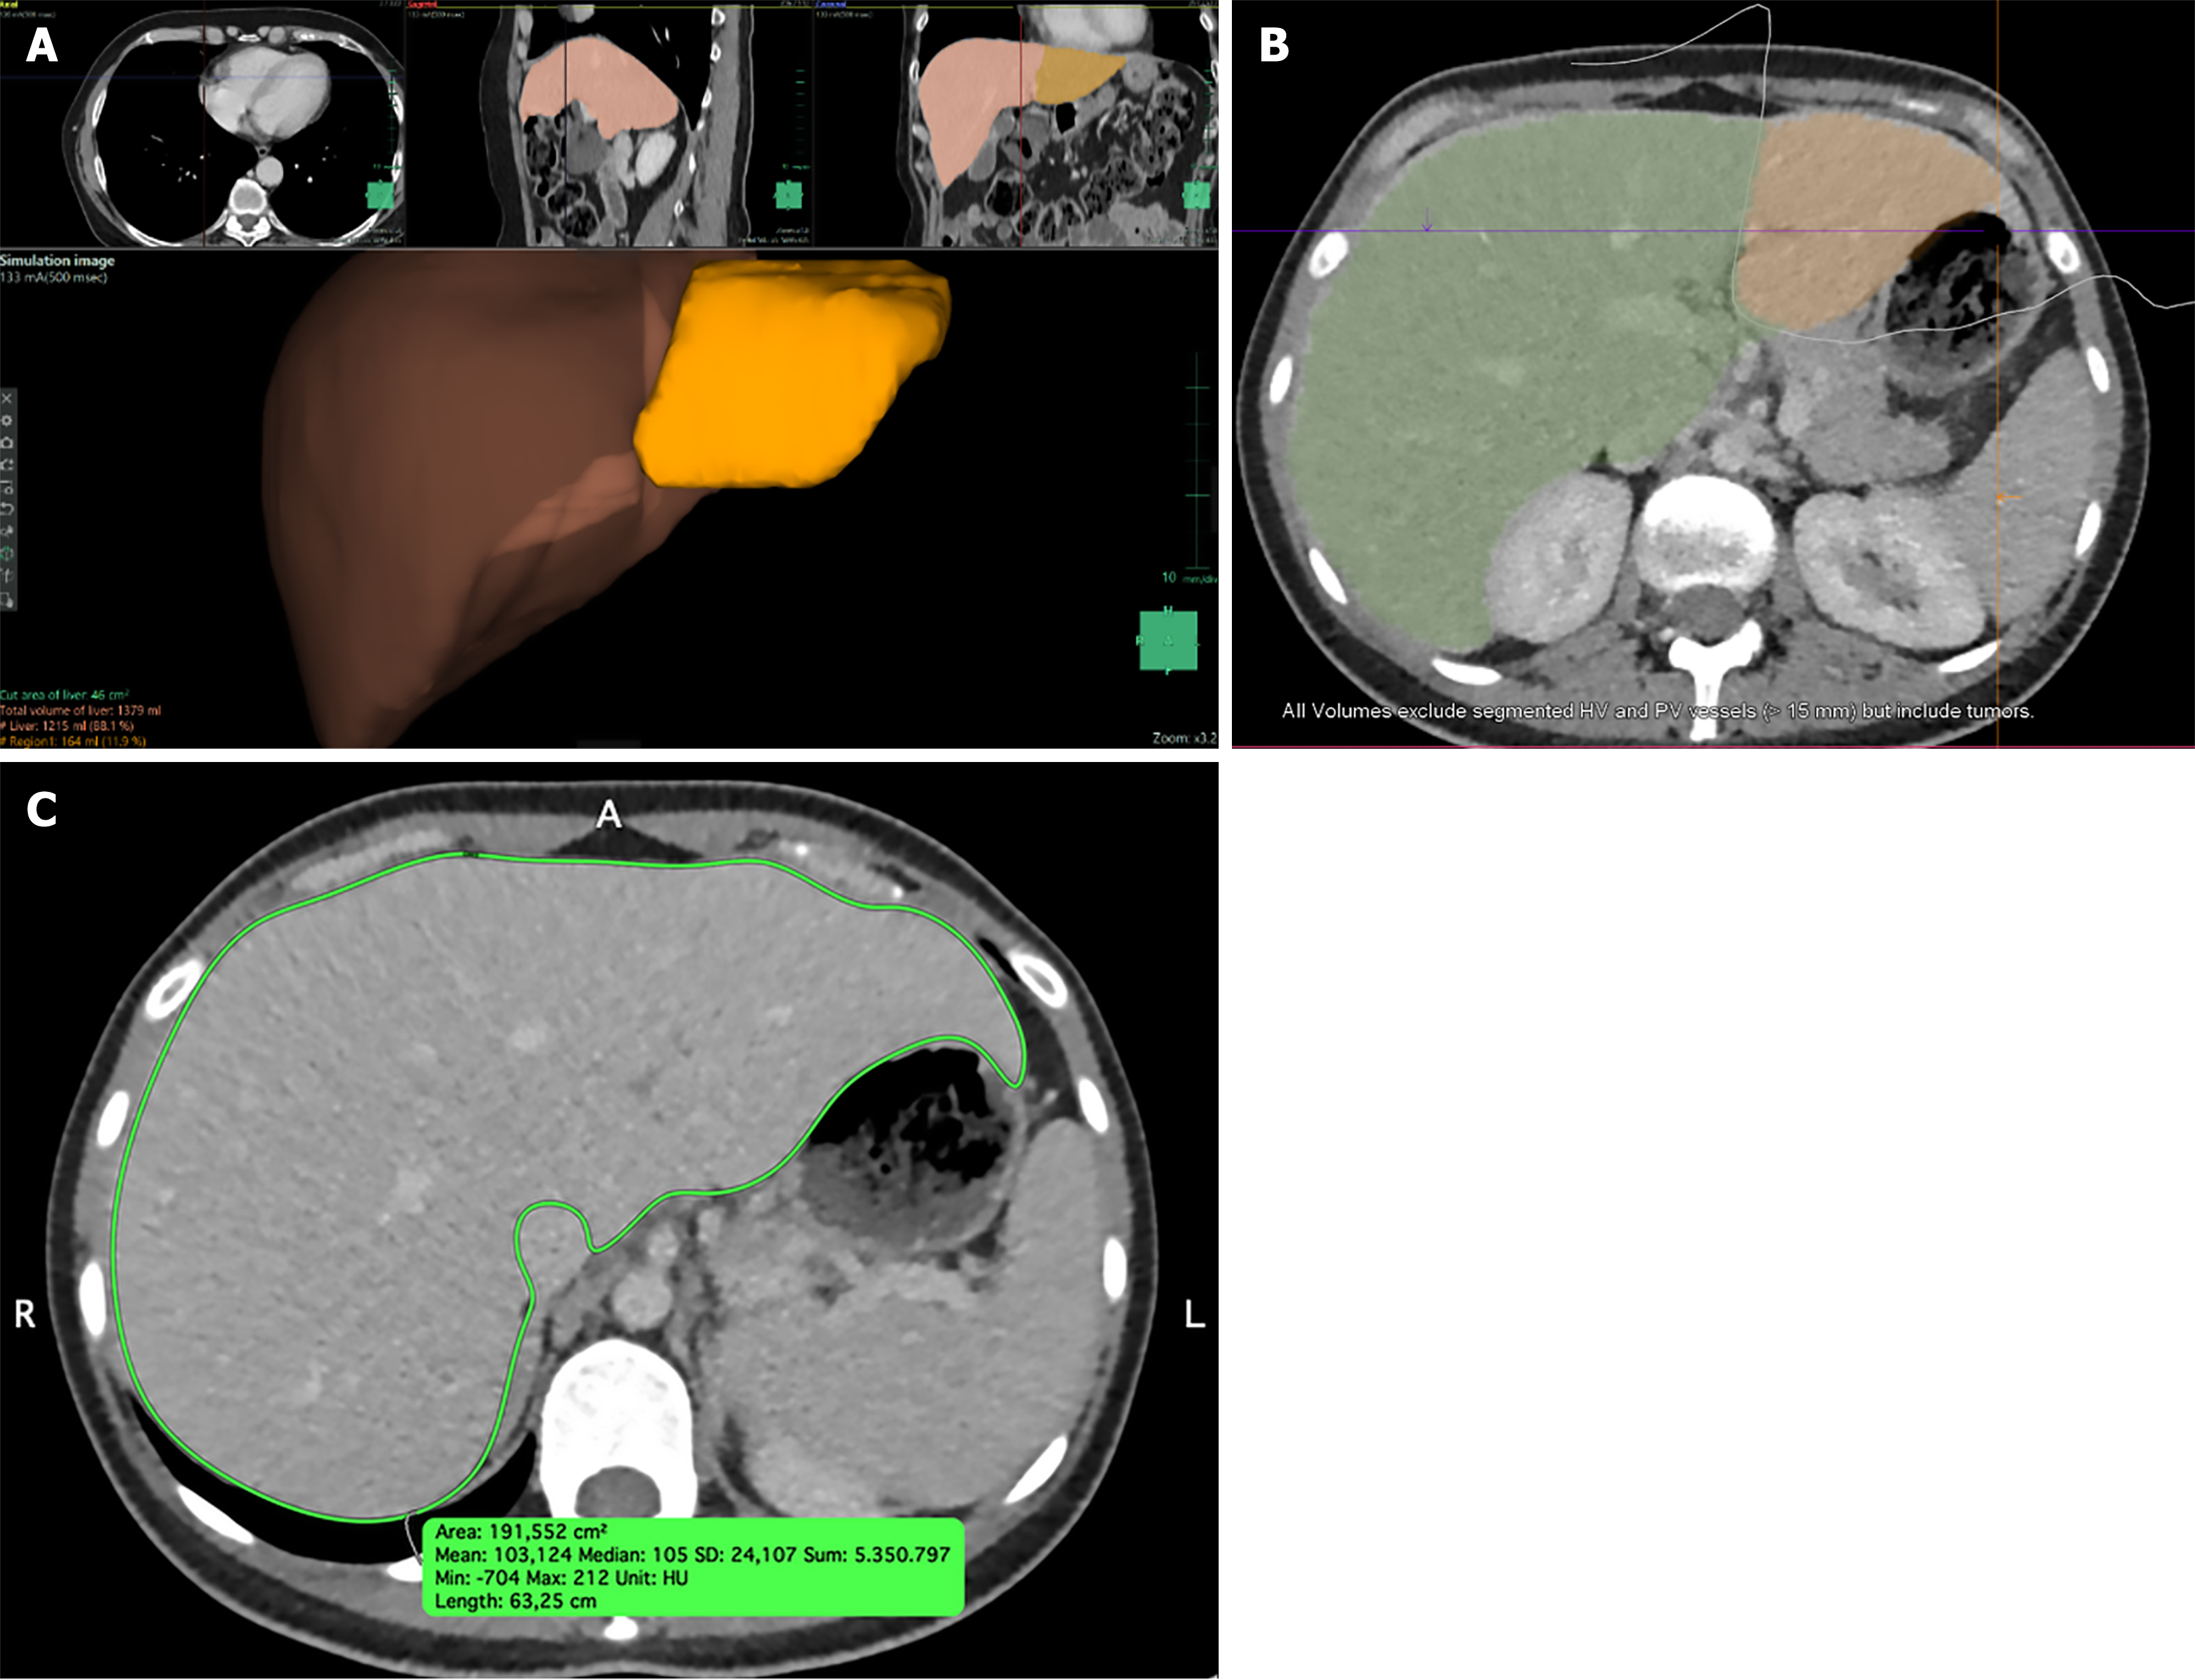
Figure 1 Segmentation example of all three software programs.
A: Synapse 3D; B: Syngo.via; C: Osirix®.
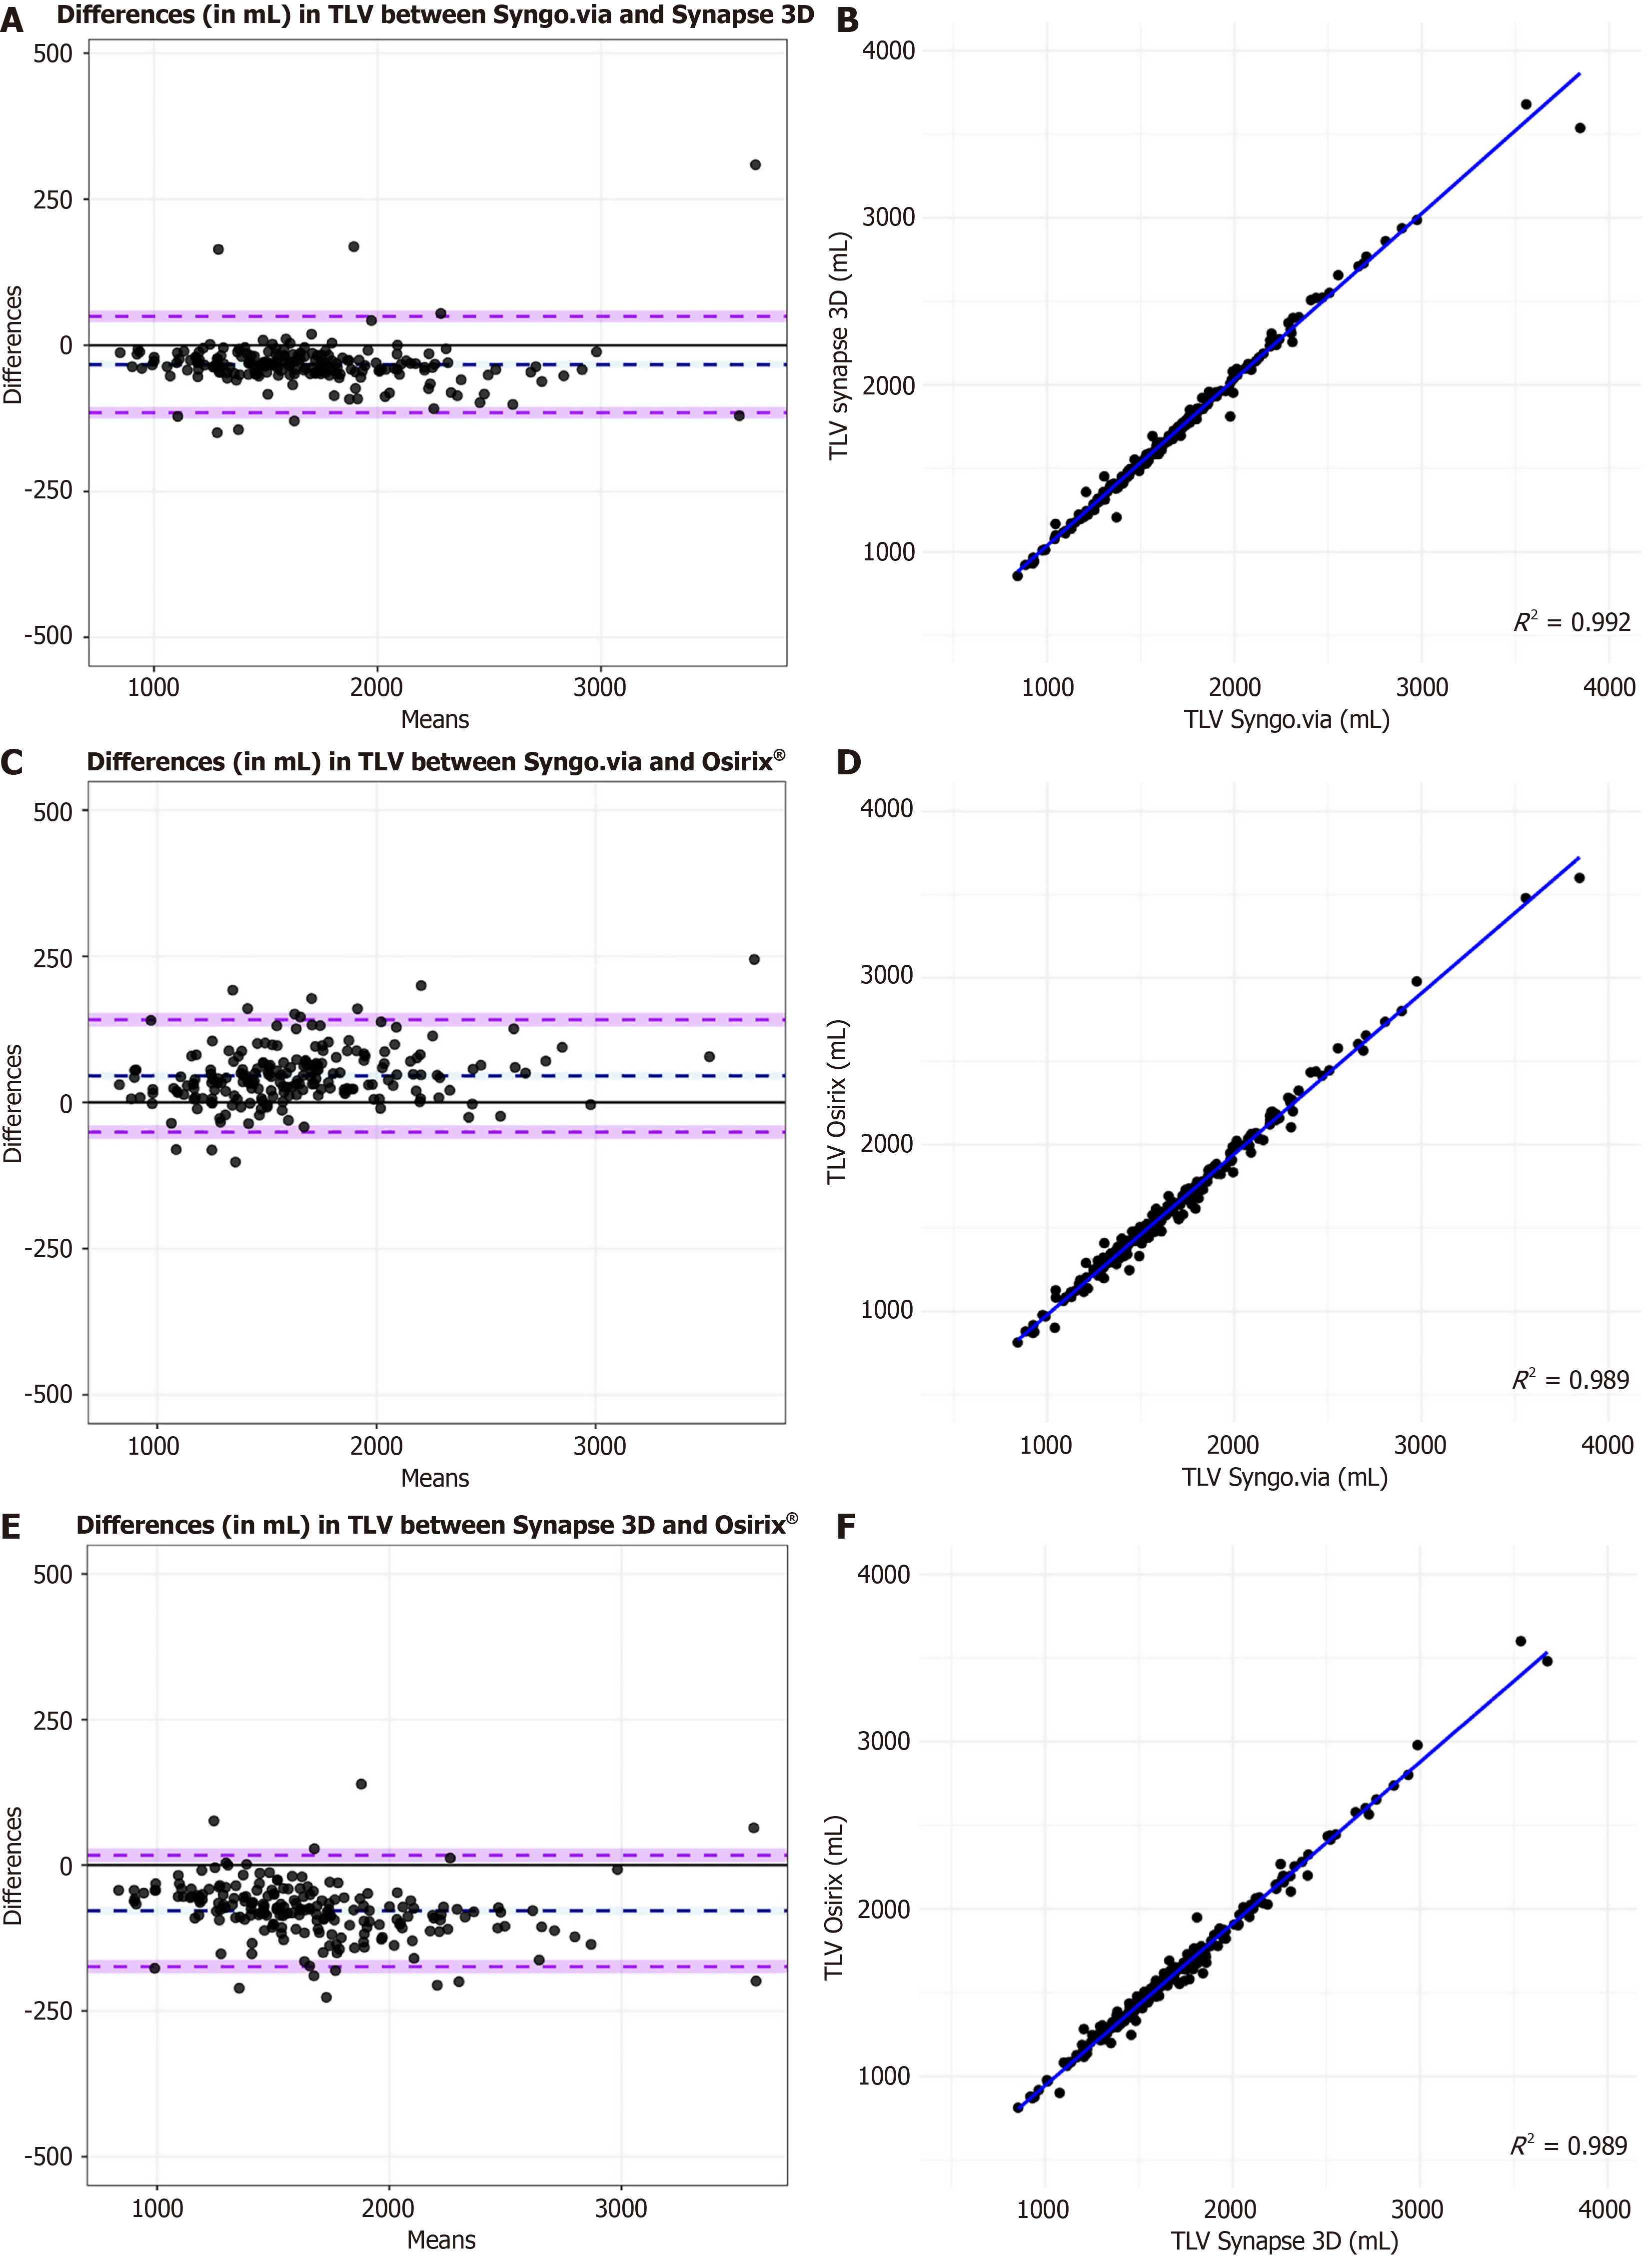
Figure 2 Bland Altman plots and scatter plot of the total liver volumes among the three software programs.
A: Bland Altman plots of mean differences between Syngo.via and Synapse 3D; B: Scatter plot of mean differences between Syngo.via and Synapse 3D; C: Bland Altman plots of mean differences between Syngo.via and OsiriX® for total liver volume; D: Scatter plot of mean differences between Syngo.via and OsiriX®; E: Bland Altman plots of mean differences between Osirix® and Synapse 3D; F: Scatter plot of mean differences between OsiriX® and Synapse 3D. TLV: Total liver volume.
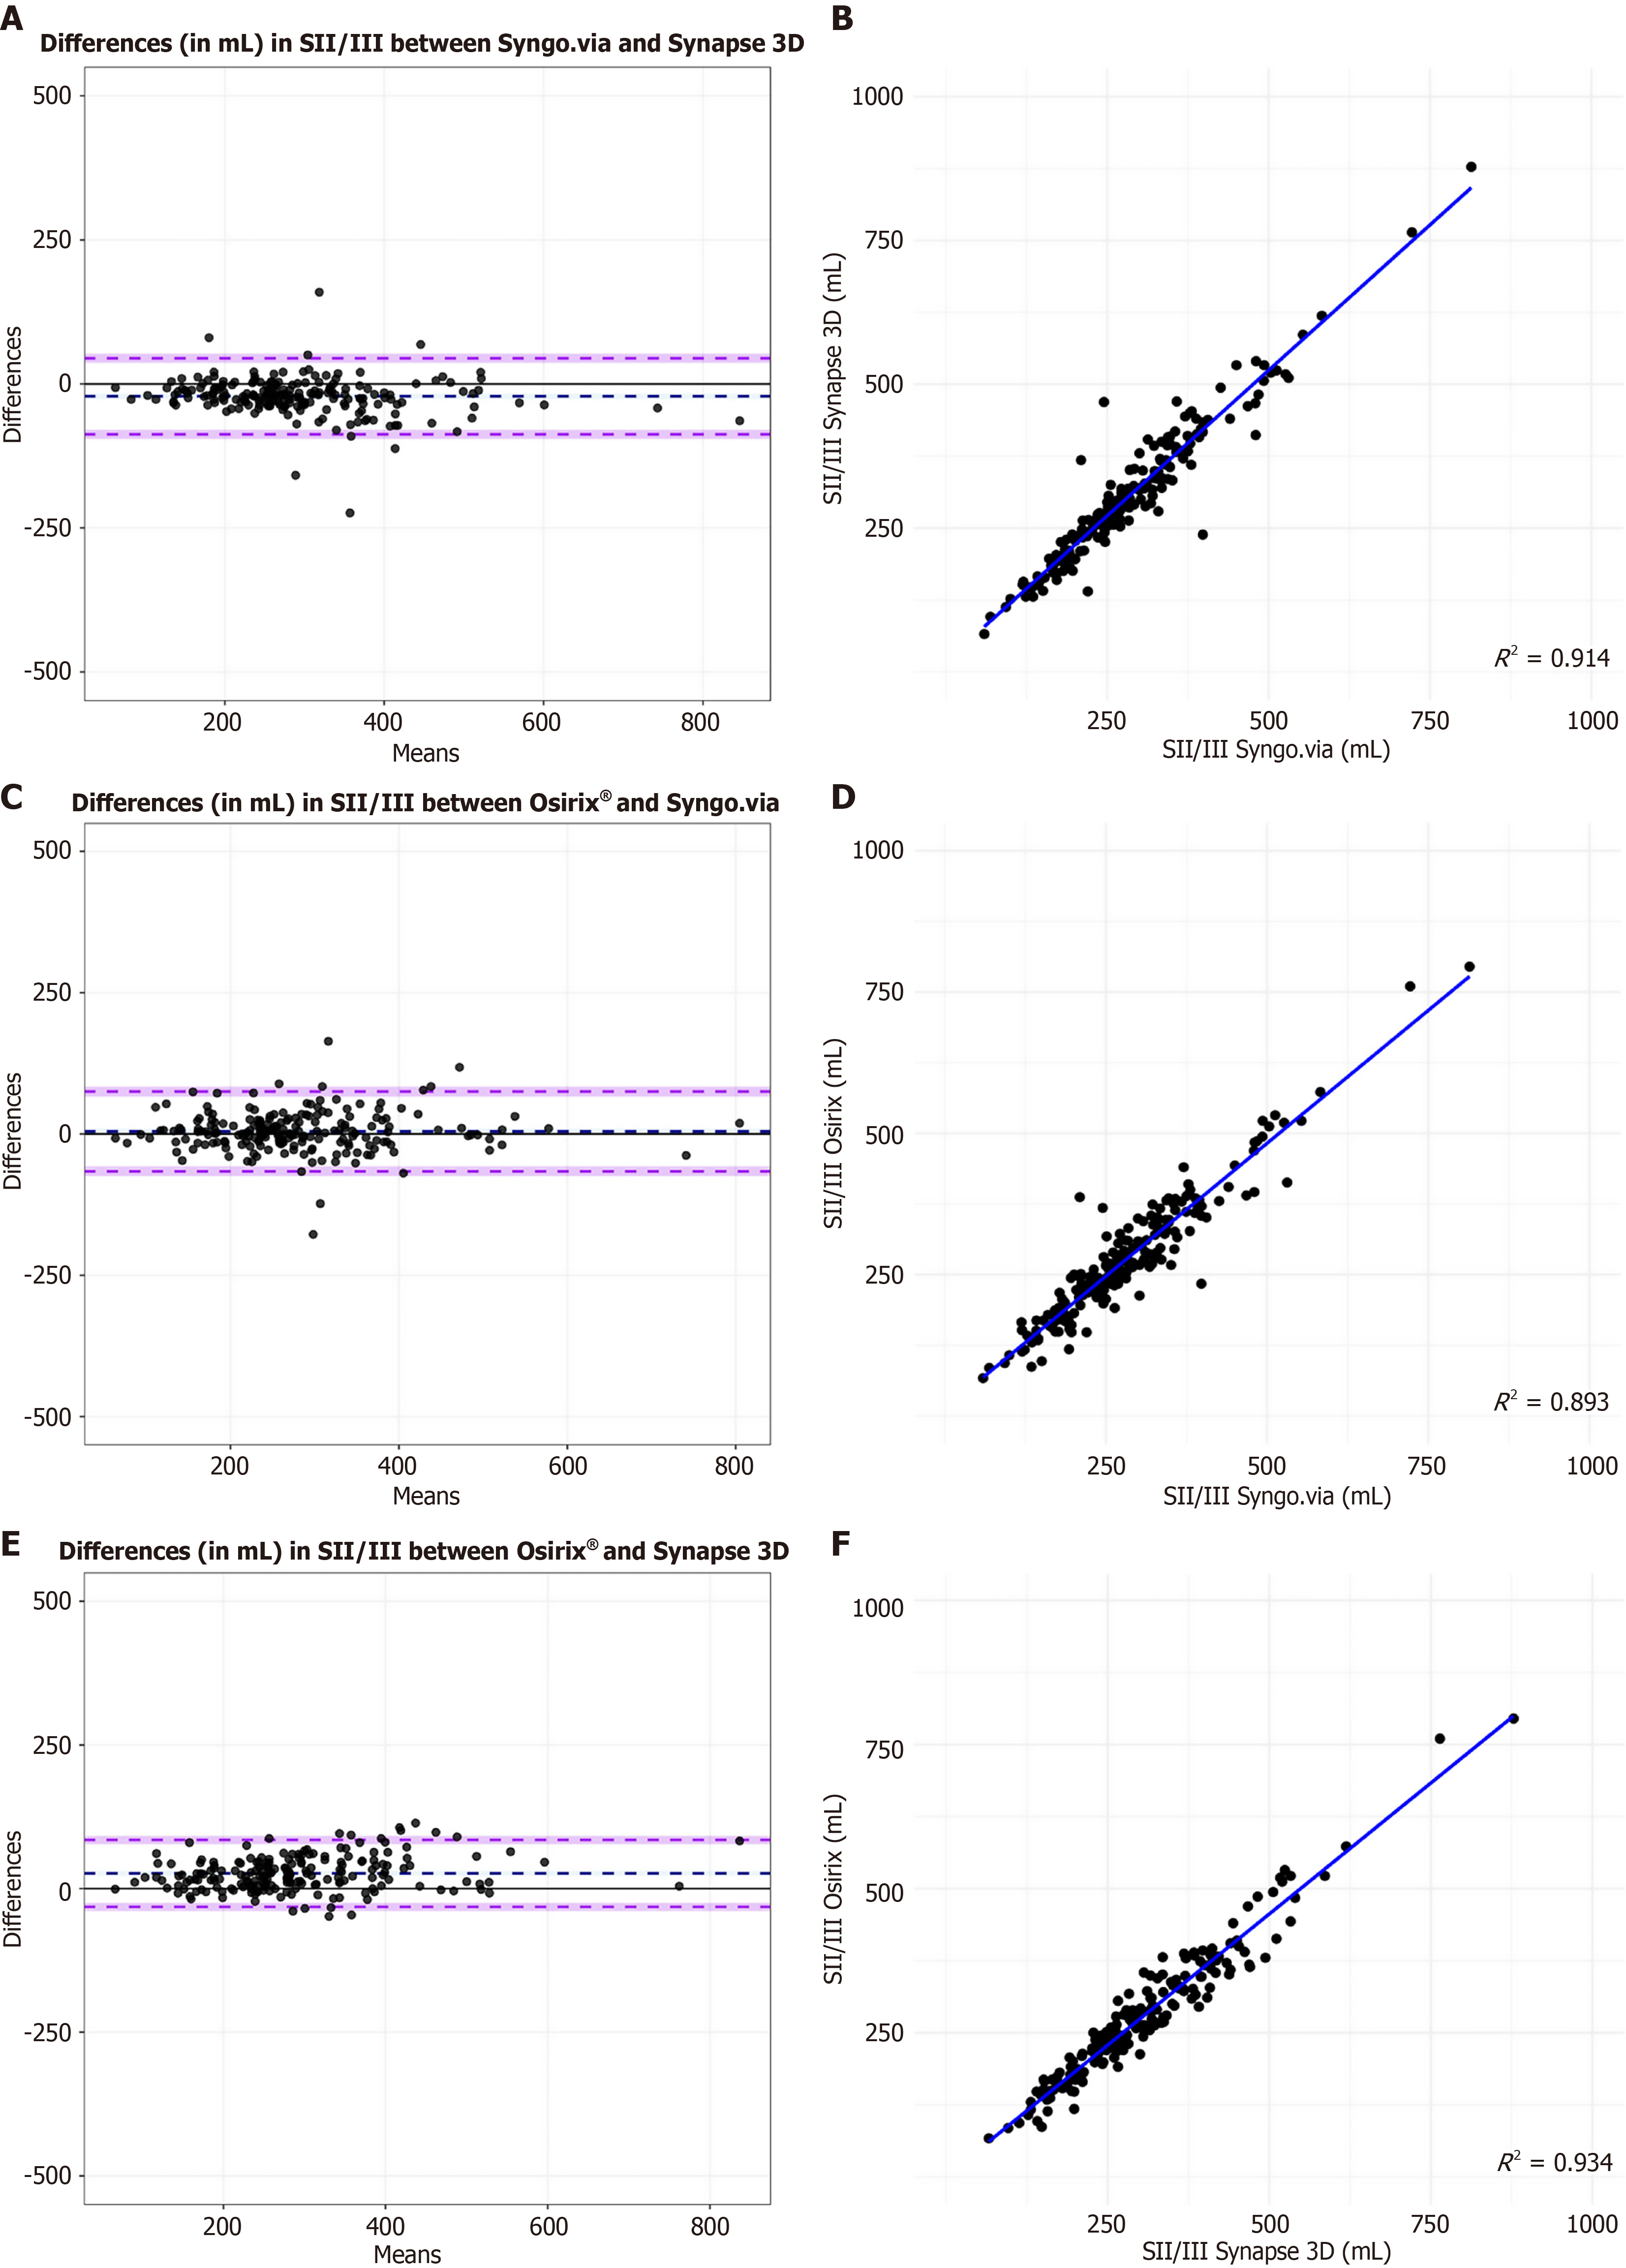
Figure 3 Bland Altman plots and graphs of segment II/III volumes among the three software programs.
A: Bland Altman plots of mean differences between Syngo.via and Synapse 3D; B: Scatter plot of mean differences between Syngo.via and Synapse 3D; C: Bland Altman plots of mean differences between Syngo.via and OsiriX® for total liver volume; D: Scatter plot of mean differences between Syngo.via and OsiriX®; E: Bland Altman plots of mean differences between OsiriX® and Synapse 3D; F: Scatter plot of mean differences between OsiriX® and Synapse 3D. SII/III: Segment II/III.
- Citation: van der Velden AL, Knapen RRMM, James S, Rahmani H, Brecheisen R, van Kuijk SMJ, Wildberger JE, van Dam RM, van der Leij C. Comparing the reliability of three software programmes for manual and (semi-)automatic volumetry in healthy livers. World J Radiol 2026; 18(9): 123720
- URL: https://www.wjgnet.com/1949-8470/full/v18/i9/123720.htm
- DOI: https://dx.doi.org/10.4329/wjr.123720