
















Copyright: ©Author(s) 2026.
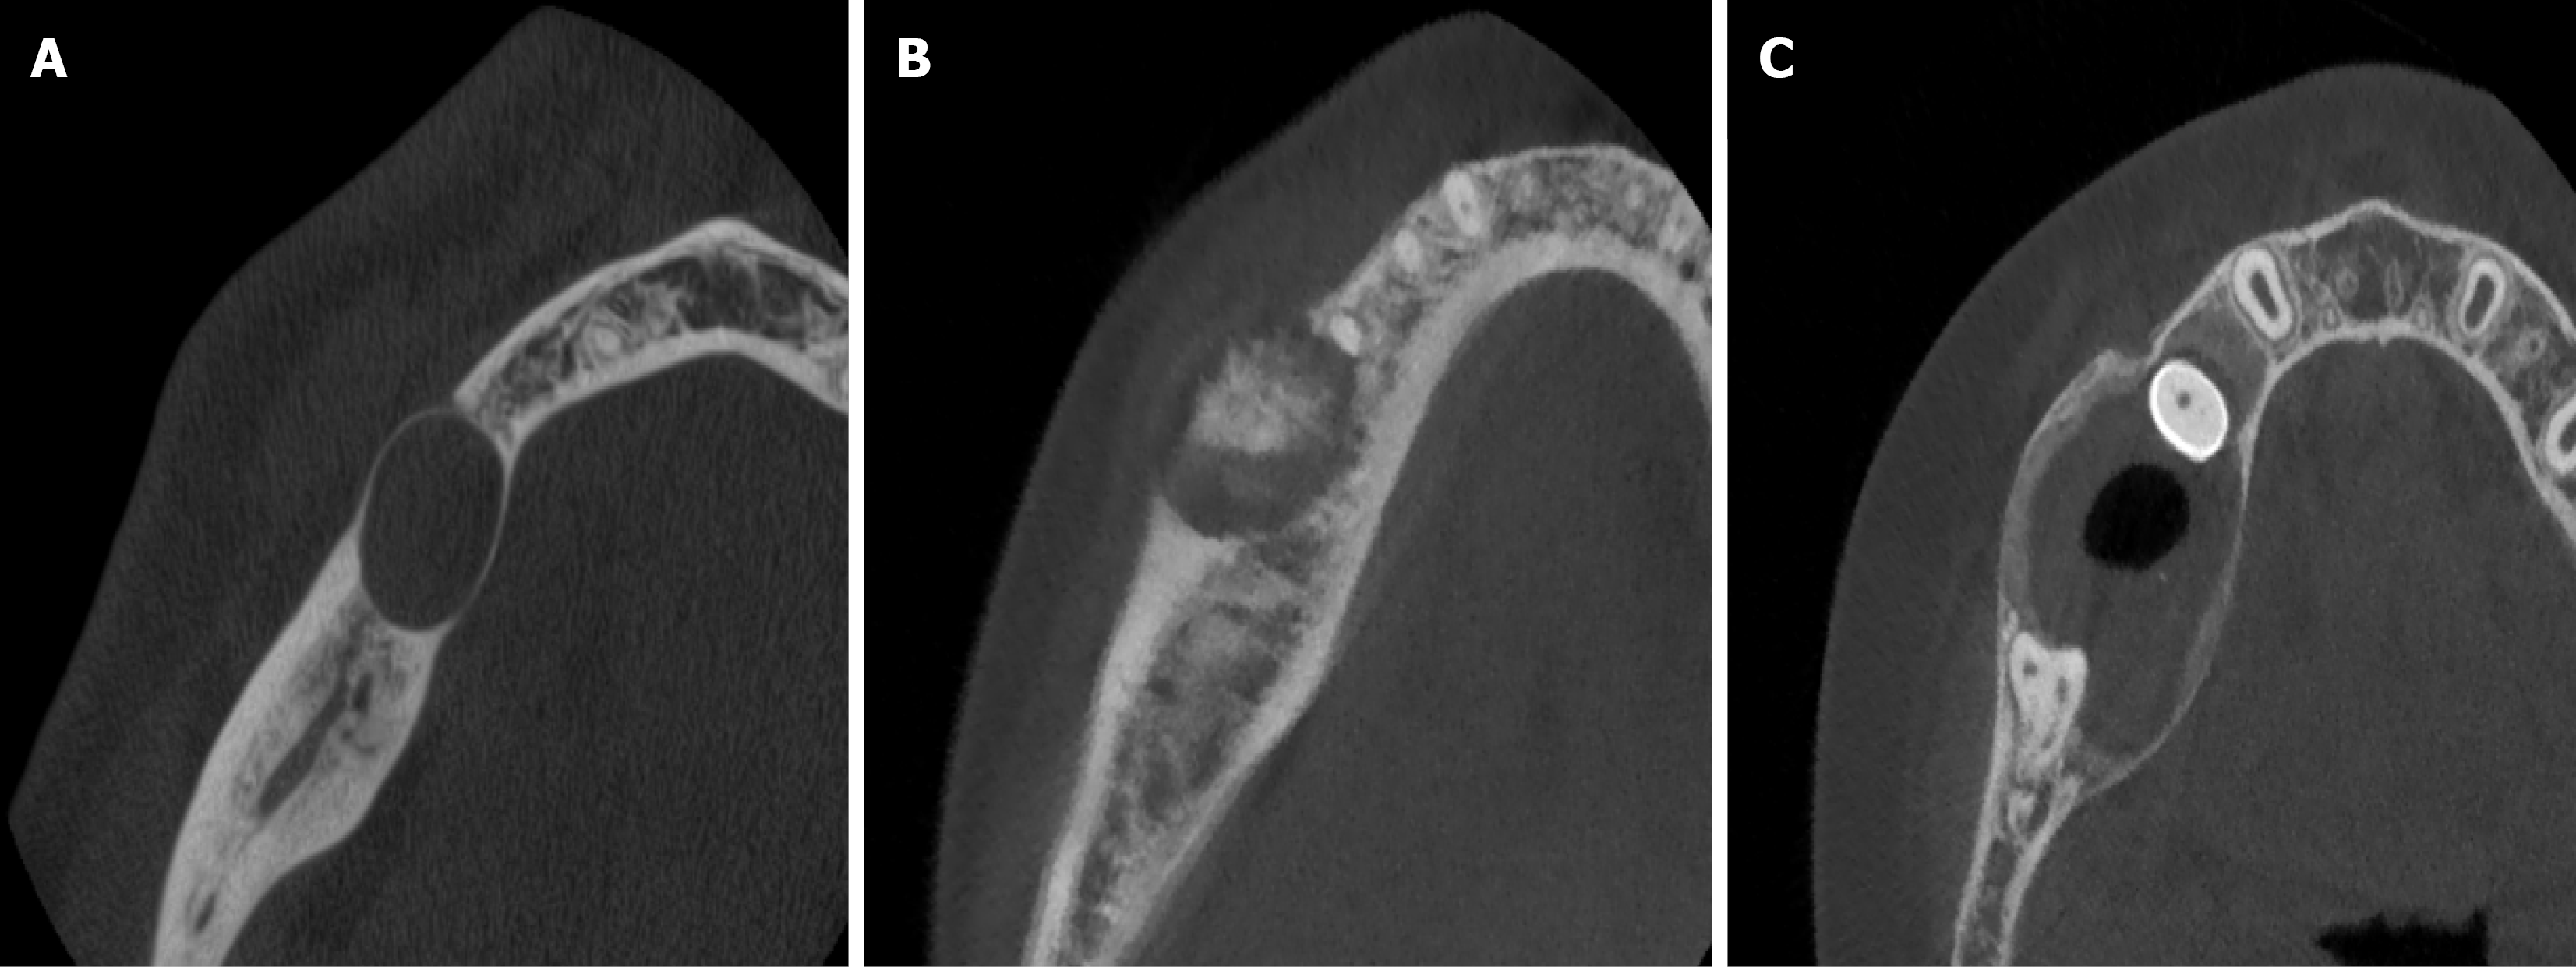
Figure 1 Representative cone-beam computed tomography images demonstrating the spectrum of architectural phenotypes in jaw lesions.
A: Homogeneous fluid-dominant phenotype showing uniform internal radiolucency with minimal architectural complexity and absence of internal septation; B: Intermediate septated phenotype demonstrating partial internal heterogeneity with developing architectural complexity; C: Complex heterogeneous phenotype demonstrating multilocularity, internal structural irregularity, and marked spatial heterogeneity with increased architectural complexity.
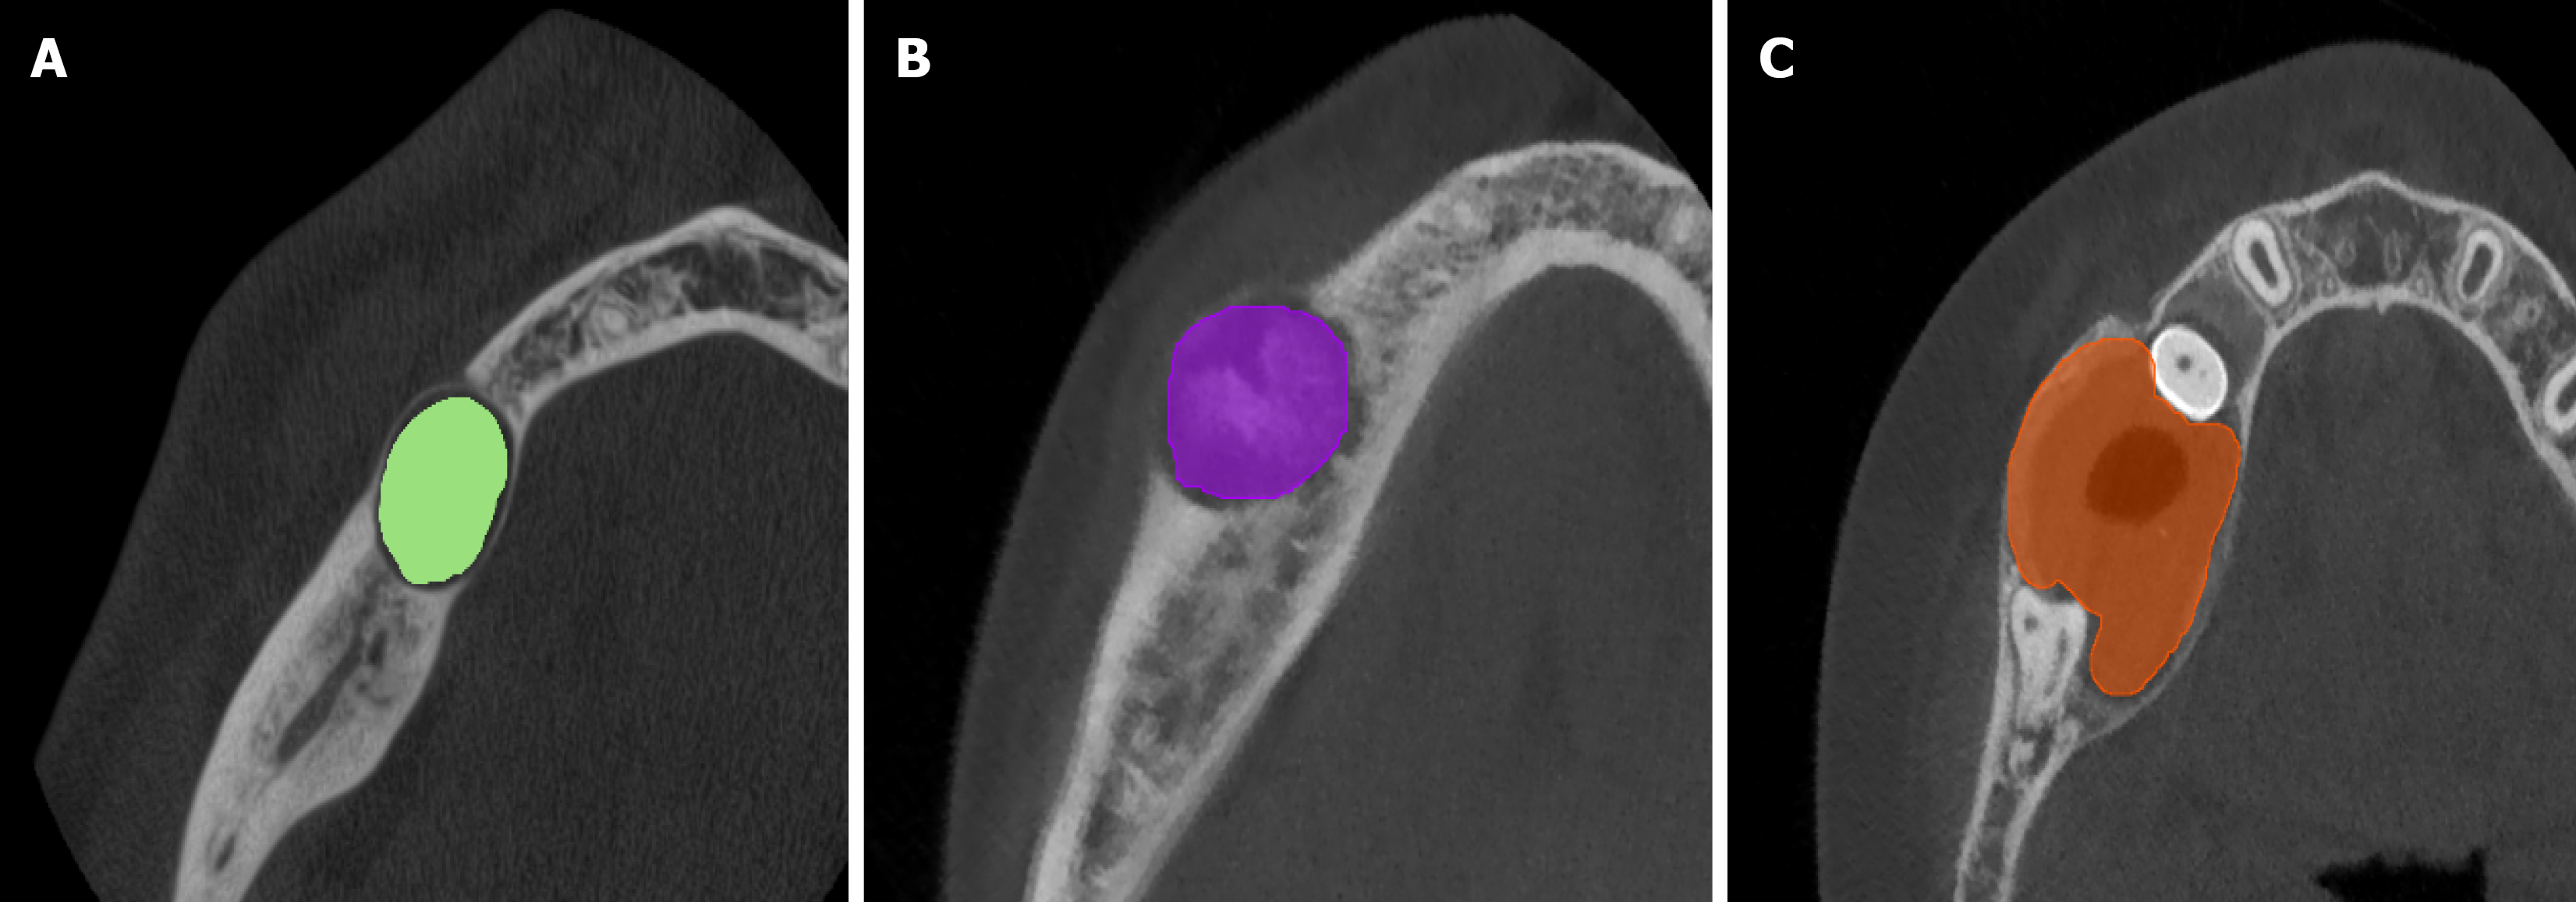
Figure 2 Representative volumetric segmentation masks of architectural phenotype groups utilized for radiomic feature extraction from cone-beam computed tomography datasets.
A: Homogeneous fluid-dominant phenotype demonstrating a well-defined uniform lesion volume with minimal internal complexity; B: Intermediate septated phenotype demonstrating moderate internal architectural heterogeneity and partial structural compartmentalization; C: Complex heterogeneous phenotype demonstrating irregular volumetric architecture with multilocularity and increased internal structural complexity. Colored overlays represent manually delineated three-dimensional volumetric regions of interest used for radiomic analysis.
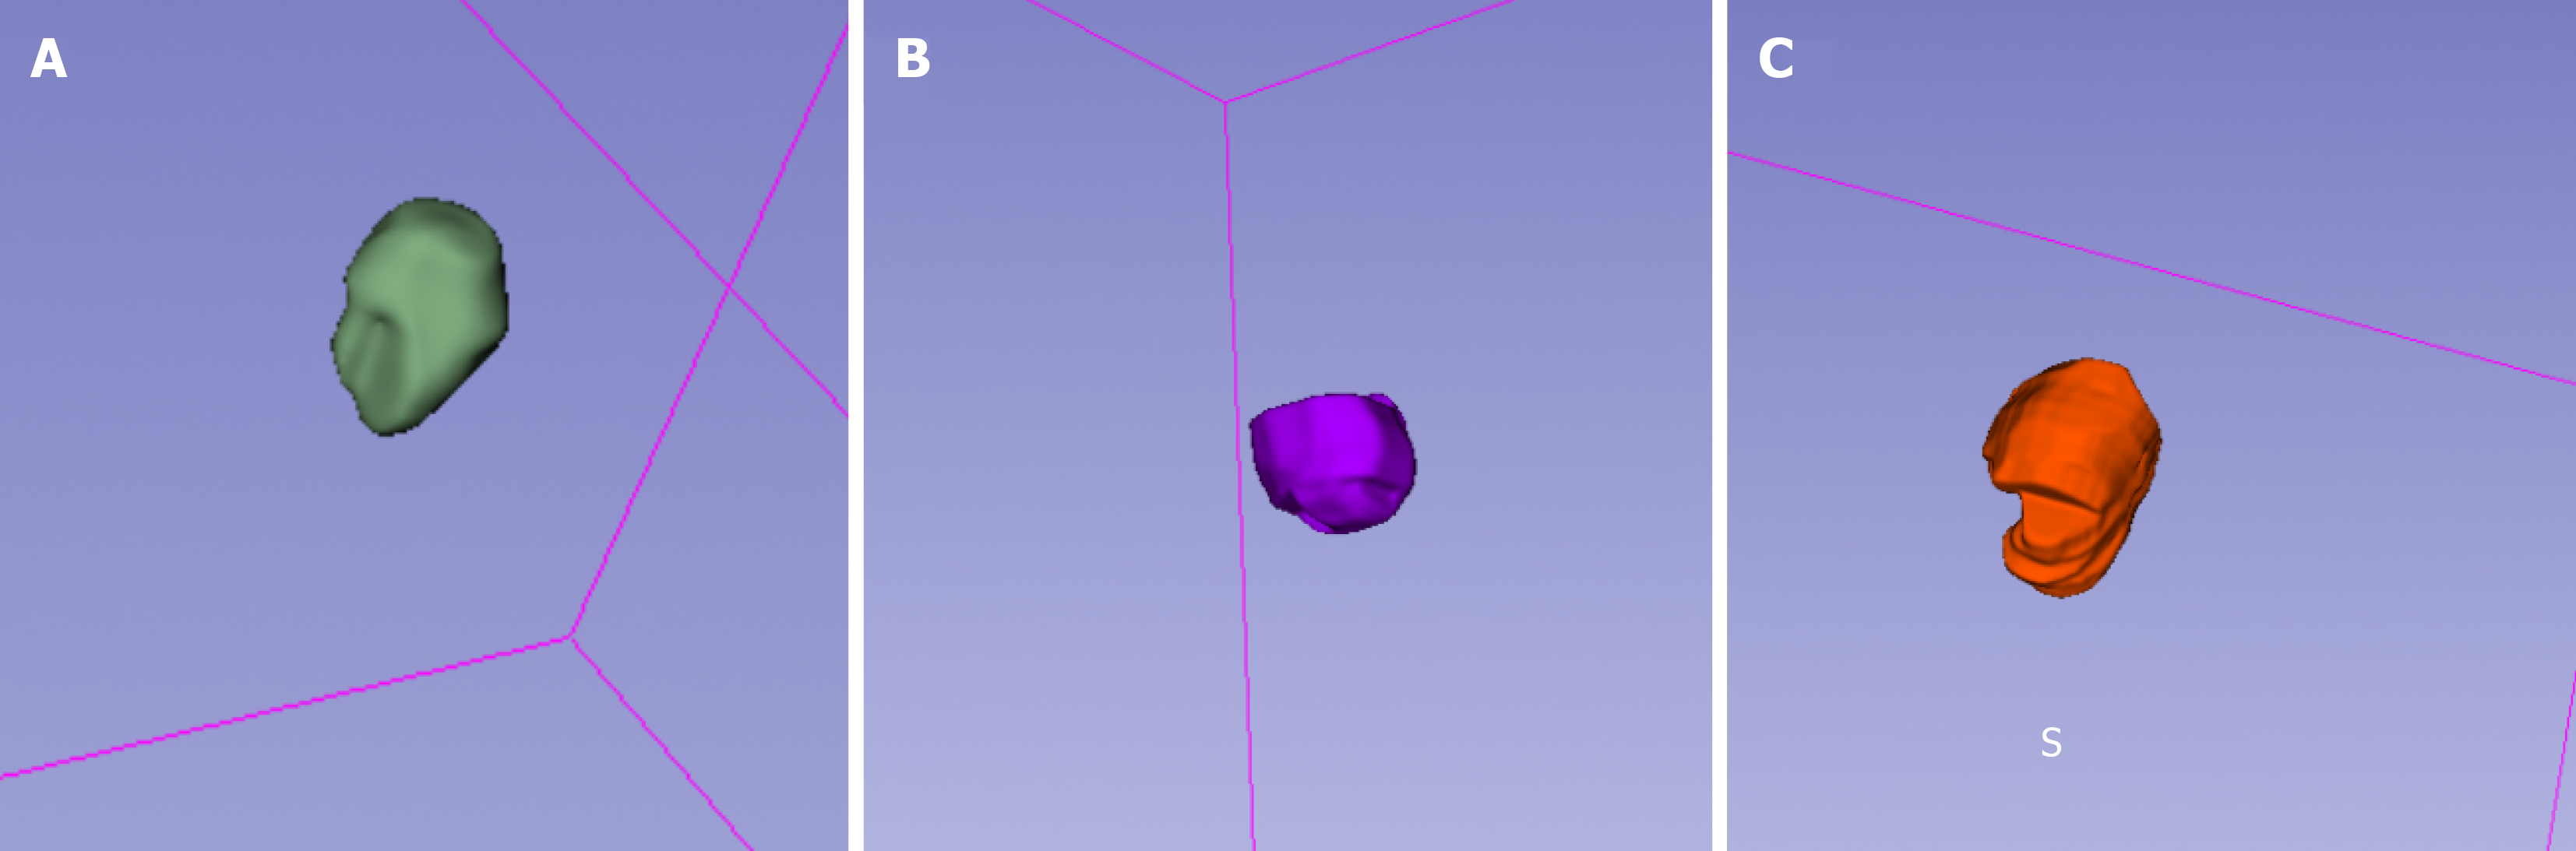
Figure 3 Three-dimensional rendered lesion volumes demonstrating architectural phenotype progression following volumetric segmentation of cone-beam computed tomography datasets.
A: Homogeneous fluid-dominant phenotype; B: Intermediate septated phenotype; C: Complex heterogeneous phenotype. Three-dimensional rendered volumes were generated from segmented volumetric regions of interest for radiomic architectural analysis.
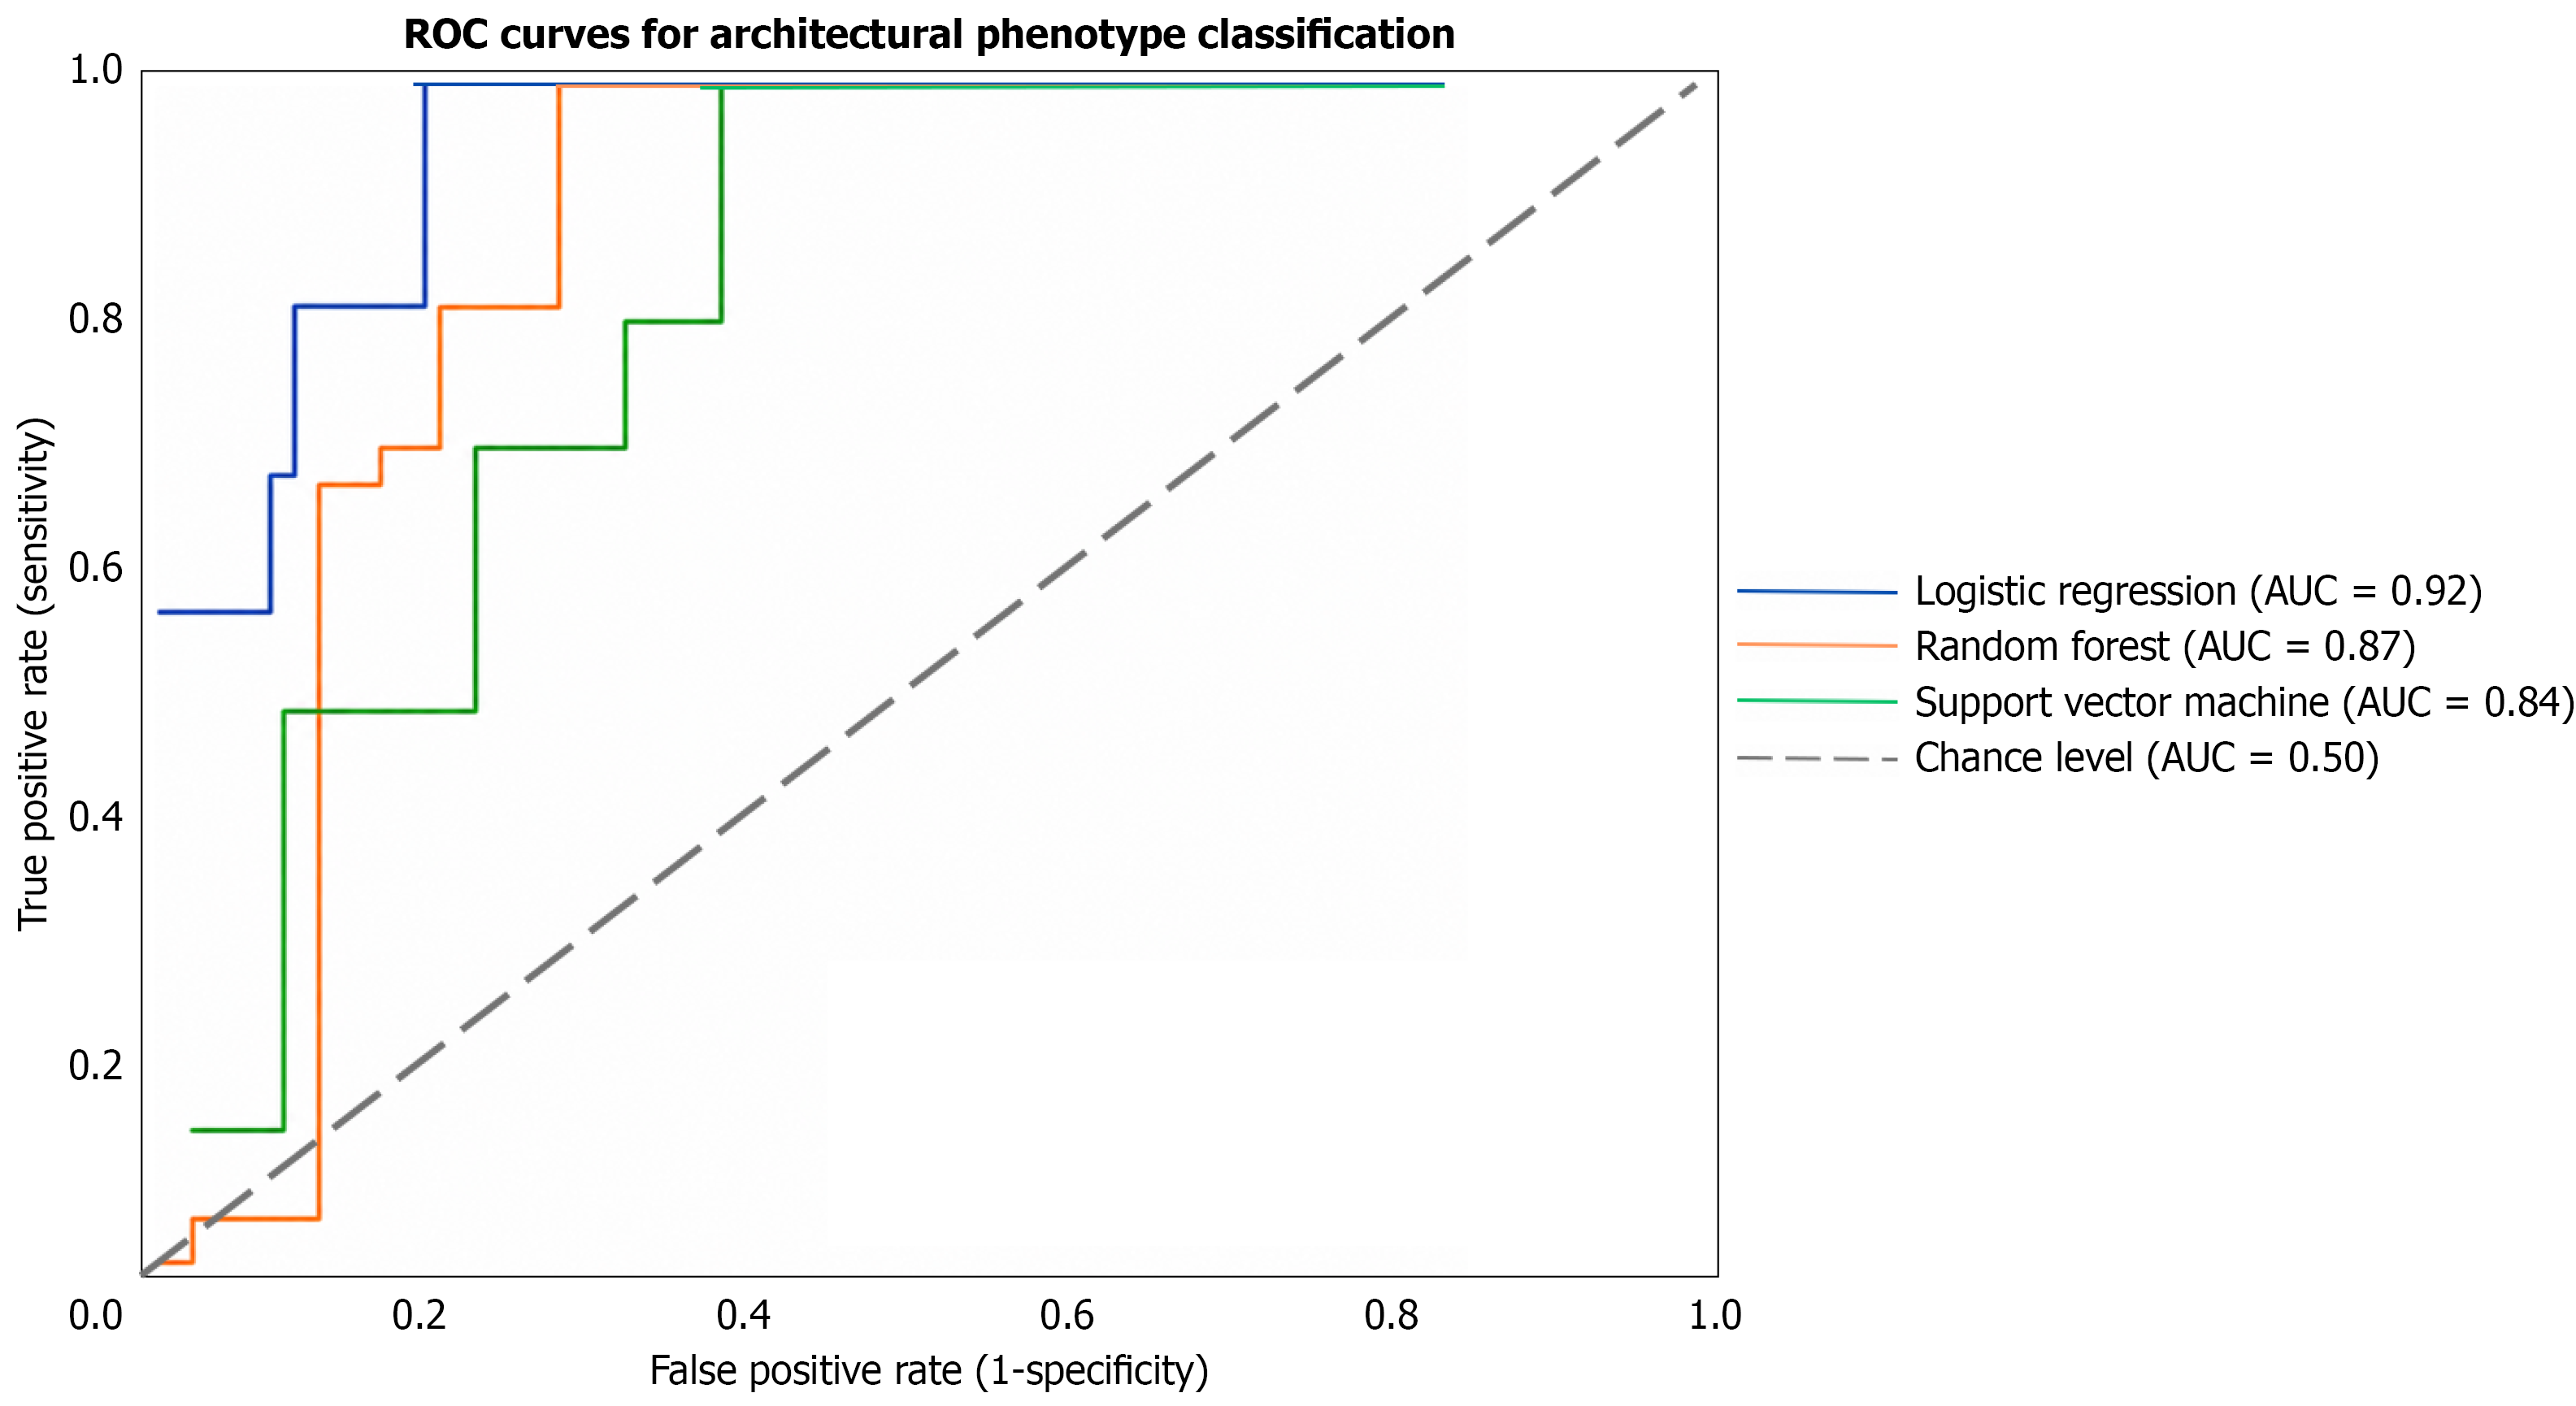
Figure 4 Receiver operating characteristic curves showing the performance of artificial intelligence models.
ROC: Receiver operating characteristic; AUC: Area under the curve.
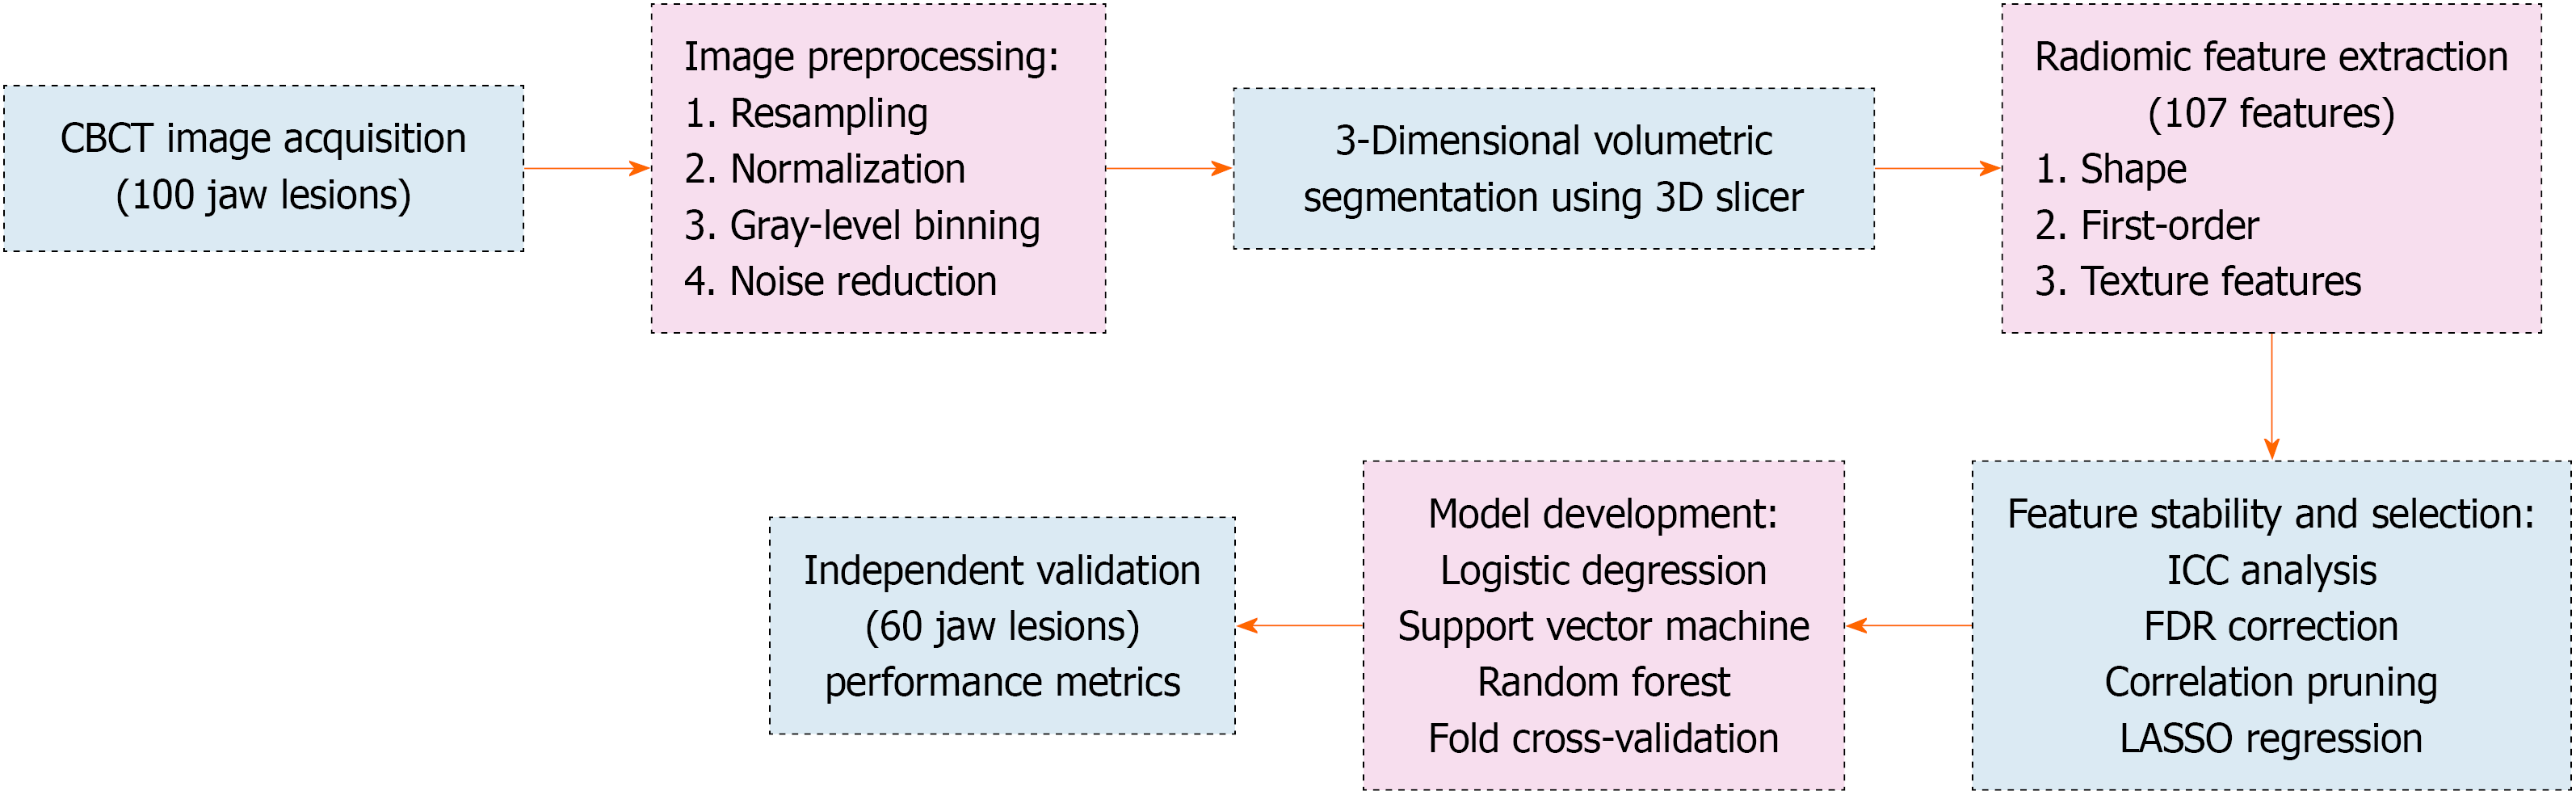
Figure 5 Workflow diagram showing image acquisition, segmentation, radiomic feature extraction, feature selection, model development, and validation.
ICC: Intraclass correlation coefficient; FDR: False discovery rate; CBCT: Cone-beam computed tomography.
- Citation: Sathish S, Nigam H, Gupta R. Cone-beam computed tomography-based radiomic analysis of architectural phenotypes in jaw cysts and tumors using interpretable artificial intelligence models. World J Radiol 2026; 18(8): 123757
- URL: https://www.wjgnet.com/1949-8470/full/v18/i8/123757.htm
- DOI: https://dx.doi.org/10.4329/wjr.123757