















Copyright: ©Author(s) 2026.
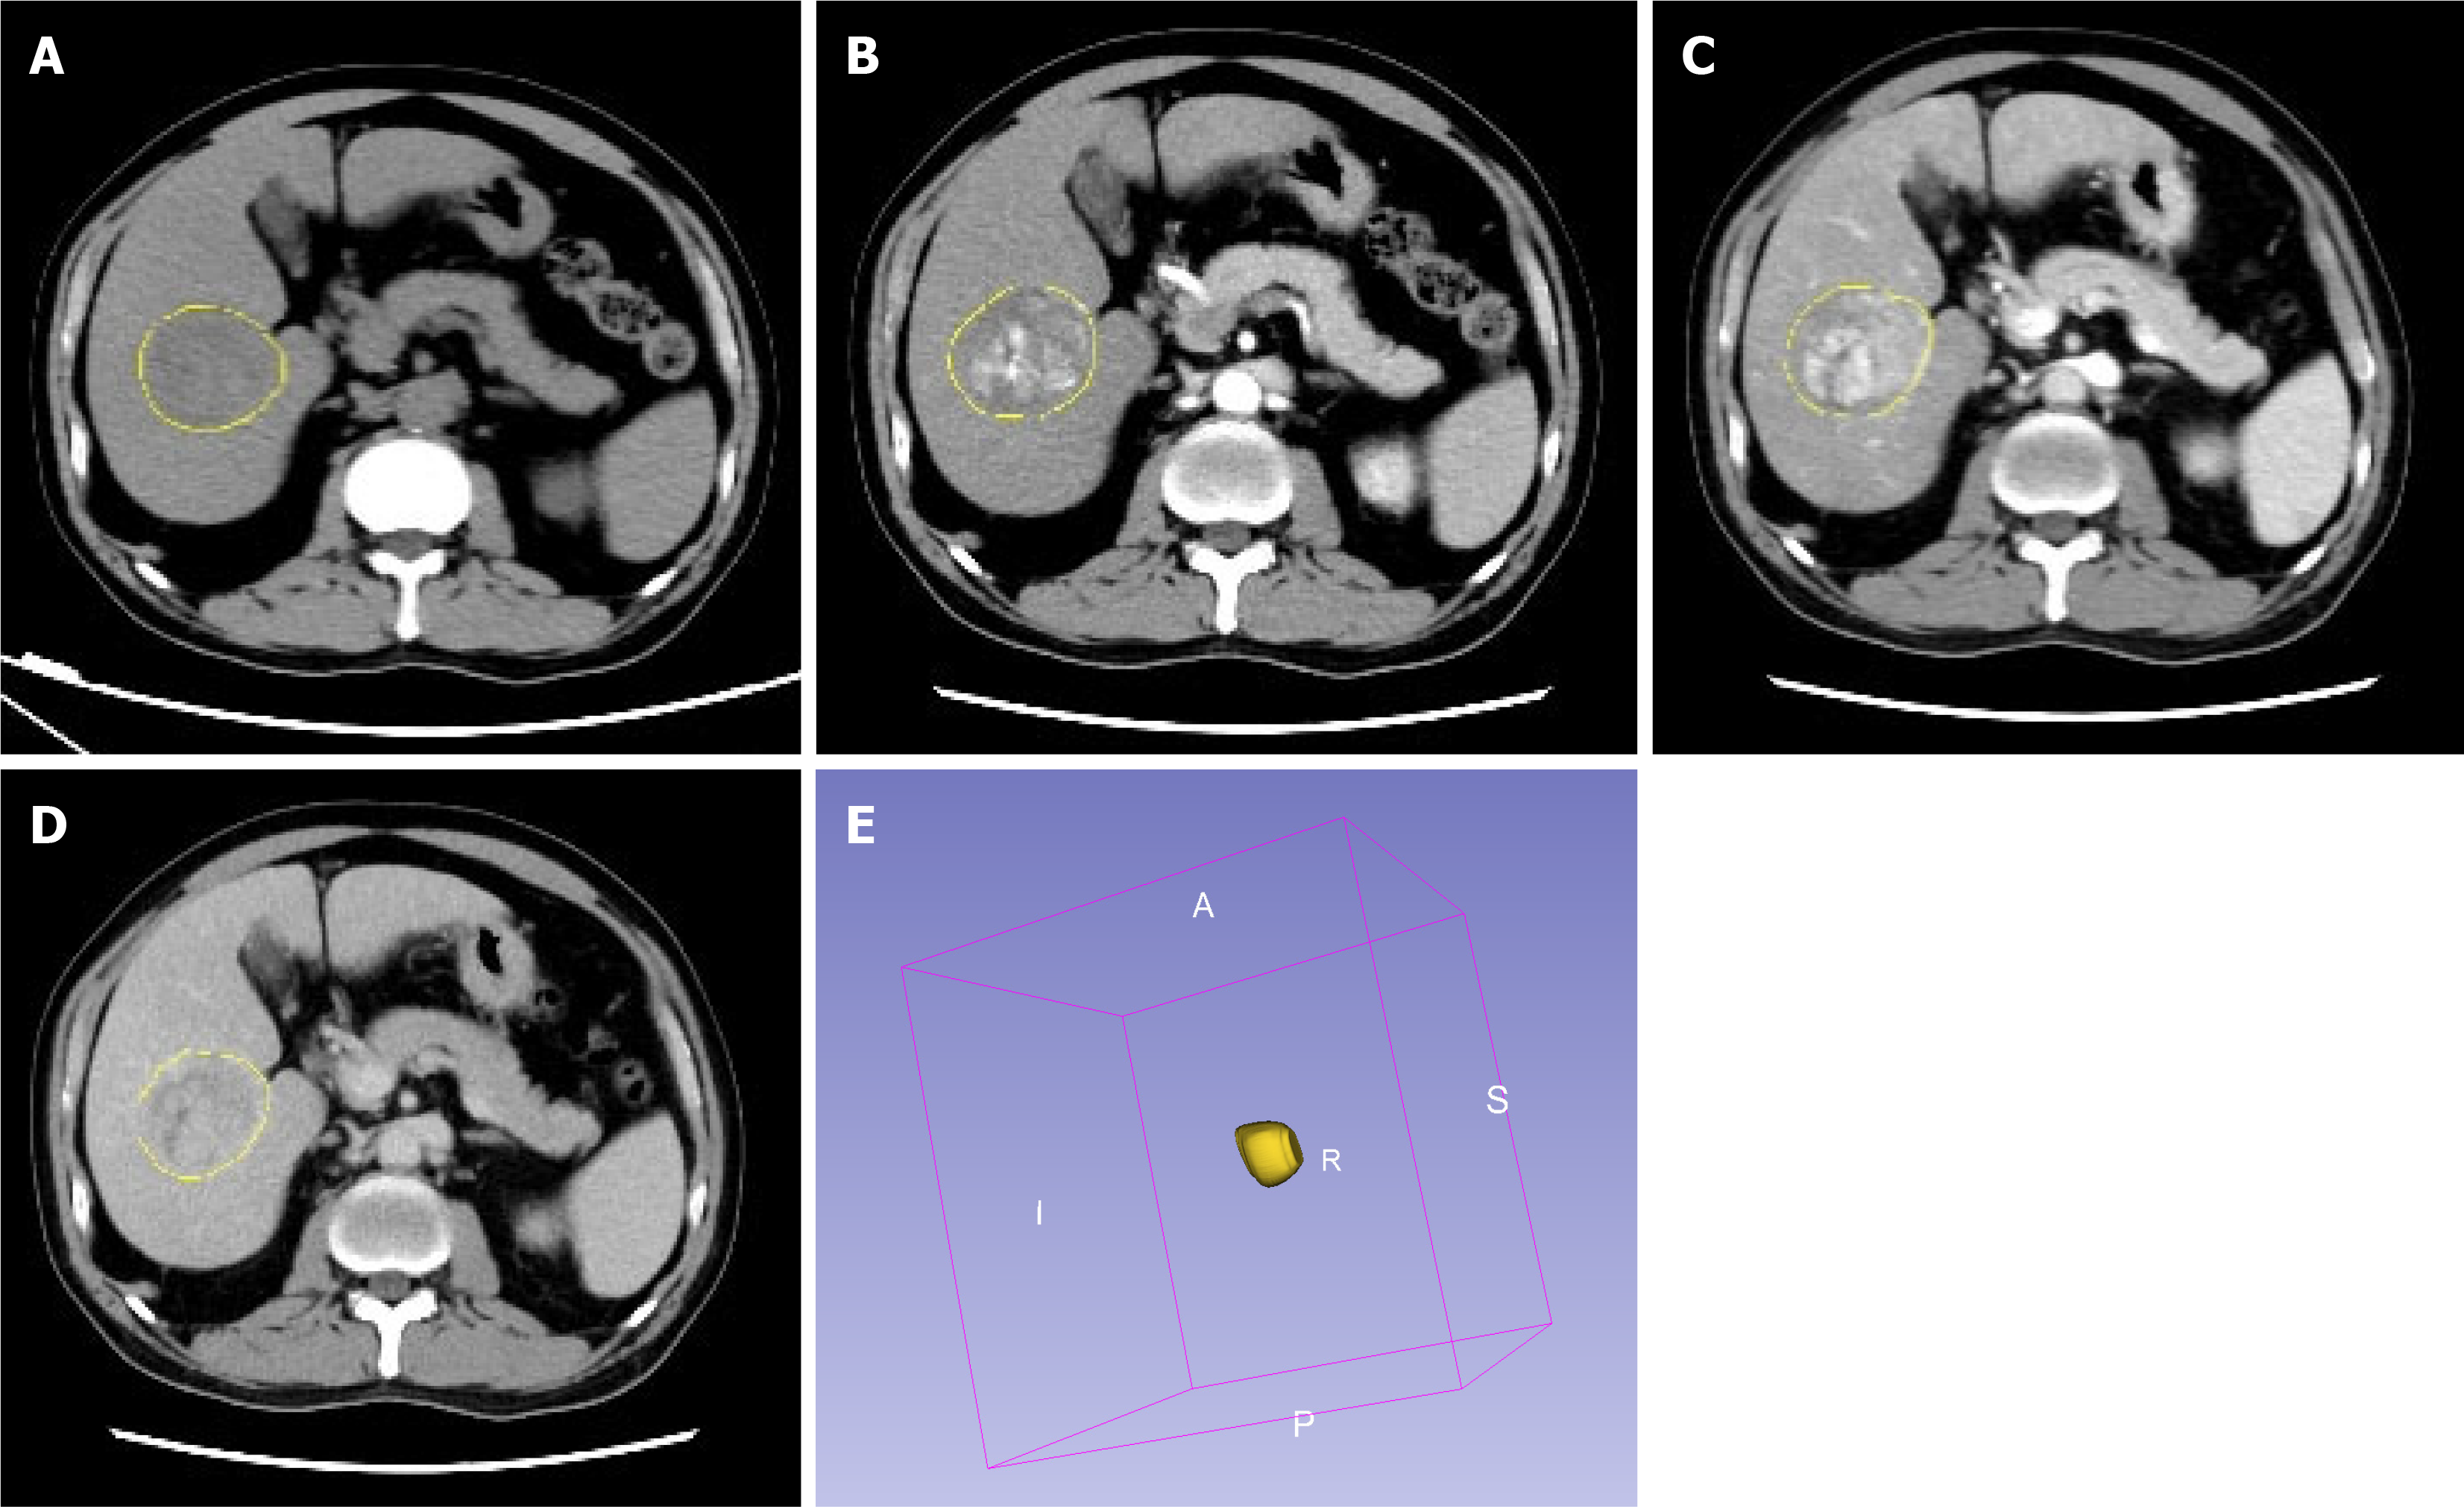
Figure 1 A 40-year-old male patient with hepatocellular carcinoma showing positive glypican-3 expression and an alpha-fetoprotein level of 961.
3 ng/mL. A-D: They represent the abdominal computed tomography plain scan, arterial phase, portal venous phase, delayed phase, segmentation of the region of interest; E: The volume of interest in the arterial phase.
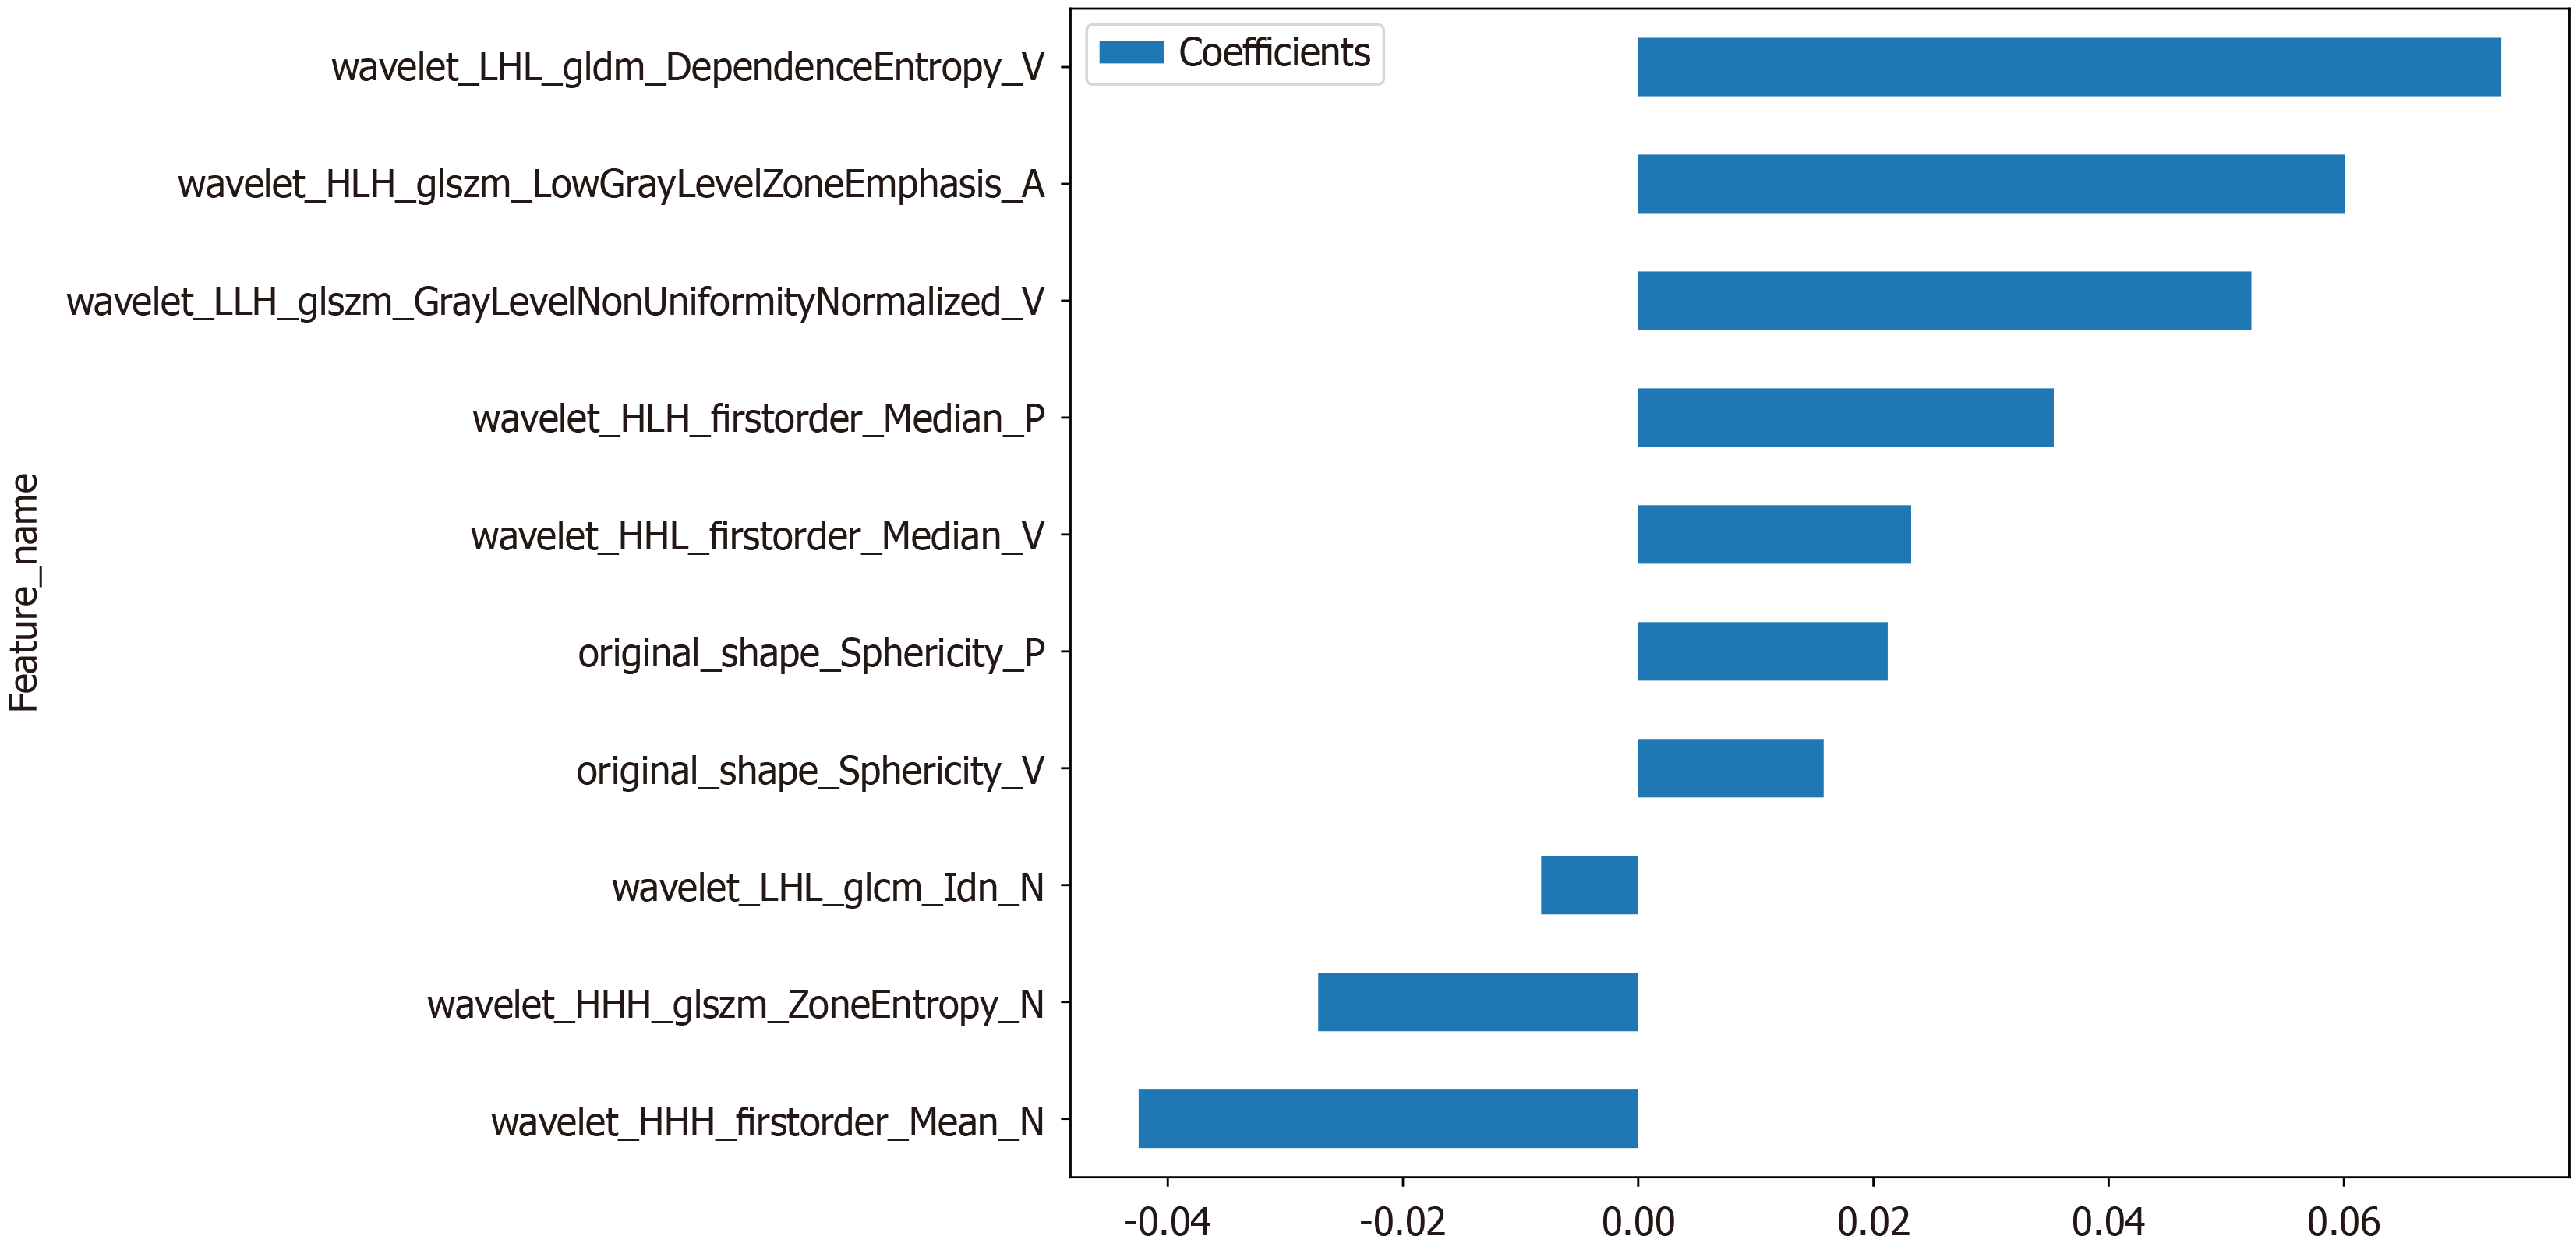
Figure 2
Computed tomography radiomics features and their corresponding correlation coefficients.
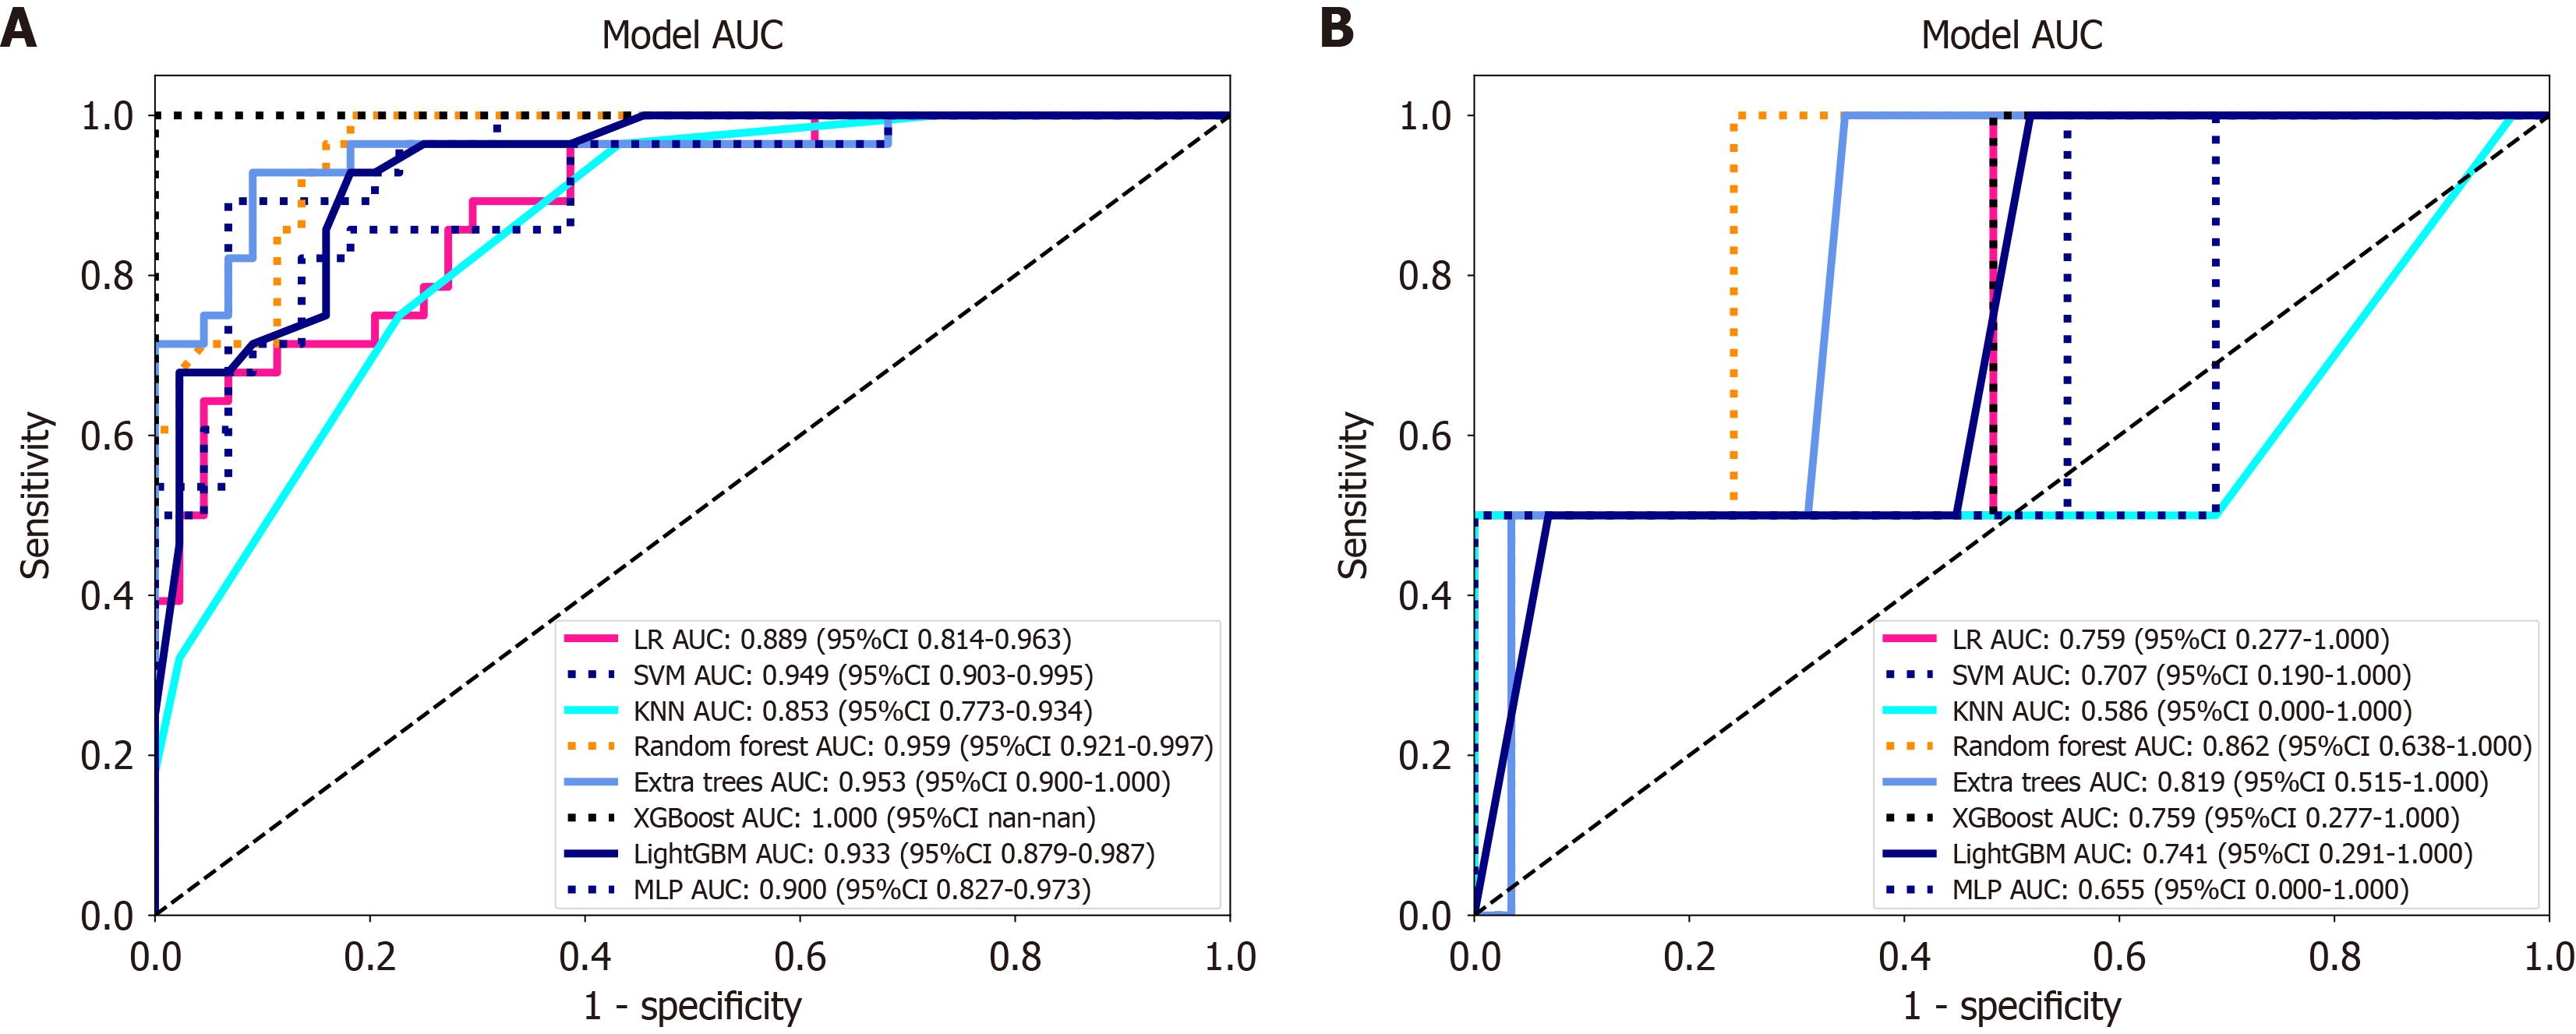
Figure 3 Receiver operating characteristic curves of radiomics models in training and testing cohorts.
A: Receiver operating characteristic curve of the radiomics model in the training cohort, showing the model’s discriminatory performance; B: Receiver operating characteristic curve of the radiomics model in the testing cohort, demonstrating the model’s predictive performance on unseen data. AUC: Area under the curve; KNN: K-nearest neighbors; LightGBM: Light Gradient Boosting Machine; LR: Logistic regression; MLP: Multilayer perceptron; SVM: Support vector machine; XGBoost: Extreme gradient boosting.
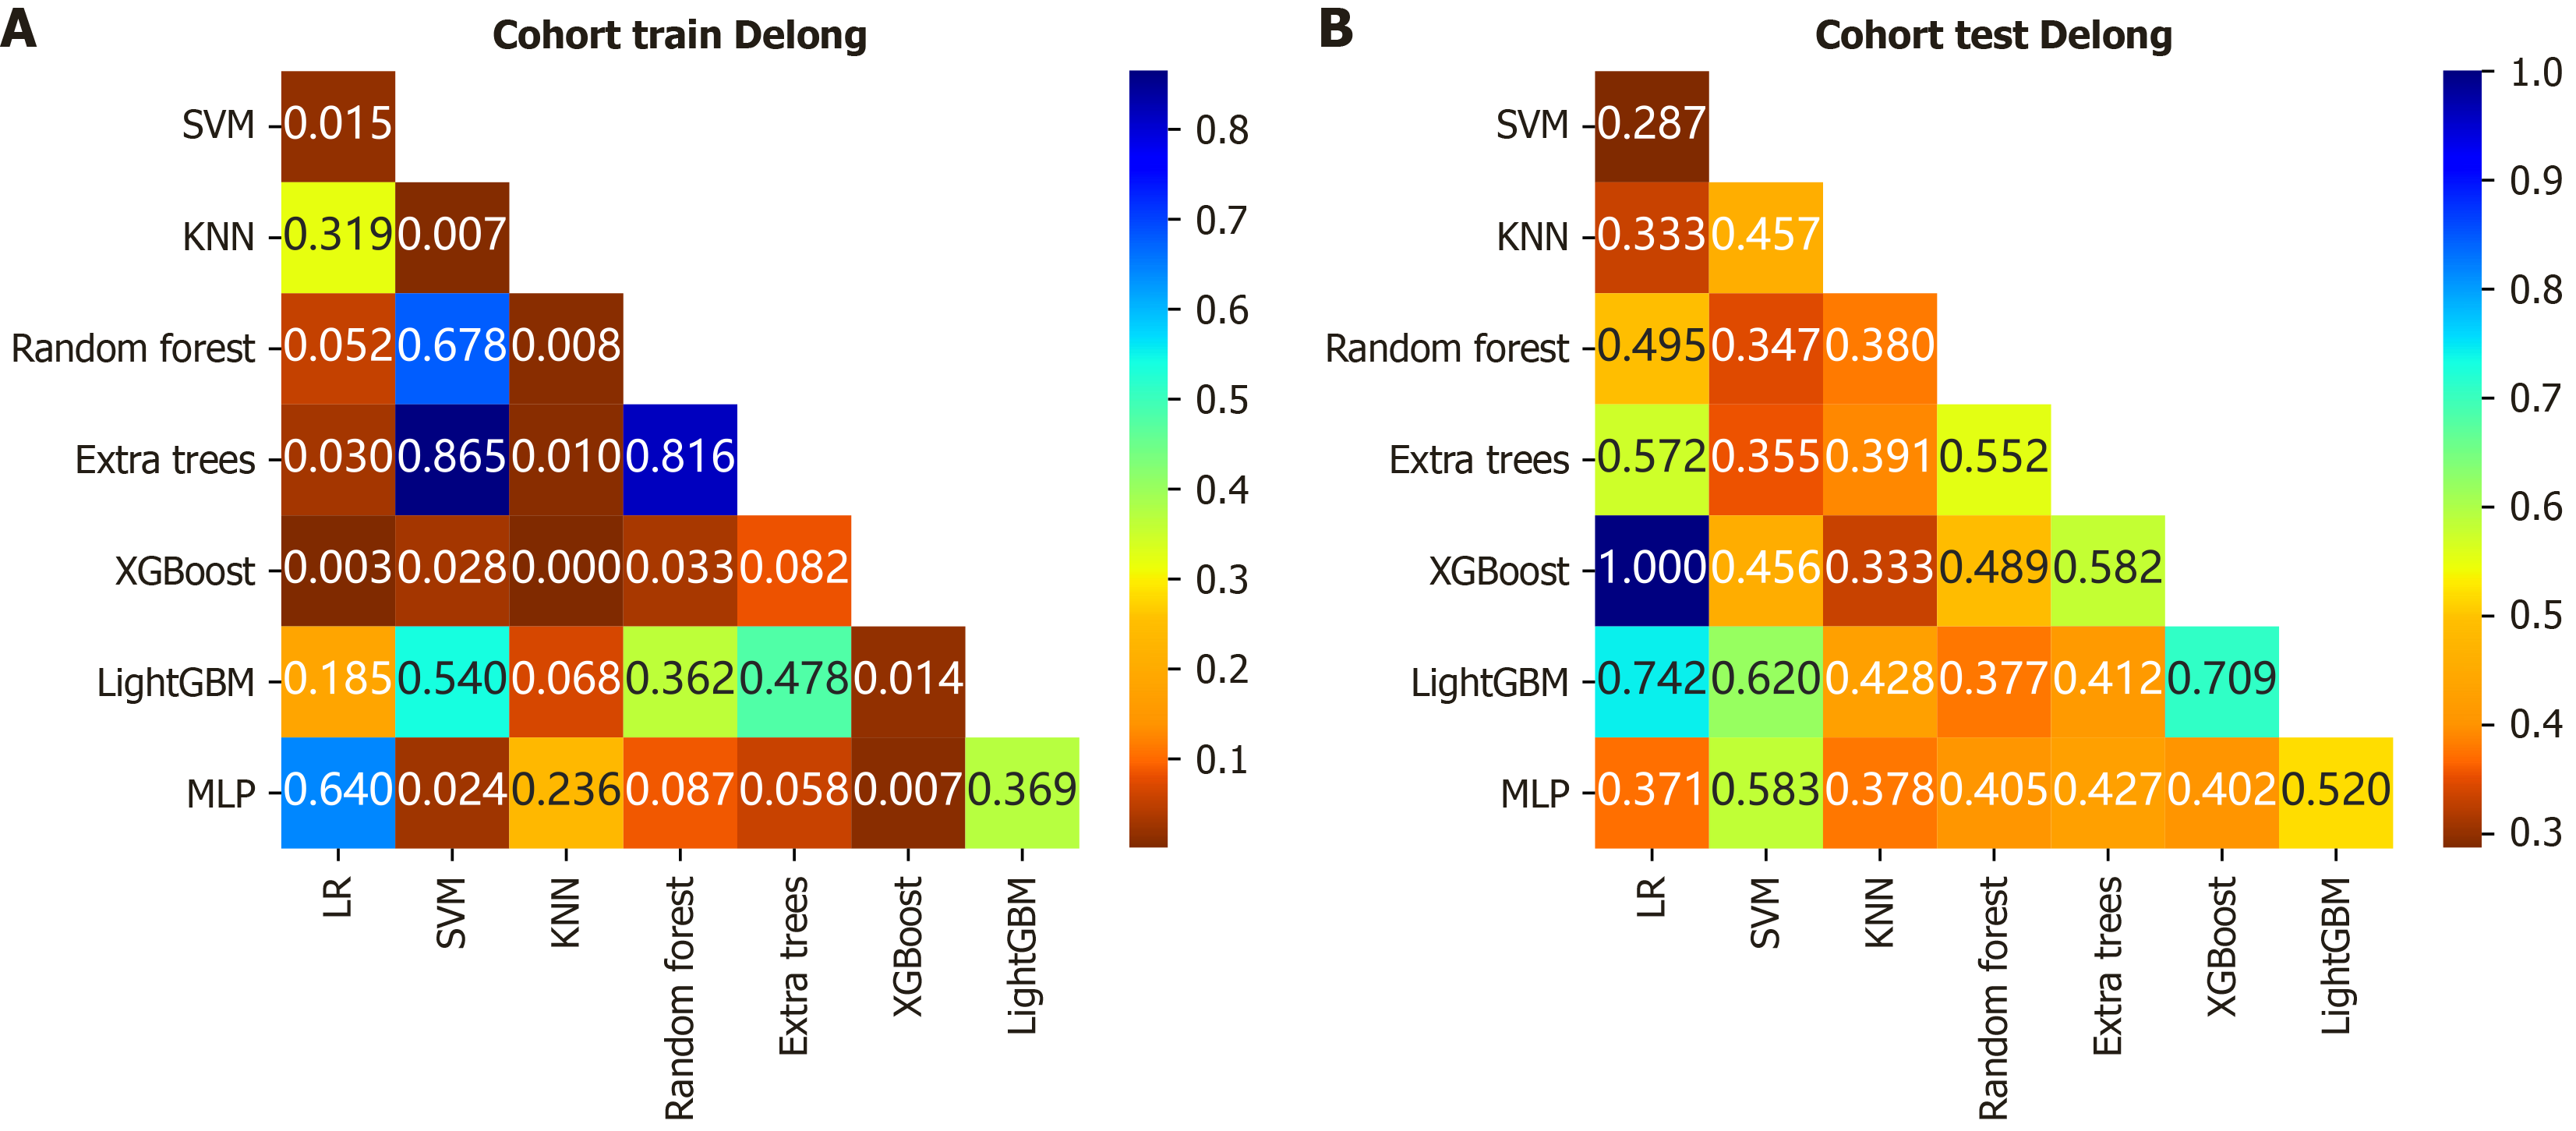
Figure 4 Comparison of area under the curve values for radiomics models using DeLong’s test in training and testing cohorts.
A: DeLong test results comparing area under the curve values of the radiomics model in the training cohort, indicating statistical differences in model performance; B: DeLong test results comparing area under the curve values of the radiomics model in the testing cohort, assessing the significance of predictive performance differences on independent data. KNN: K-nearest neighbors; LightGBM: Light Gradient Boosting Machine; LR: Logistic regression; MLP: Multilayer perceptron; SVM: Support vector machine; XGBoost: Extreme gradient boosting.
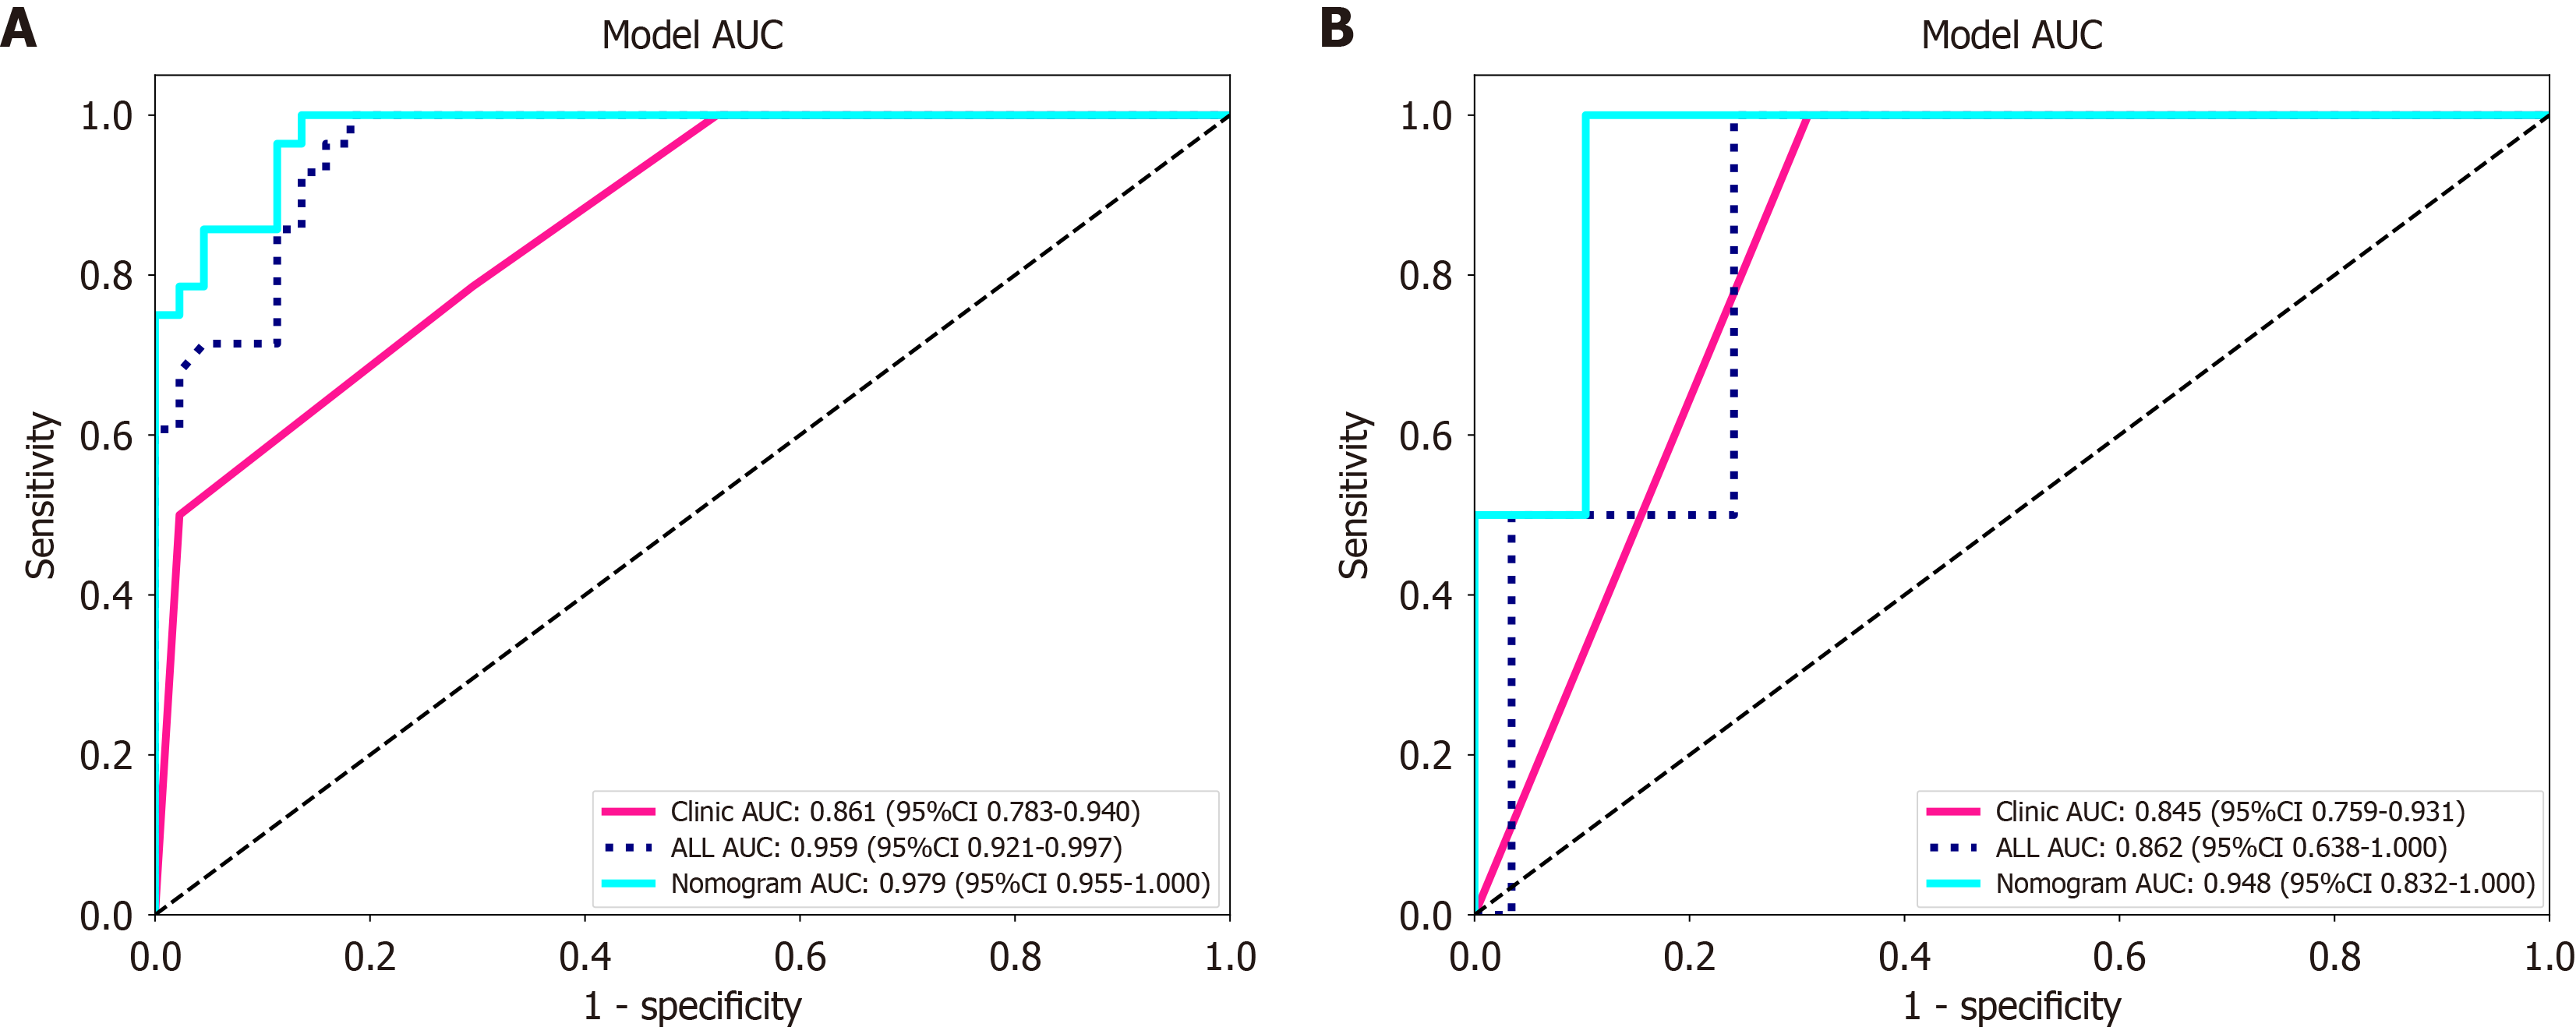
Figure 5 Receiver operating characteristic curves of clinical, radiomics, and combined models in training and testing cohorts.
A: Receiver operating characteristic curves for the clinical model, random forest radiomics model, and combined nomogram model in the training cohort, illustrating comparative predictive performance; B: Receiver operating characteristic curves for the clinical model, random forest radiomics model, and combined nomogram model in the testing cohort, demonstrating model performance on independent data. Clinic: Clinical model; ALL: Random forest radiomics model; Nomogram: Combined model; AUC: Area under the curve.
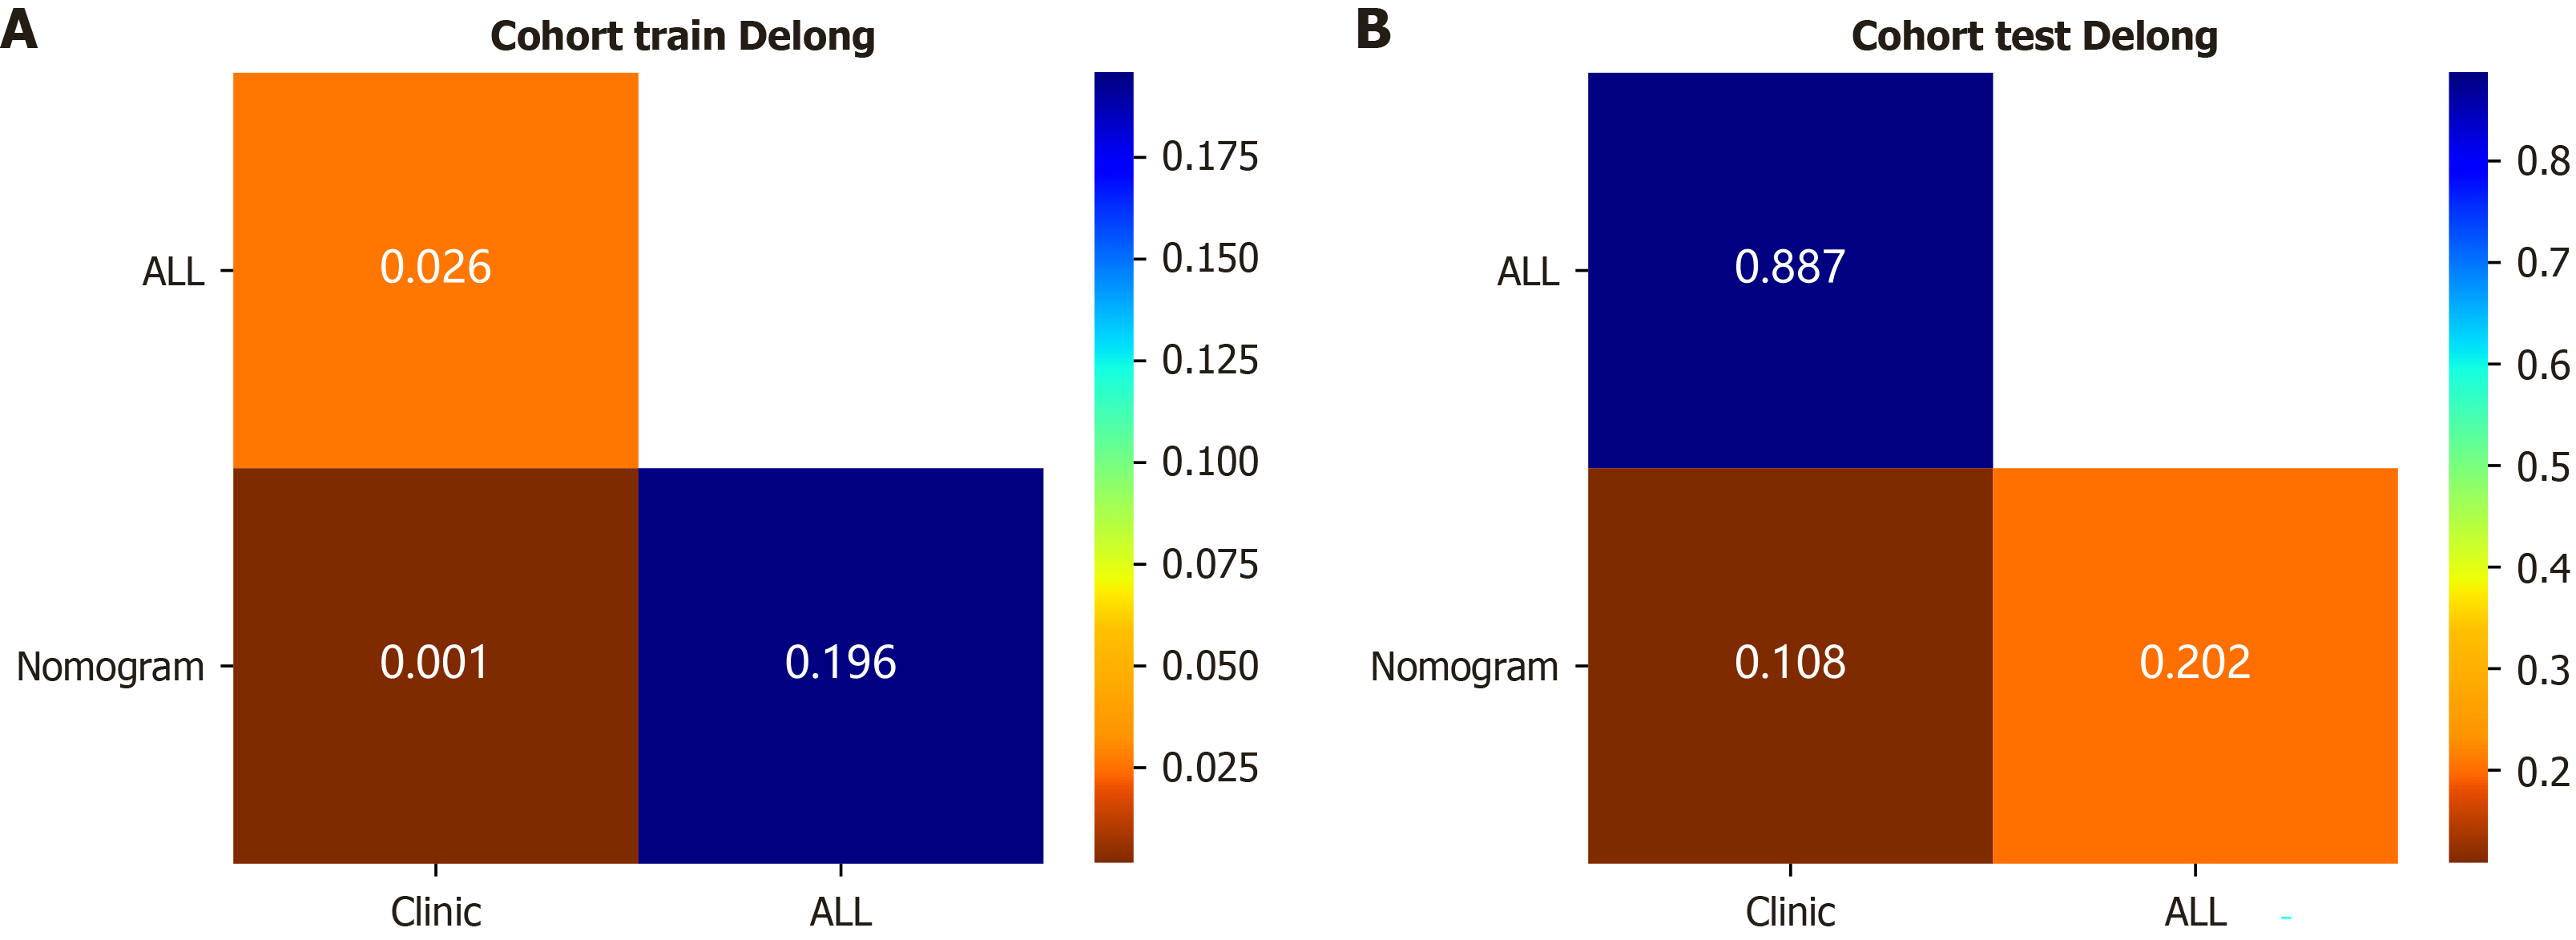
Figure 6 DeLong test comparison of area under the curve values for clinical, radiomics, and combined models in training and testing cohorts.
A: DeLong test results comparing area under the curve values of the clinical model, random forest radiomics model, and combined nomogram model in the training cohort, indicating statistical differences in model performance; B: DeLong test results comparing area under the curve values of the clinical model, random forest radiomics model, and combined nomogram model in the testing cohort, assessing the significance of predictive performance differences on independent data. Clinic: Clinical model; ALL: Random forest radiomics model; Nomogram: Combined model.
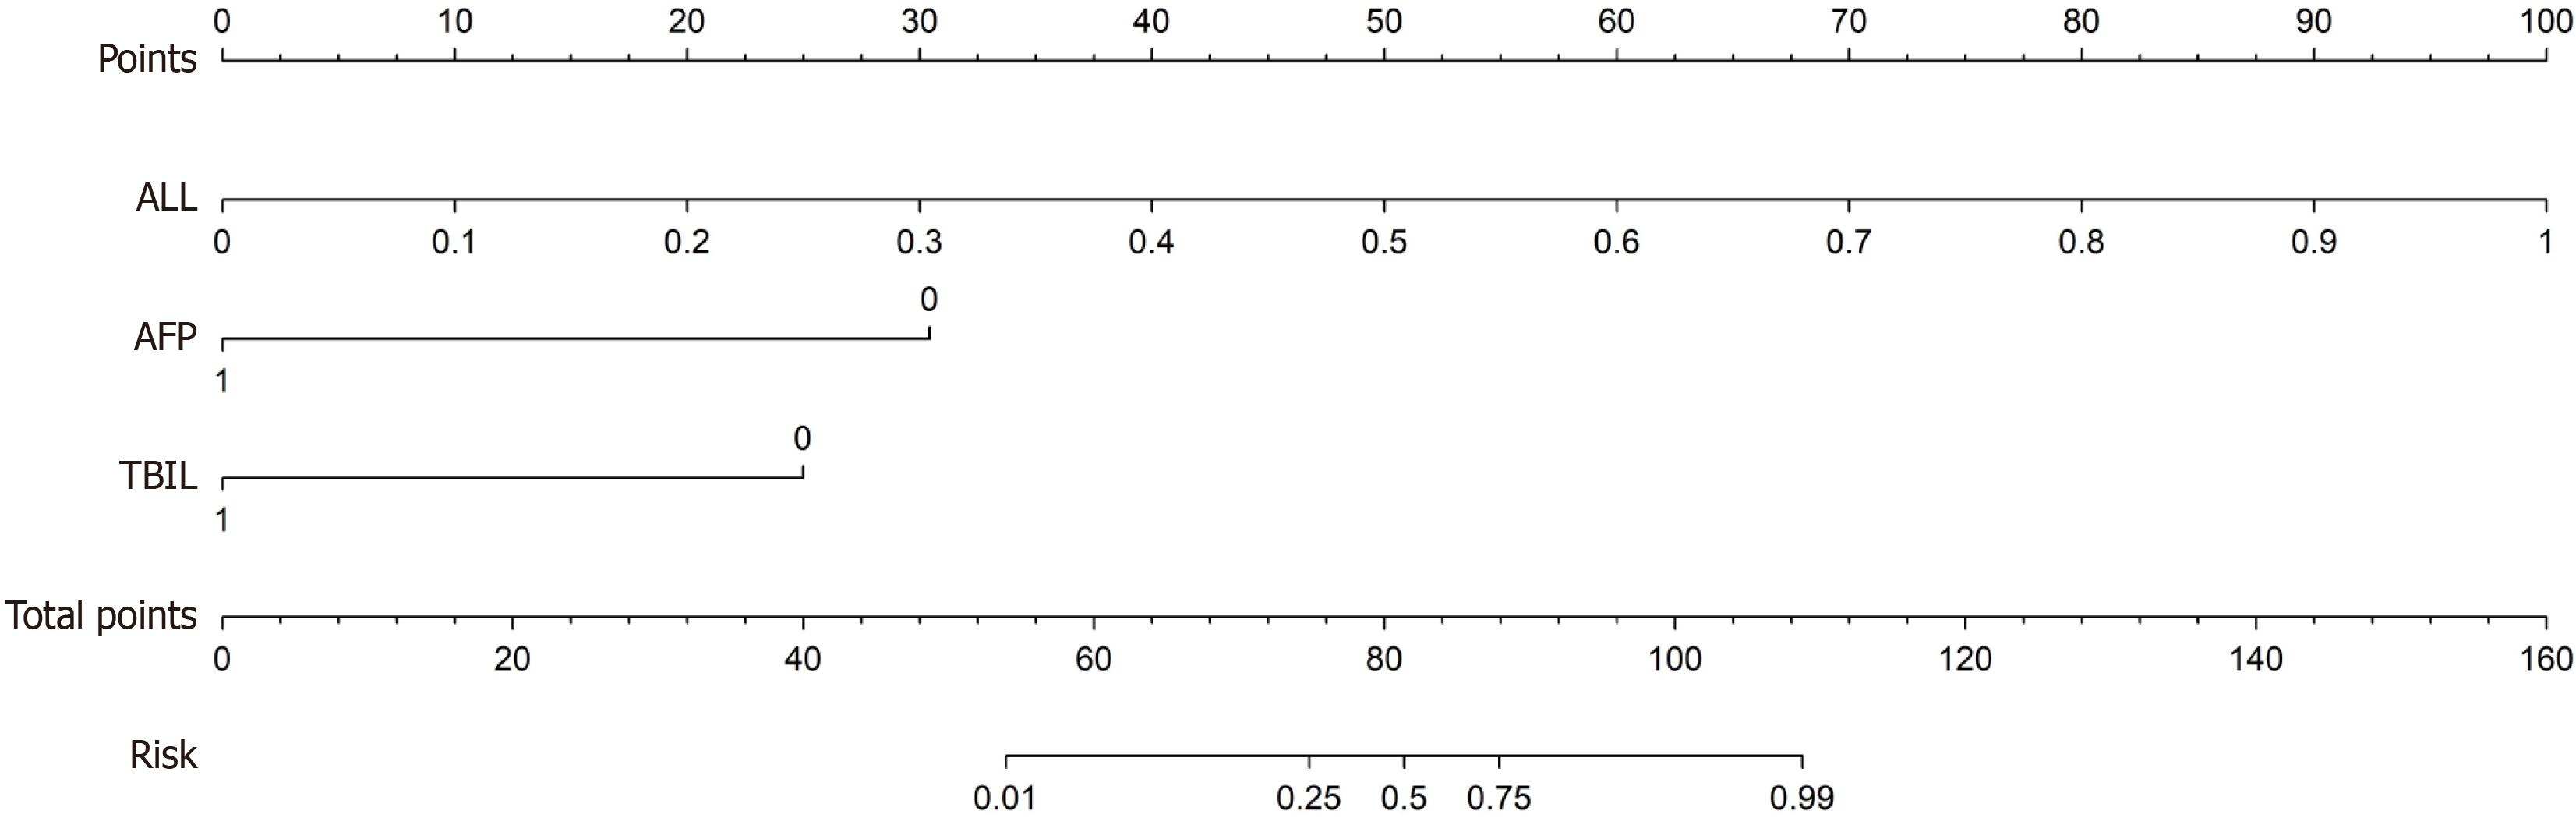
Figure 7 Nomogram constructed based on the combined model.
AFP: Alpha-fetoprotein; TBIL: Total bilirubin; ALL: Random forest radiomics model; Points: Item score; Total Points: Overall score; Risk: Predicted probability.
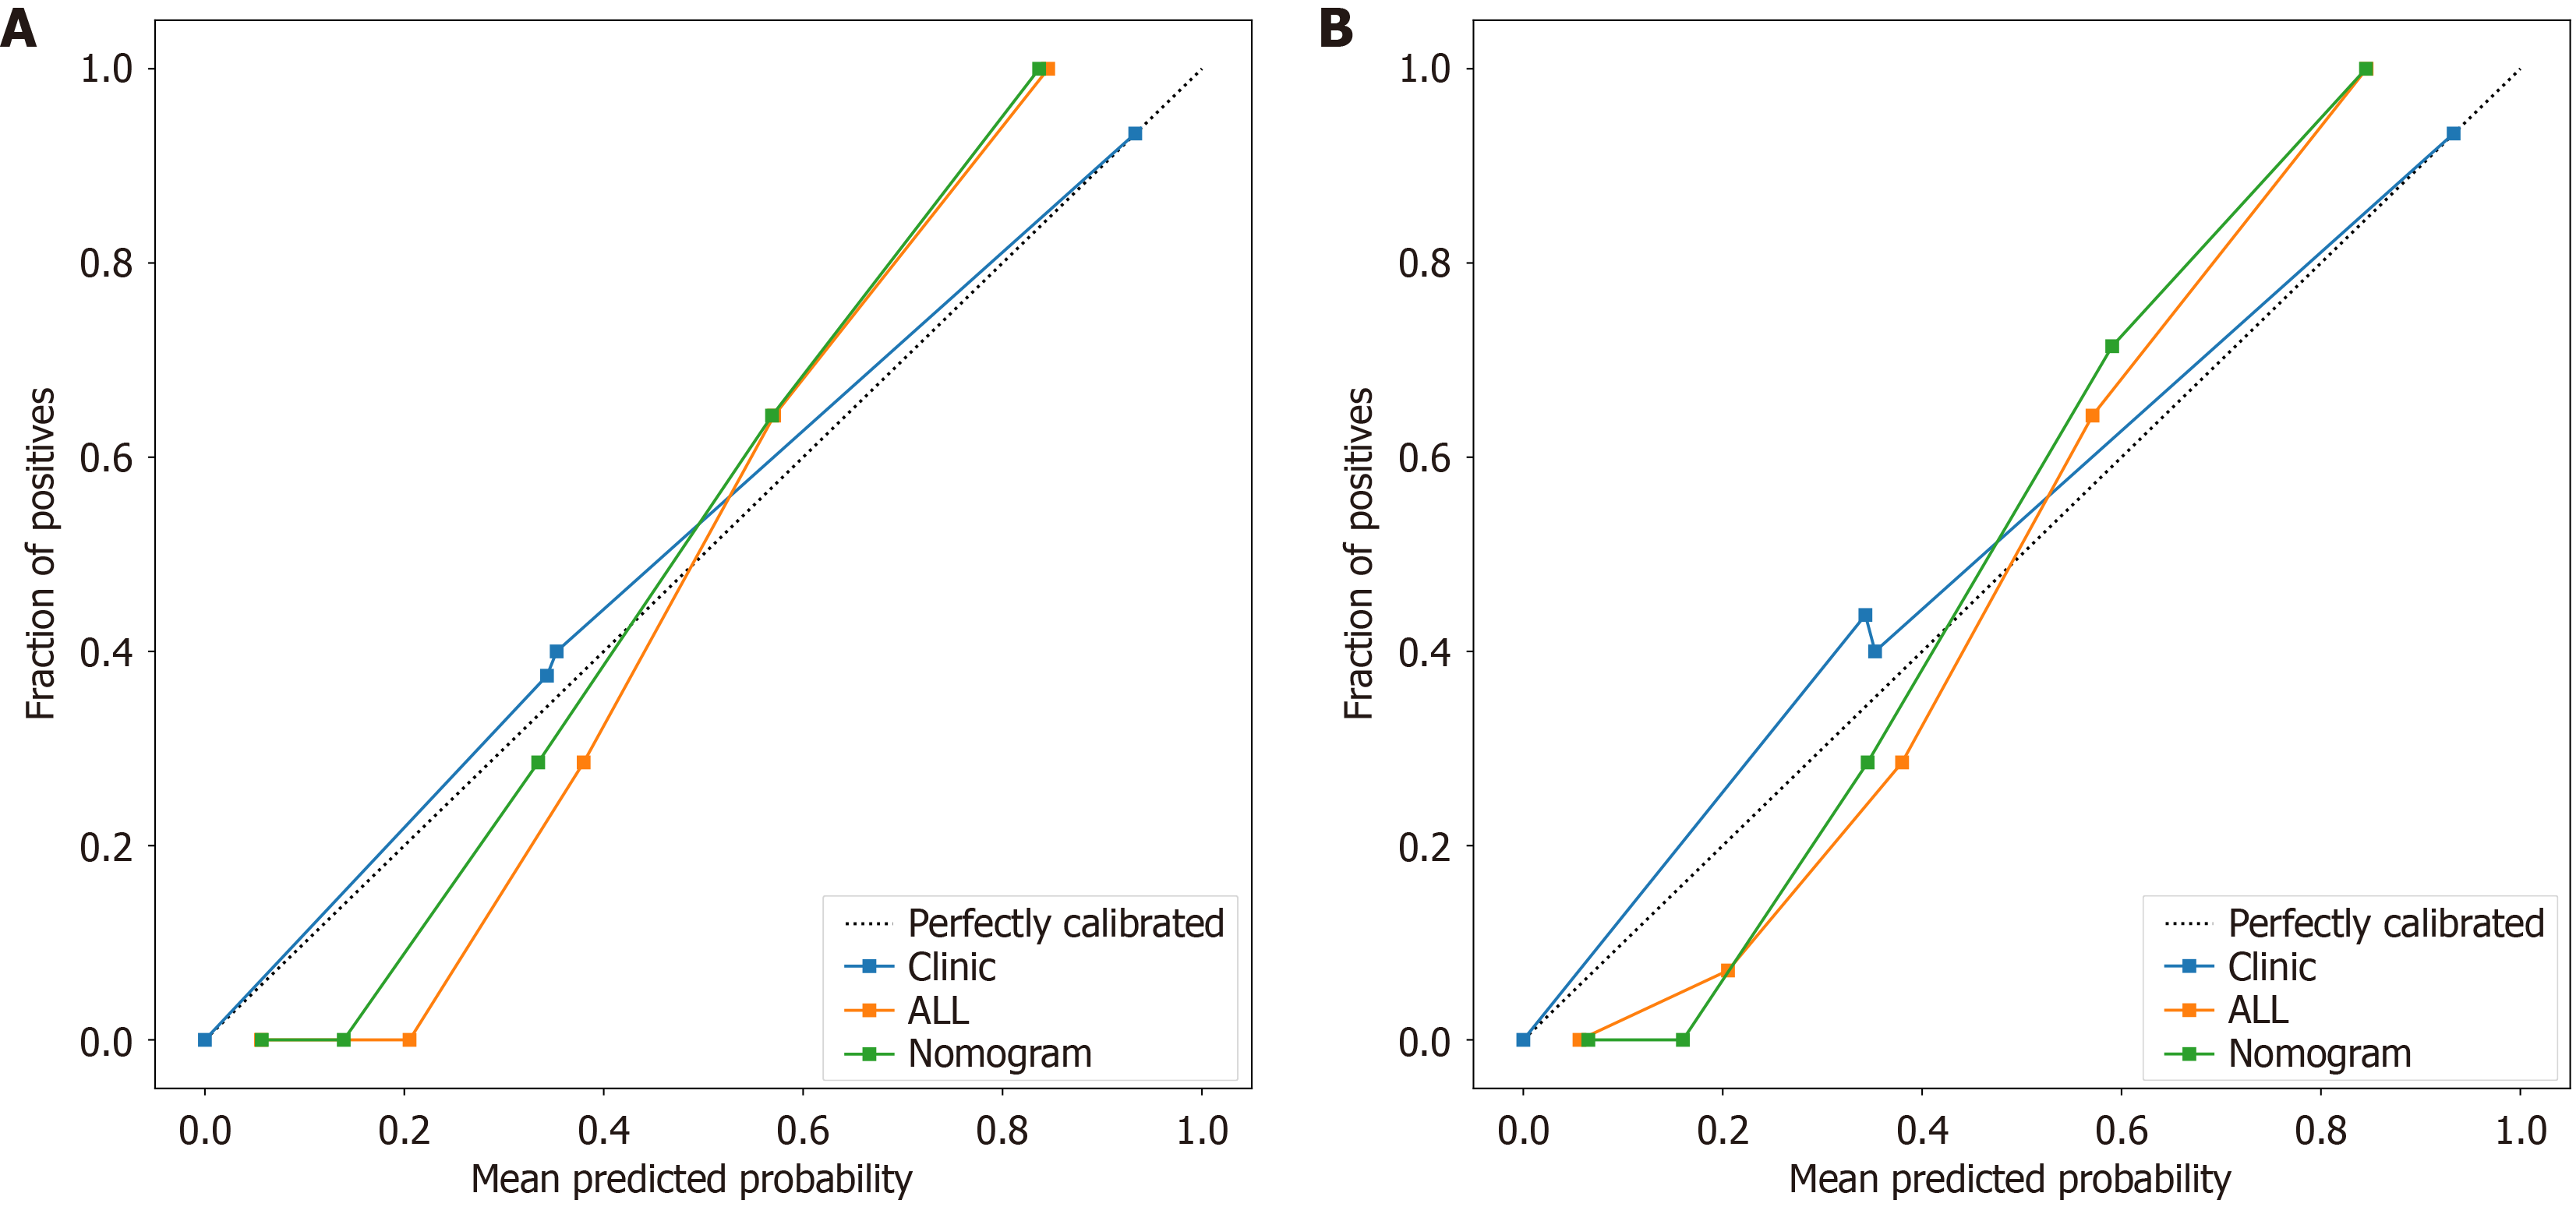
Figure 8 Calibration curves for the training and testing cohorts.
A: Calibration curve of the model in the training cohort, illustrating the agreement between predicted and observed probabilities; B: Calibration curve of the model in the testing cohort, demonstrating the model’s calibration performance on independent data. Clinic: Clinical model; ALL: Random forest radiomics model; Nomogram: Combined model.
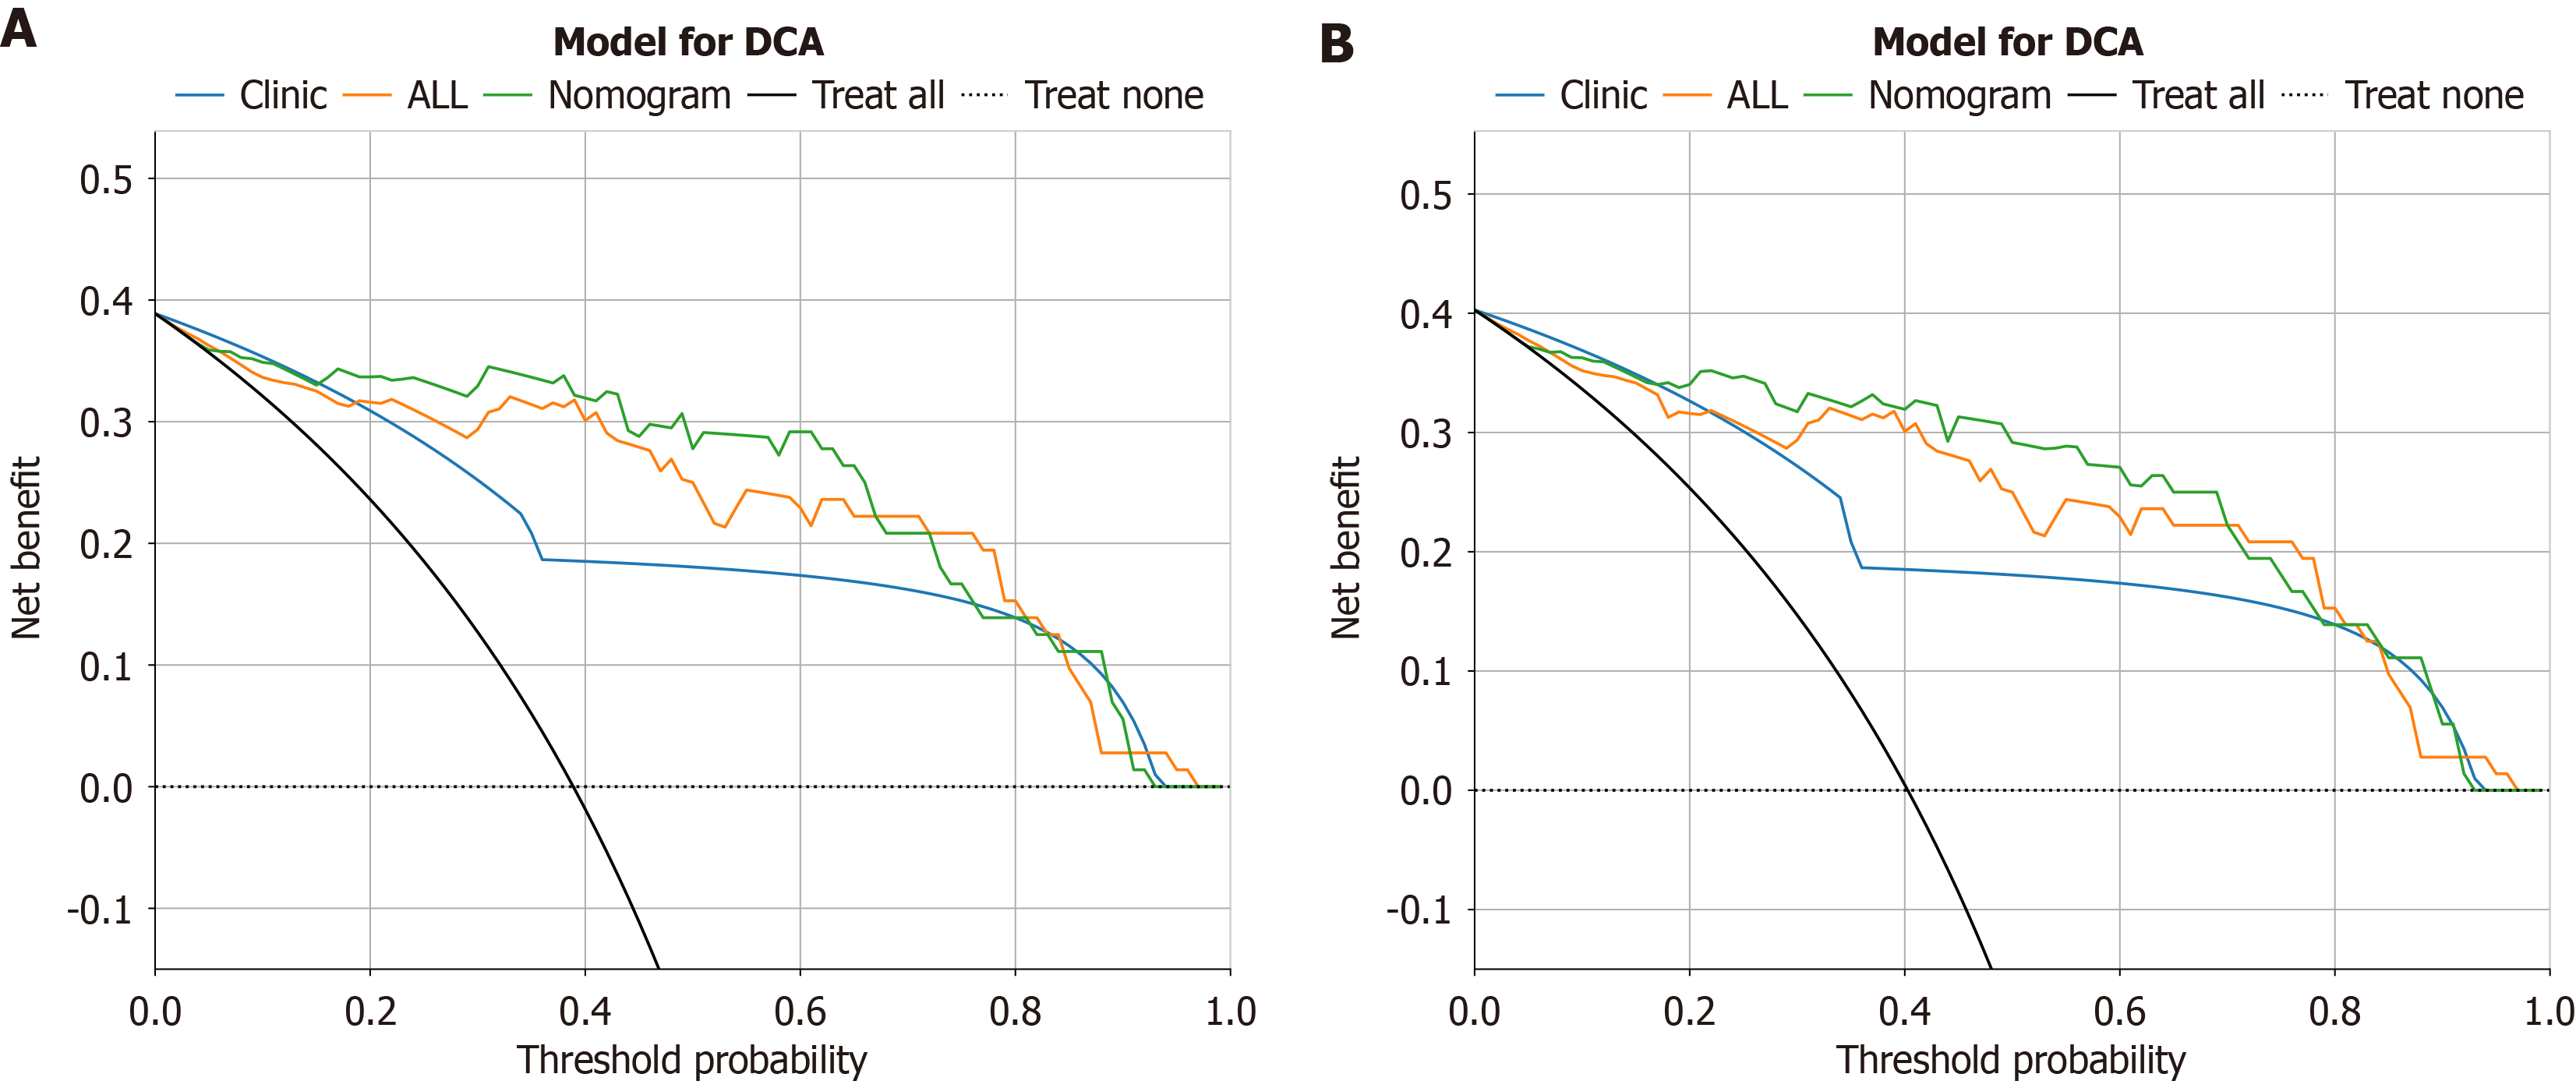
Figure 9 Decision curve analysis for the training and testing cohorts.
A: Decision curve of the model in the training cohort, showing the net clinical benefit across a range of threshold probabilities; B: Decision curve of the model in the testing cohort, presenting the model’s clinical utility when applied to unseen data. Clinic: Clinical model; ALL: Random forest radiomics model; Nomogram: Combined model; DCA: Decision curve analysis.
- Citation: Zheng ZH, Wu CH, Hu JB, Xu JF, Zi XY, Chen JH, He Q, Dong WY. Computed tomography radiomics-based machine learning nomogram for preoperative prediction of glypican-3 expression in hepatocellular carcinoma. World J Radiol 2026; 18(7): 121161
- URL: https://www.wjgnet.com/1949-8470/full/v18/i7/121161.htm
- DOI: https://dx.doi.org/10.4329/wjr.121161