
















Copyright: ©Author(s) 2026.
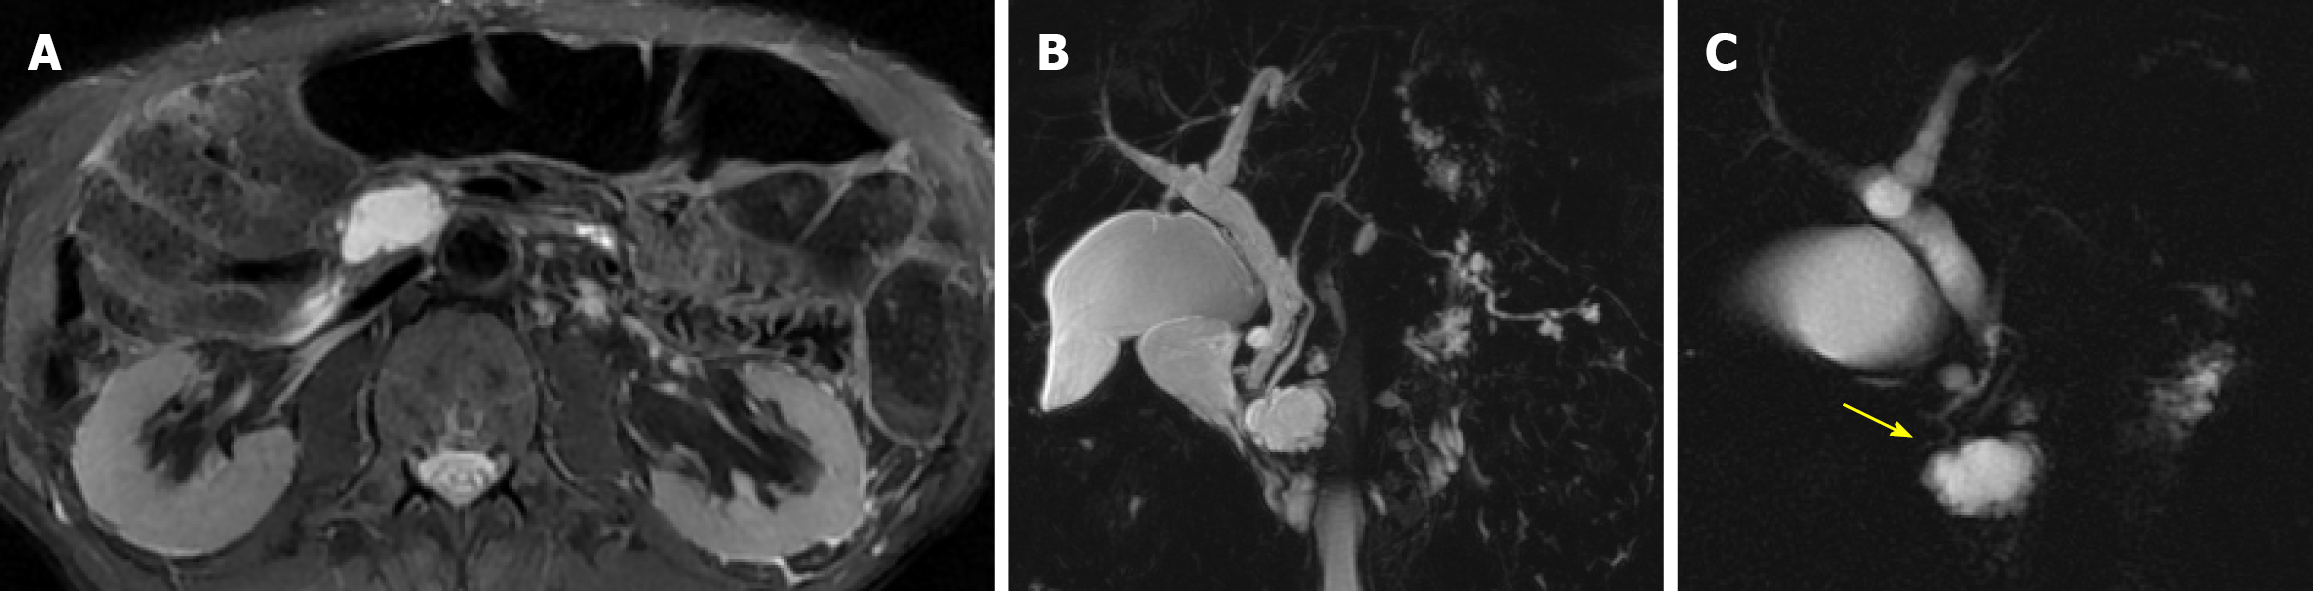
Figure 1 Typical magnetic resonance imaging appearance of branch-duct intraductal papillary mucinous neoplasm.
A: Axial T2-weighted image shows a cystic lesion in the pancreatic head; B: Magnetic resonance cholangiopancreatography maximum intensity projection reconstruction demonstrates multiple cystic lesions scattered throughout the pancreatic parenchyma, appearing to communicate with the main pancreatic duct, which is of normal caliber; C: Thick-slab magnetic resonance cholangiopancreatography better depicts communication between the largest cystic lesion and the pancreatic ductal system (arrow).
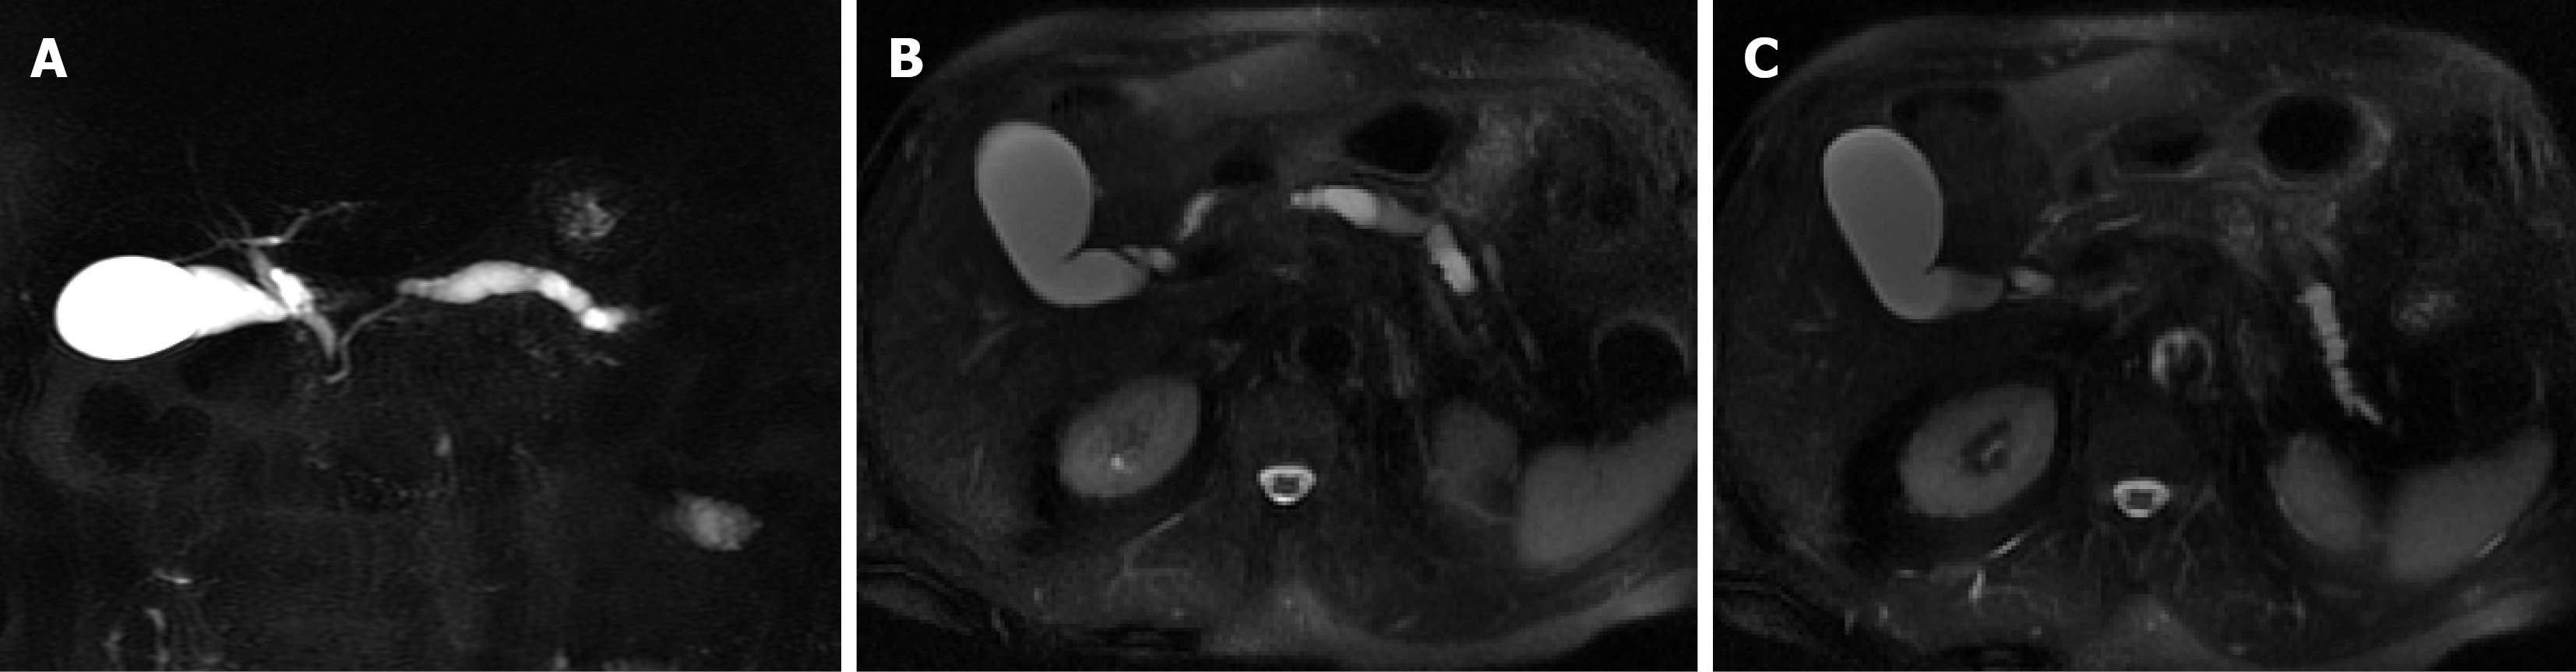
Figure 2 Main-duct intraductal papillary mucinous neoplasm with segmental duct dilatation.
A: Thick-slab magnetic resonance cholangio
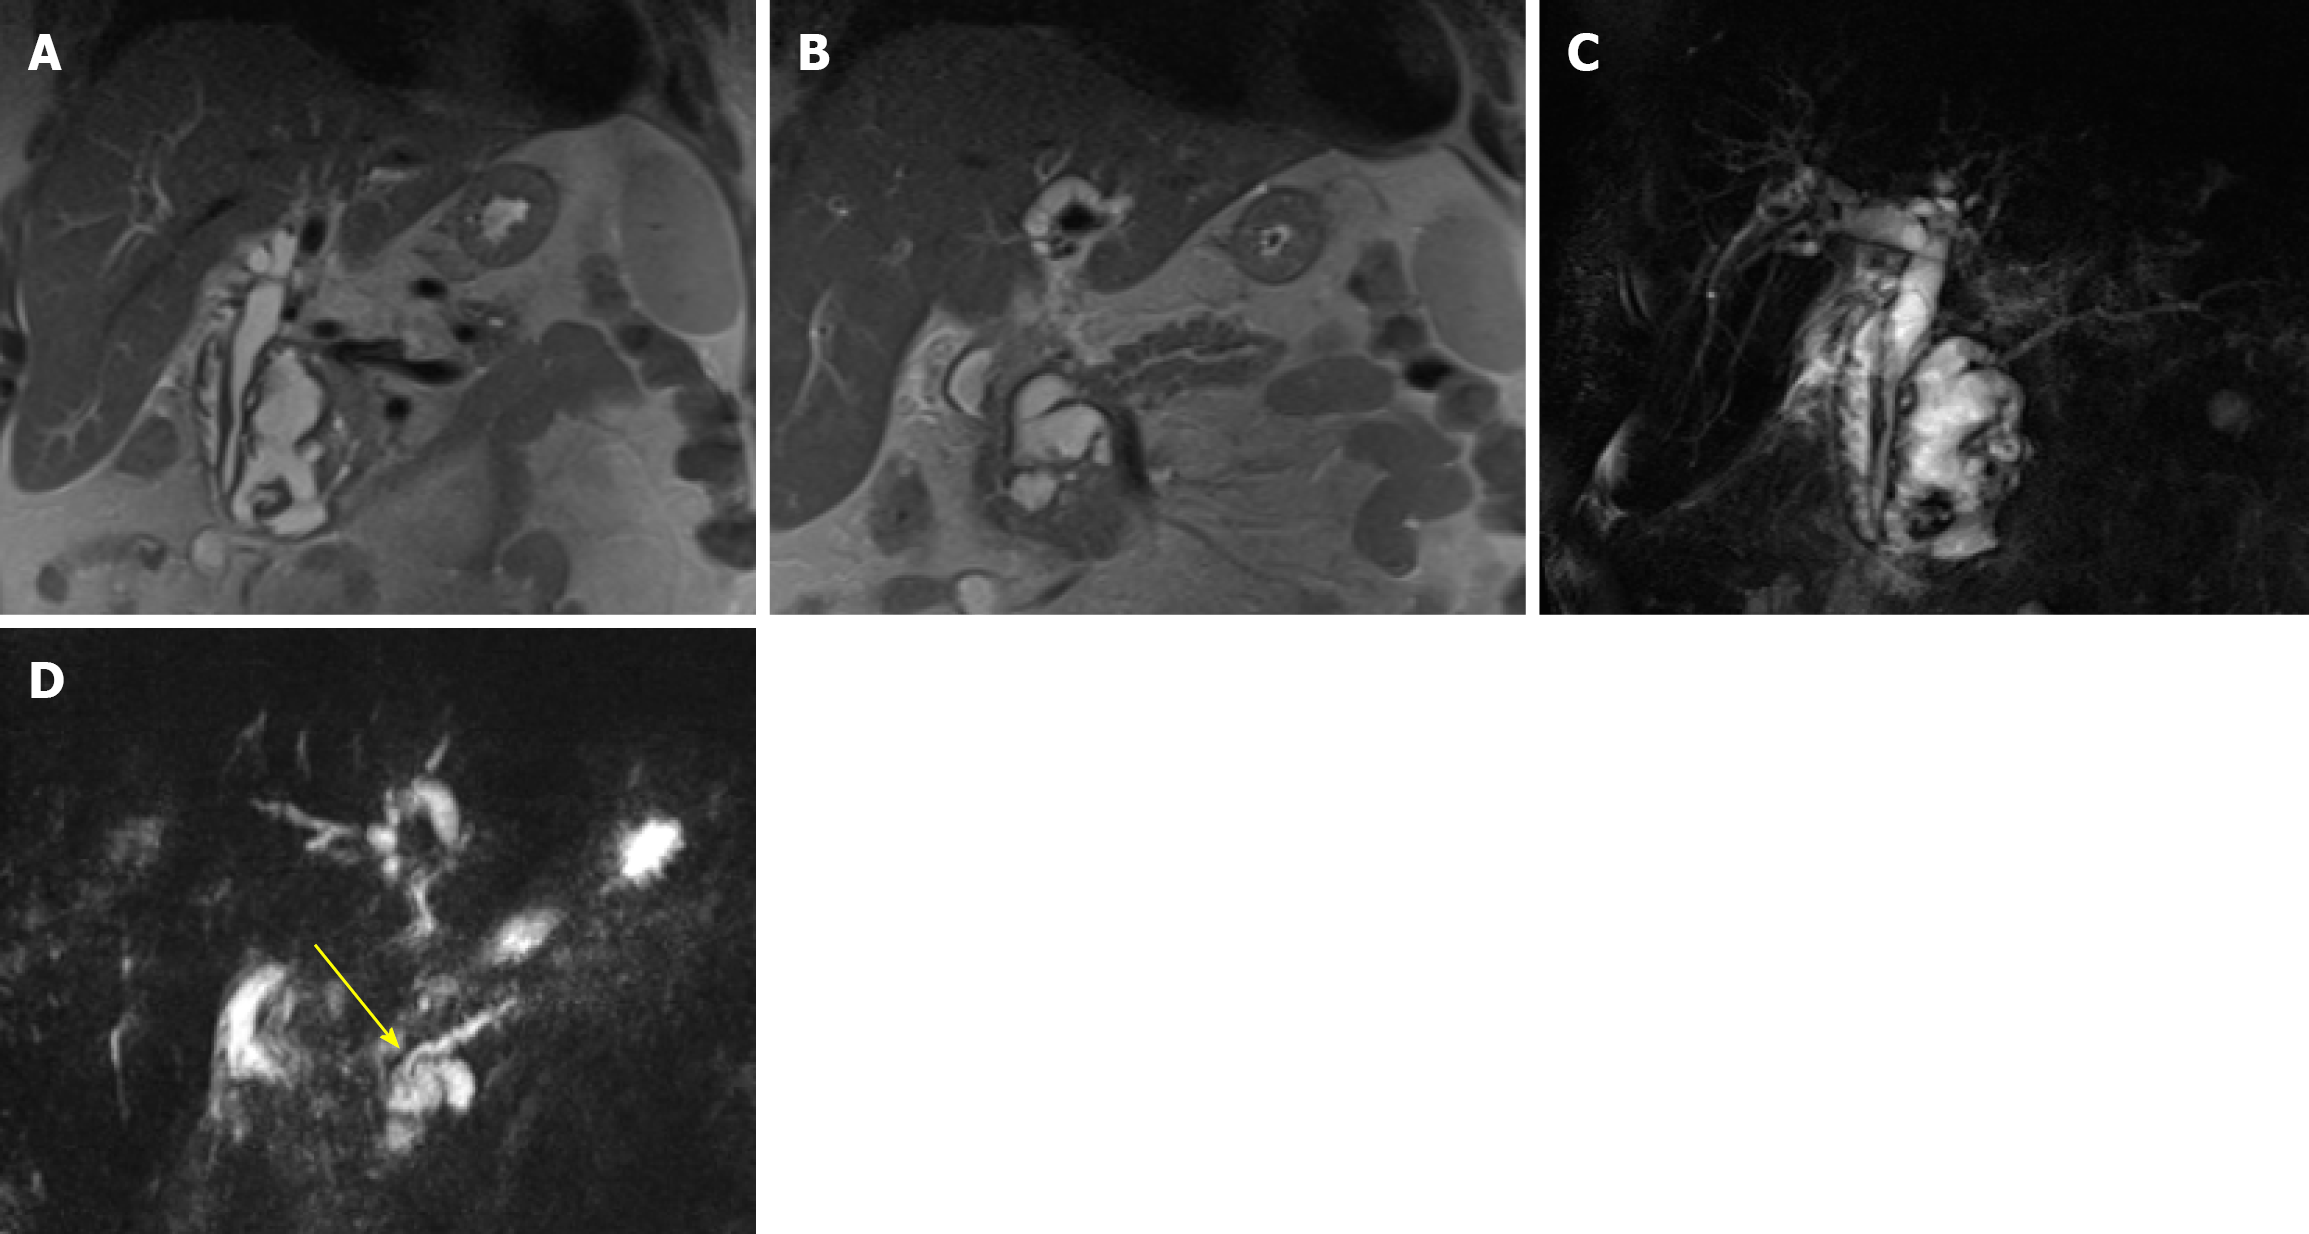
Figure 3 Mixed-type intraductal papillary mucinous neoplasm with segmental main duct dilatation.
A and B: Coronal single-shot T2-weighted images show irregular cystic dilatation of the main pancreatic duct in the pancreatic head, with involvement of multiple side branches; C: Thick-slab magnetic resonance cholangiopancreatography provides a comprehensive depiction of the lesion morphology; D: Thin-slab magnetic resonance cholangiopancreatography highlights the site of abrupt caliber change of the main pancreatic duct (arrow) without endoluminal signal interruption.
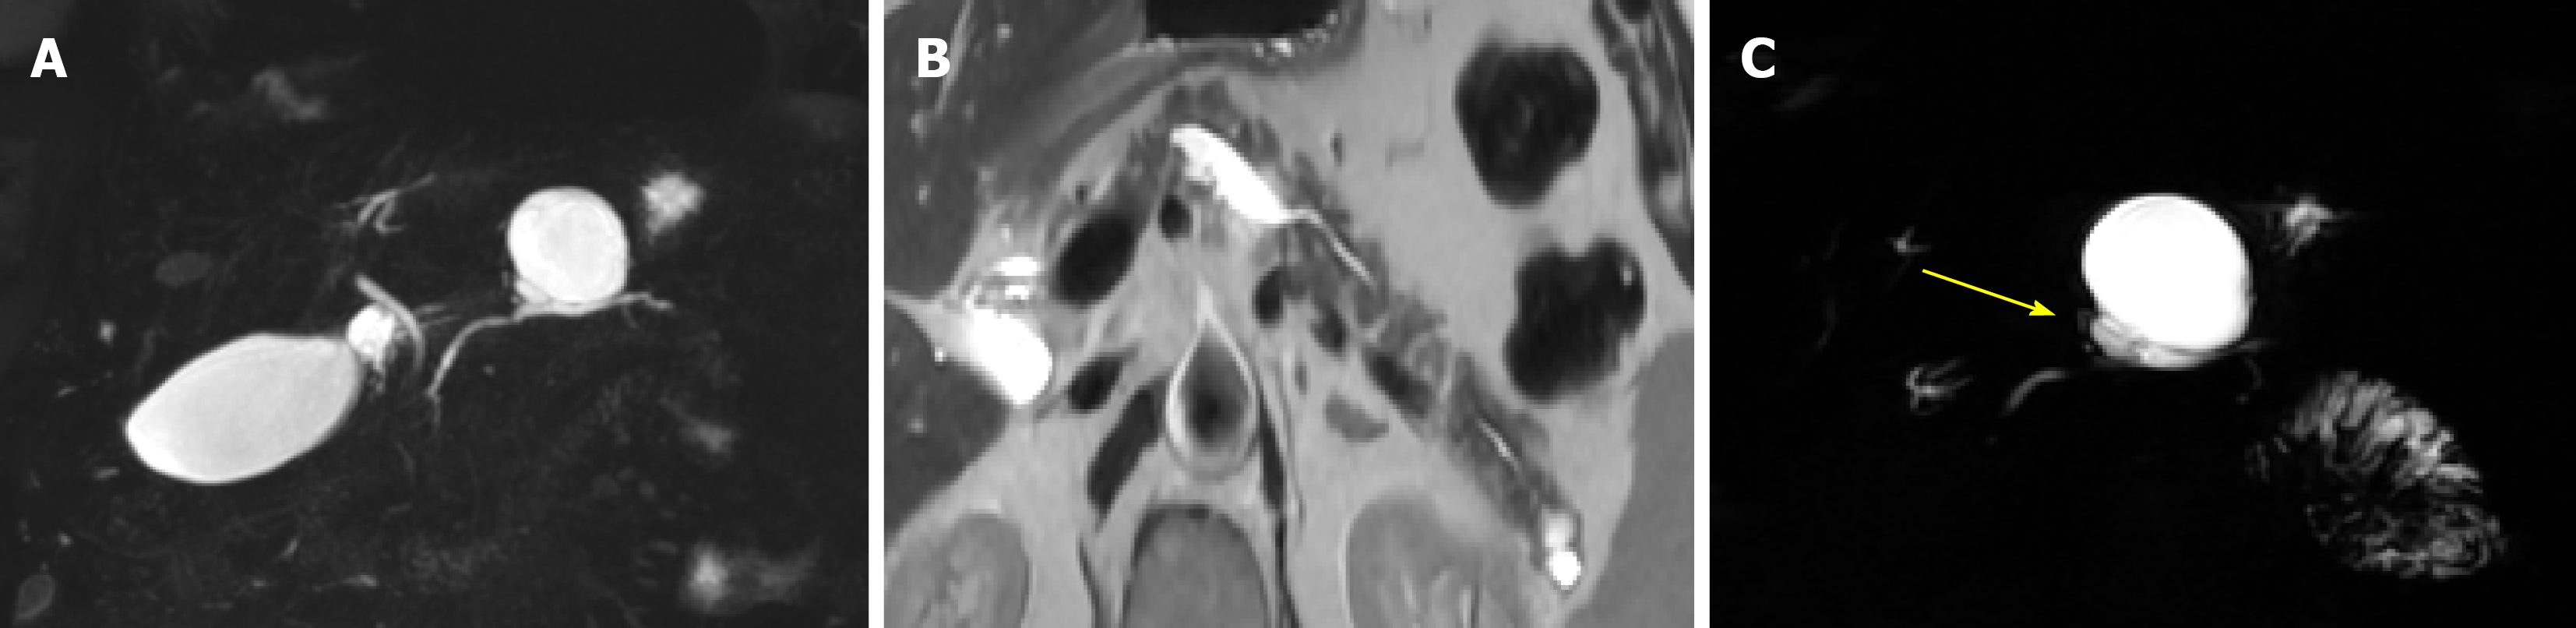
Figure 4 Atypical unilocular intraductal papillary mucinous neoplasm.
A: Thick-slab magnetic resonance cholangiopancreatography demonstrates a predominantly unilocular cystic lesion with subtle caudal septations located adjacent to the main pancreatic duct. This appearance may mimic a mucinous cystic neoplasm, posing a diagnostic challenge; B: Axial single-shot T2-weighted image shows segmental dilatation of the main pancreatic duct in the isthmus and body, with preserved upstream ductal caliber; C: Thin-slab magnetic resonance cholangiopancreatography confirms direct communication between the cystic lesion and the main pancreatic duct (arrow), establishing the diagnosis of intraductal papillary mucinous neoplasm.
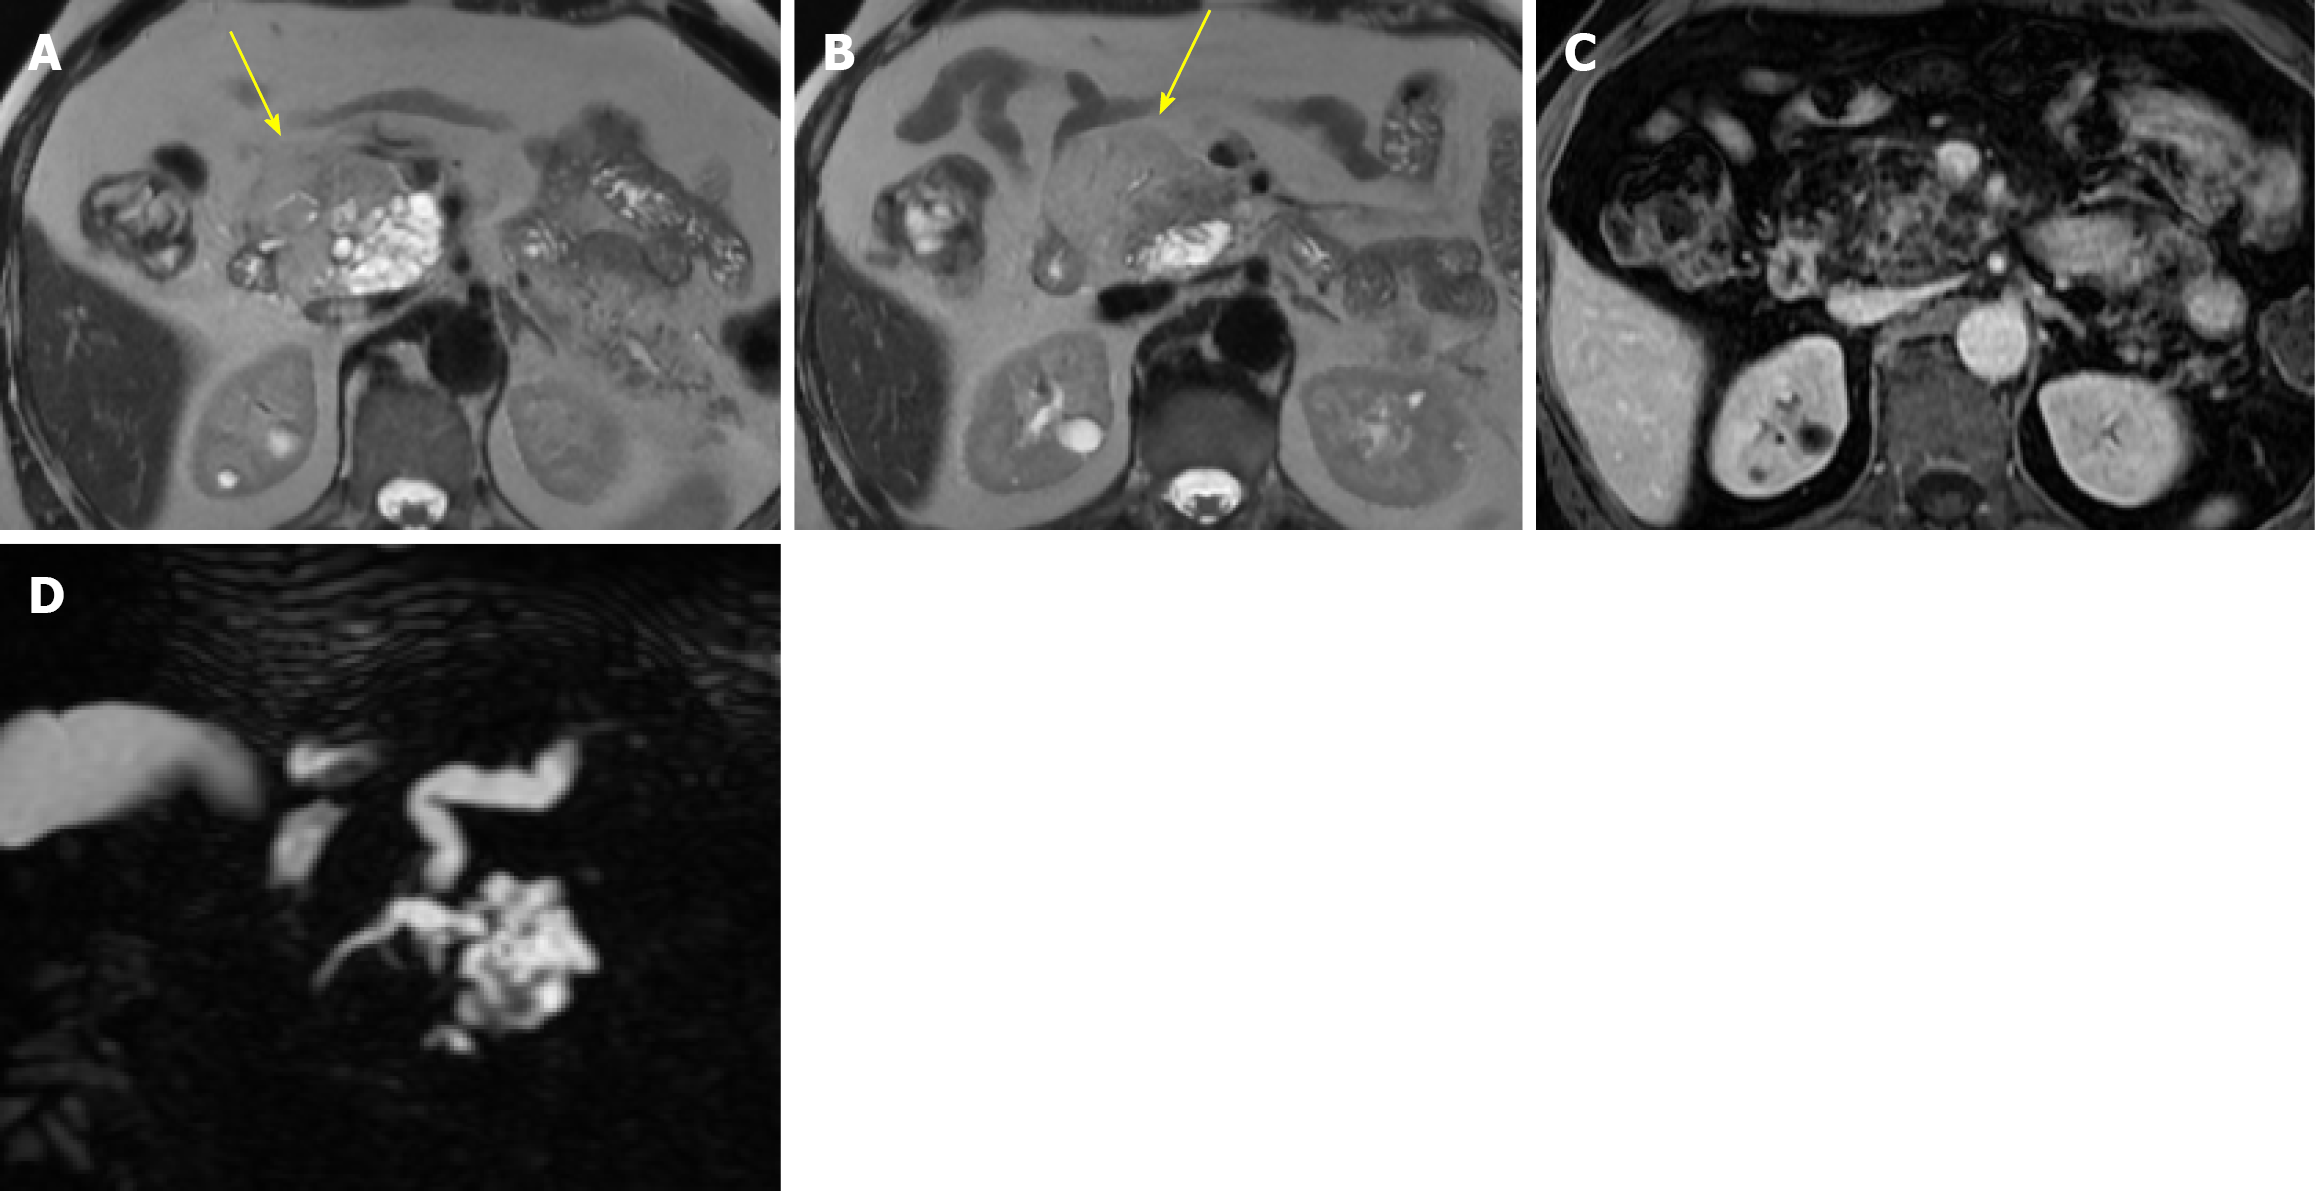
Figure 5 Mixed-type intraductal papillary mucinous neoplasm associated with intrapancreatic lipoma.
A and B: Axial single-shot T2-weighted images show a well-defined intrapancreatic lipoma (arrow) exerting mass effect on the adjacent duodenum and on multiple cystic dilatations; C: Post-contrast T1-weighted image demonstrates compressed cystic lesions in the pancreatic head and uncinate process, raising differential diagnostic considerations between branch-duct intraductal papillary mucinous neoplasm and microcystic serous cystadenoma; D: Magnetic resonance cholangiopancreatography maximum intensity projection reconstruction confirms direct communication between the cystic dilatations and the main pancreatic duct, supporting the diagnosis of mixed-type intraductal papillary mucinous neoplasm (histologically confirmed).
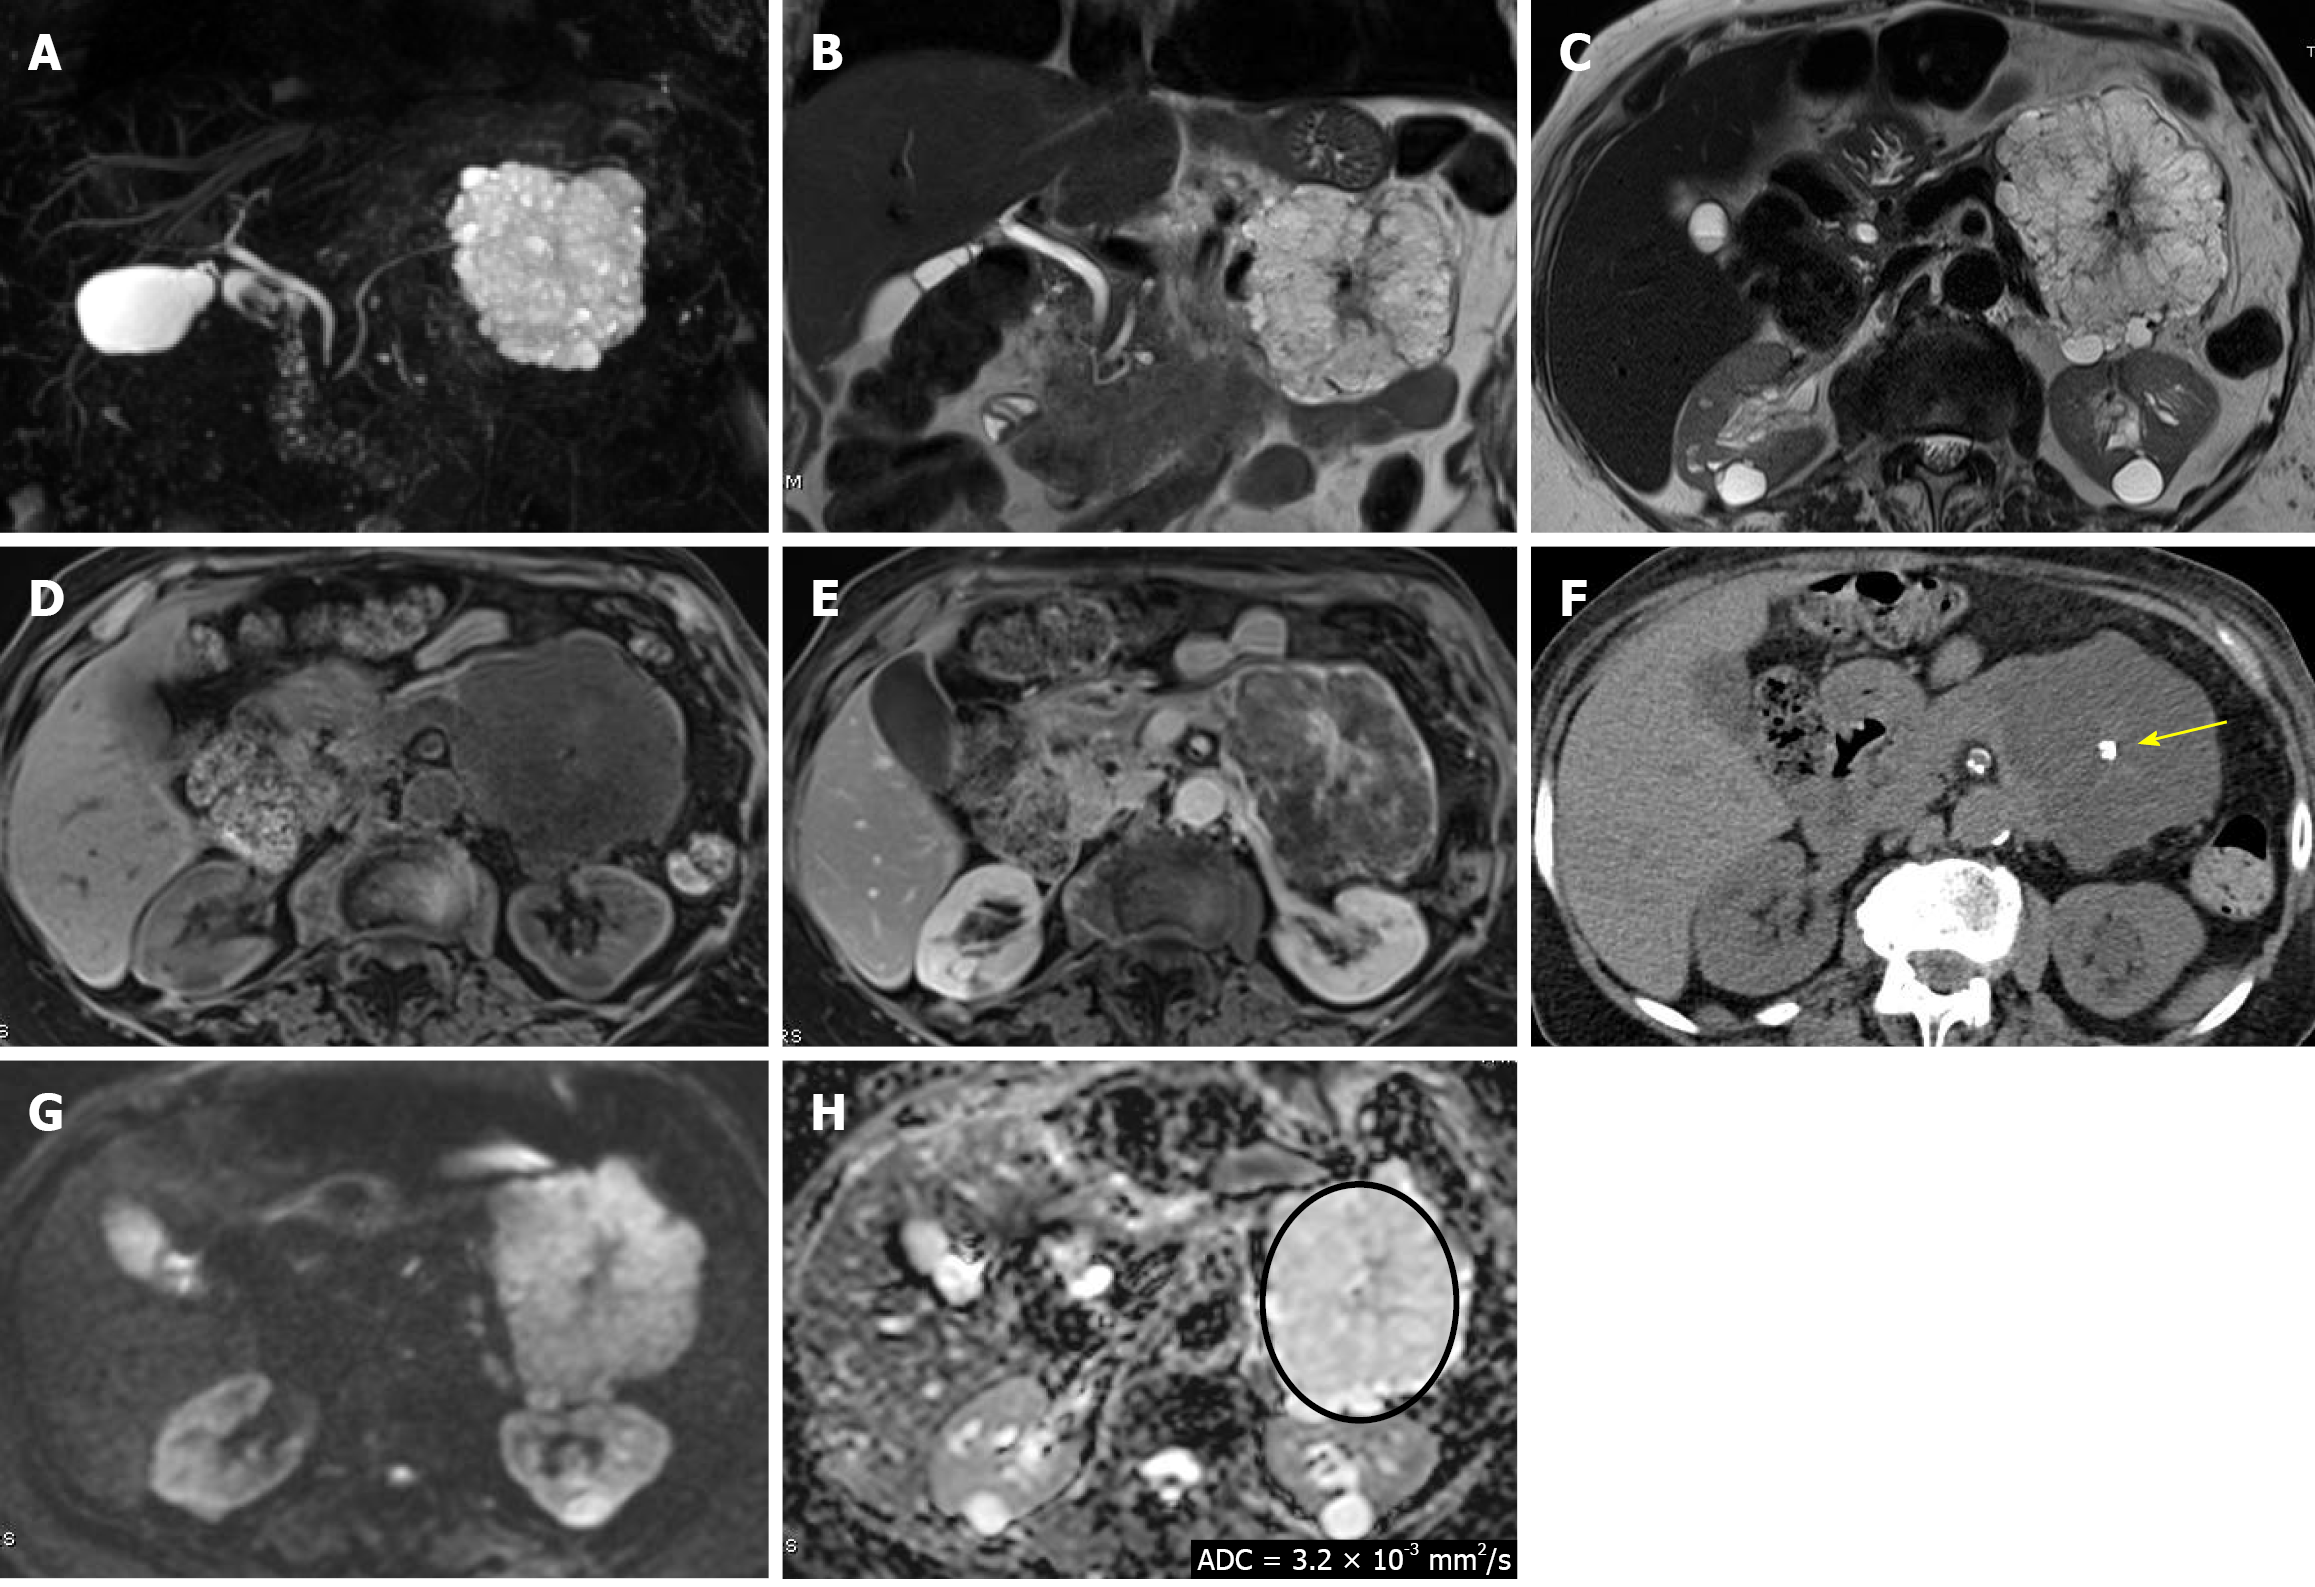
Figure 6 Typical magnetic resonance imaging appearance of serous cystic neoplasm.
A: Magnetic resonance cholangiopancreatography maximum intensity projection reconstruction shows a large microcystic lesion in the pancreatic tail; B and C: Coronal and axial single-shot T2-weighted images demonstrate a markedly hyperintense microcystic mass with thin septa converging toward a central scar; D and E: Pre-contrast and post-contrast T1-weighted images show a hypointense lesion with delayed enhancement of the central scar; F: Non-contrast computed tomography better depictes central scar calcification (arrow); G and H: Diffusion weighted imaging (b = 1000 second/mm2) shows mild hyperintensity on high b values due to T2 shine-through, as confirmed on apparent diffusion coefficient (ADC) map, which presents hyperintense signal, indicating absence of true restriction, and high ADC value (ADC = 3.2 × 10⁻³ mm2/second).
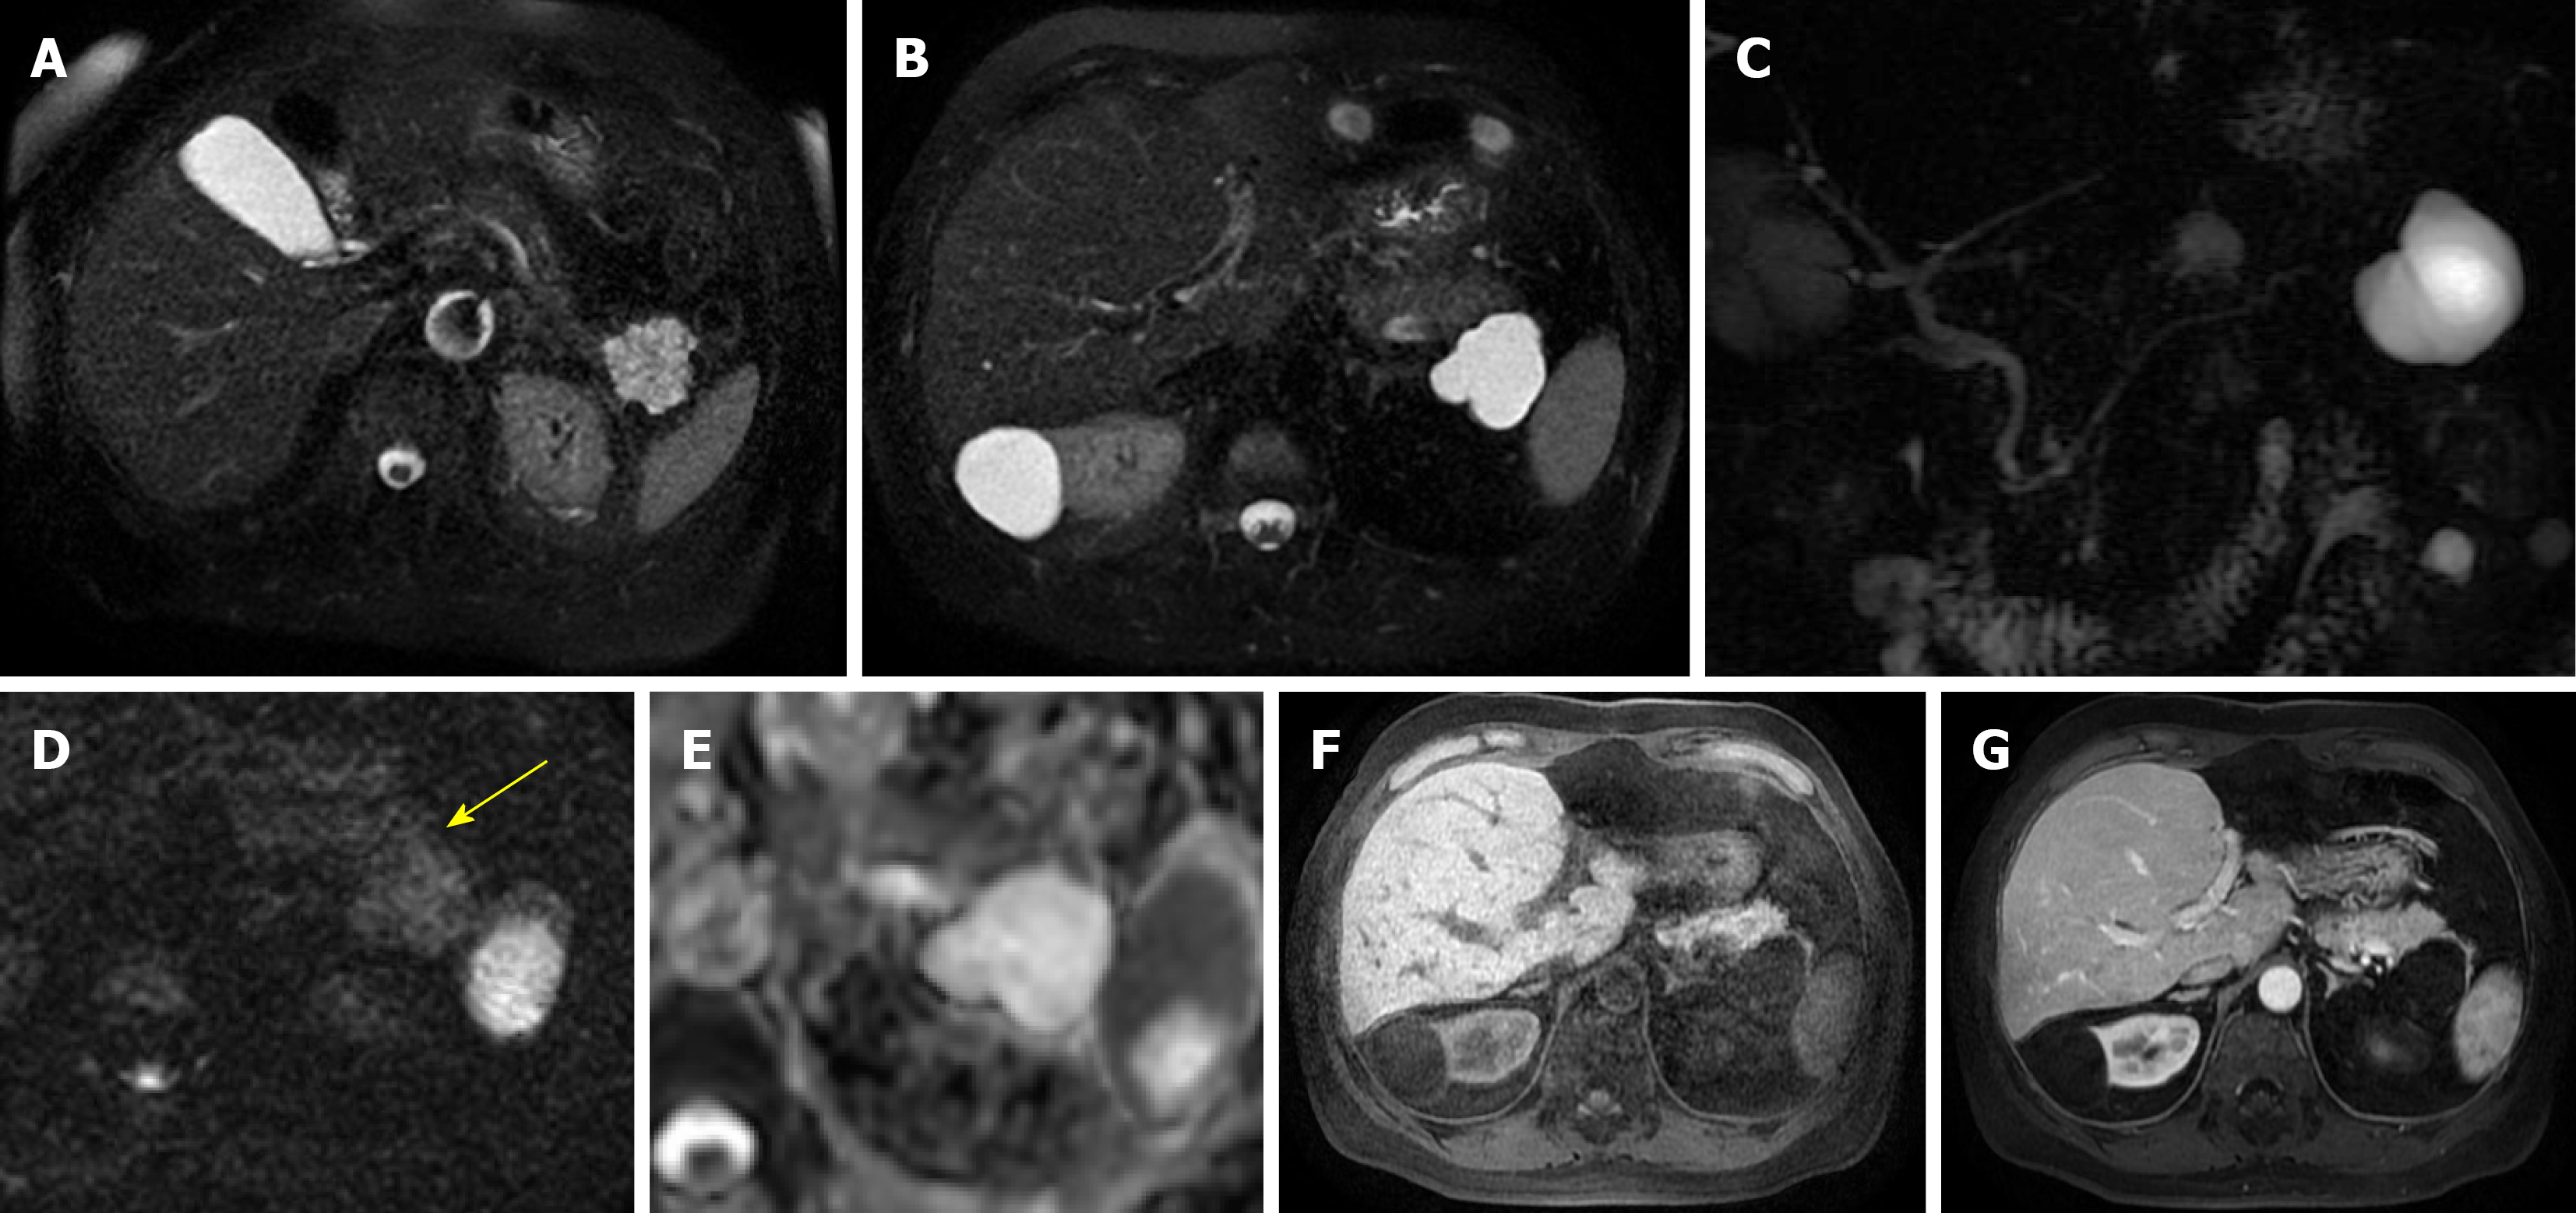
Figure 7 Uniloculated serous cystic neoplasm.
A: Axial single-shot T2-weighted image represents a reference example of the typical magnetic resonance appearance of serous cystic neoplasm; B: Axial single-shot T2-weighted image shows a cystic lesion in the pancreatic tail; C: Magnetic resonance cholangiopancreatography thick-slab demonstrates a predominantly unilocular morphology with subtle internal septations and no definite communication with the main pancreatic duct; D and E: Diffusion weighted imaging (b = 1000 second/mm2) shows mild hyperintensity on high b values due to T2 shine-through (arrow), without true diffusion restriction, as confirmed on apparent diffusion coefficient map, which demonstrates no signal drop, with hyperintense signal indicating absence of true restriction; F and G: Pre-contrast and post-contrast T1-weighted images depict a hypointense lesion with minimal peripheral enhancement. This appearance may mimic a mucinous cystic neoplasm.
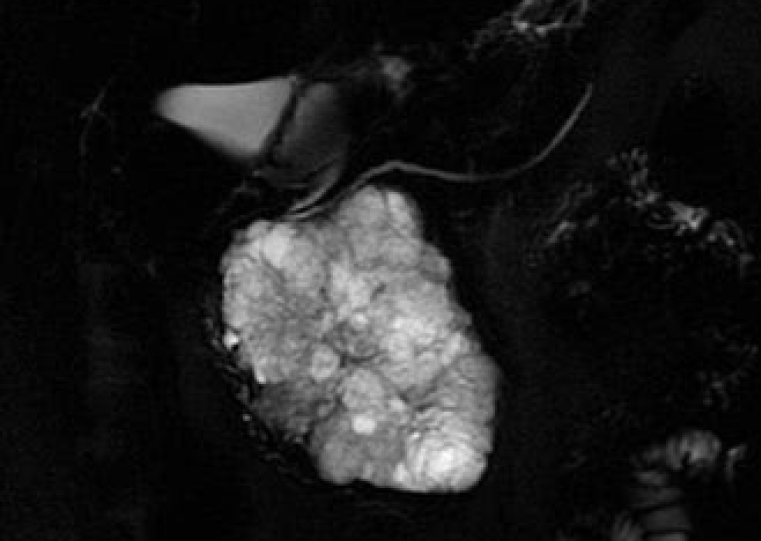
Figure 8 Giant serous cystic neoplasm.
Magnetic resonance cholangiopancreatography thick-slab shows a giant micro-cystic/macro-cystic lesion (15 cm) in the pancreatic head, causing displacement of the duodenum.
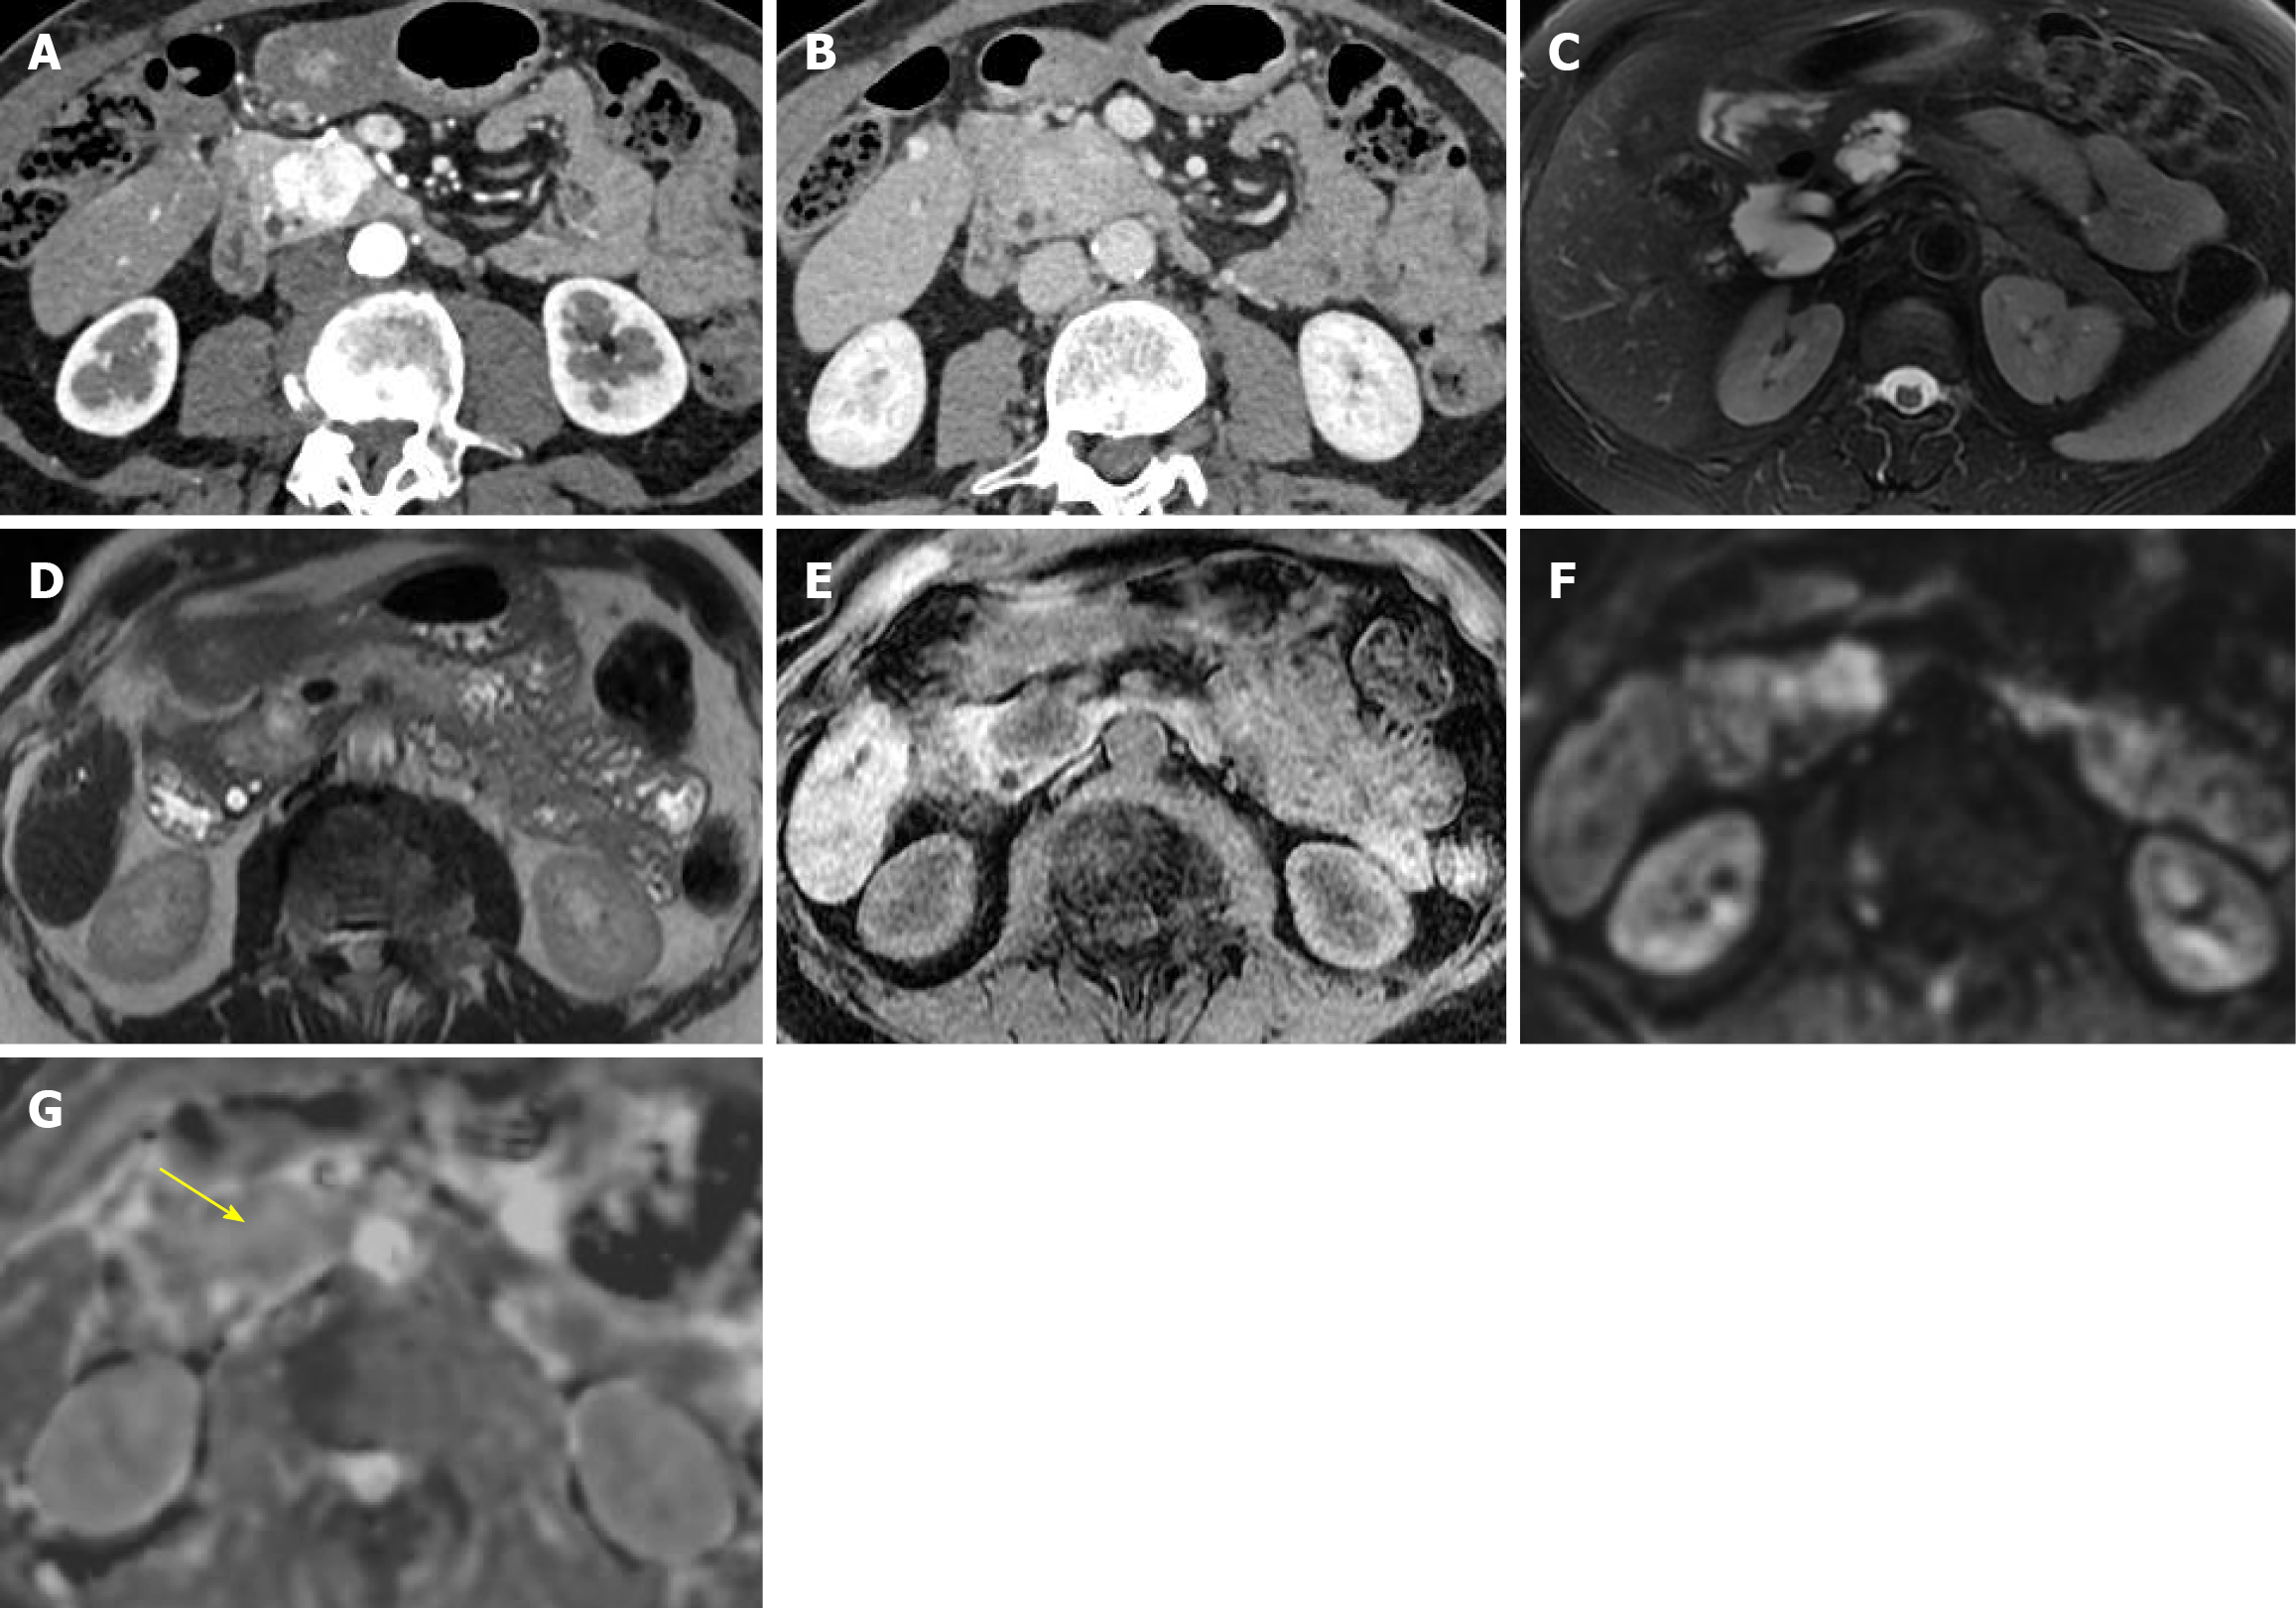
Figure 9 Solid serous cystic neoplasm.
A and B: Contrast-enhanced computed tomography shows a well-defined hypervascular lesion in the pancreatic head with arterial phase hyperenhancement and portal venous phase isointensity, measuring approximately 2 cm; C: Axial single-shot T2-weighted image represents a reference example of the typical magnetic resonance appearance of serous cystic neoplasm; D: Axial single-shot T2-weighted image demonstrates a moderately and heterogeneously hyperintense lesion; E: Axial T1-weighted image shows low signal intensity; F and G: Diffusion weighted imaging (b = 1000 second/mm2) shows high signal intensity due to T2 shine-through, without true diffusion restriction, as confirmed on apparent diffusion coefficient map, which demonstrates no signal drop, with isointense signal indicating absence of true restriction (arrow). This appearance may mimic a pancreatic neuroendocrine tumor.
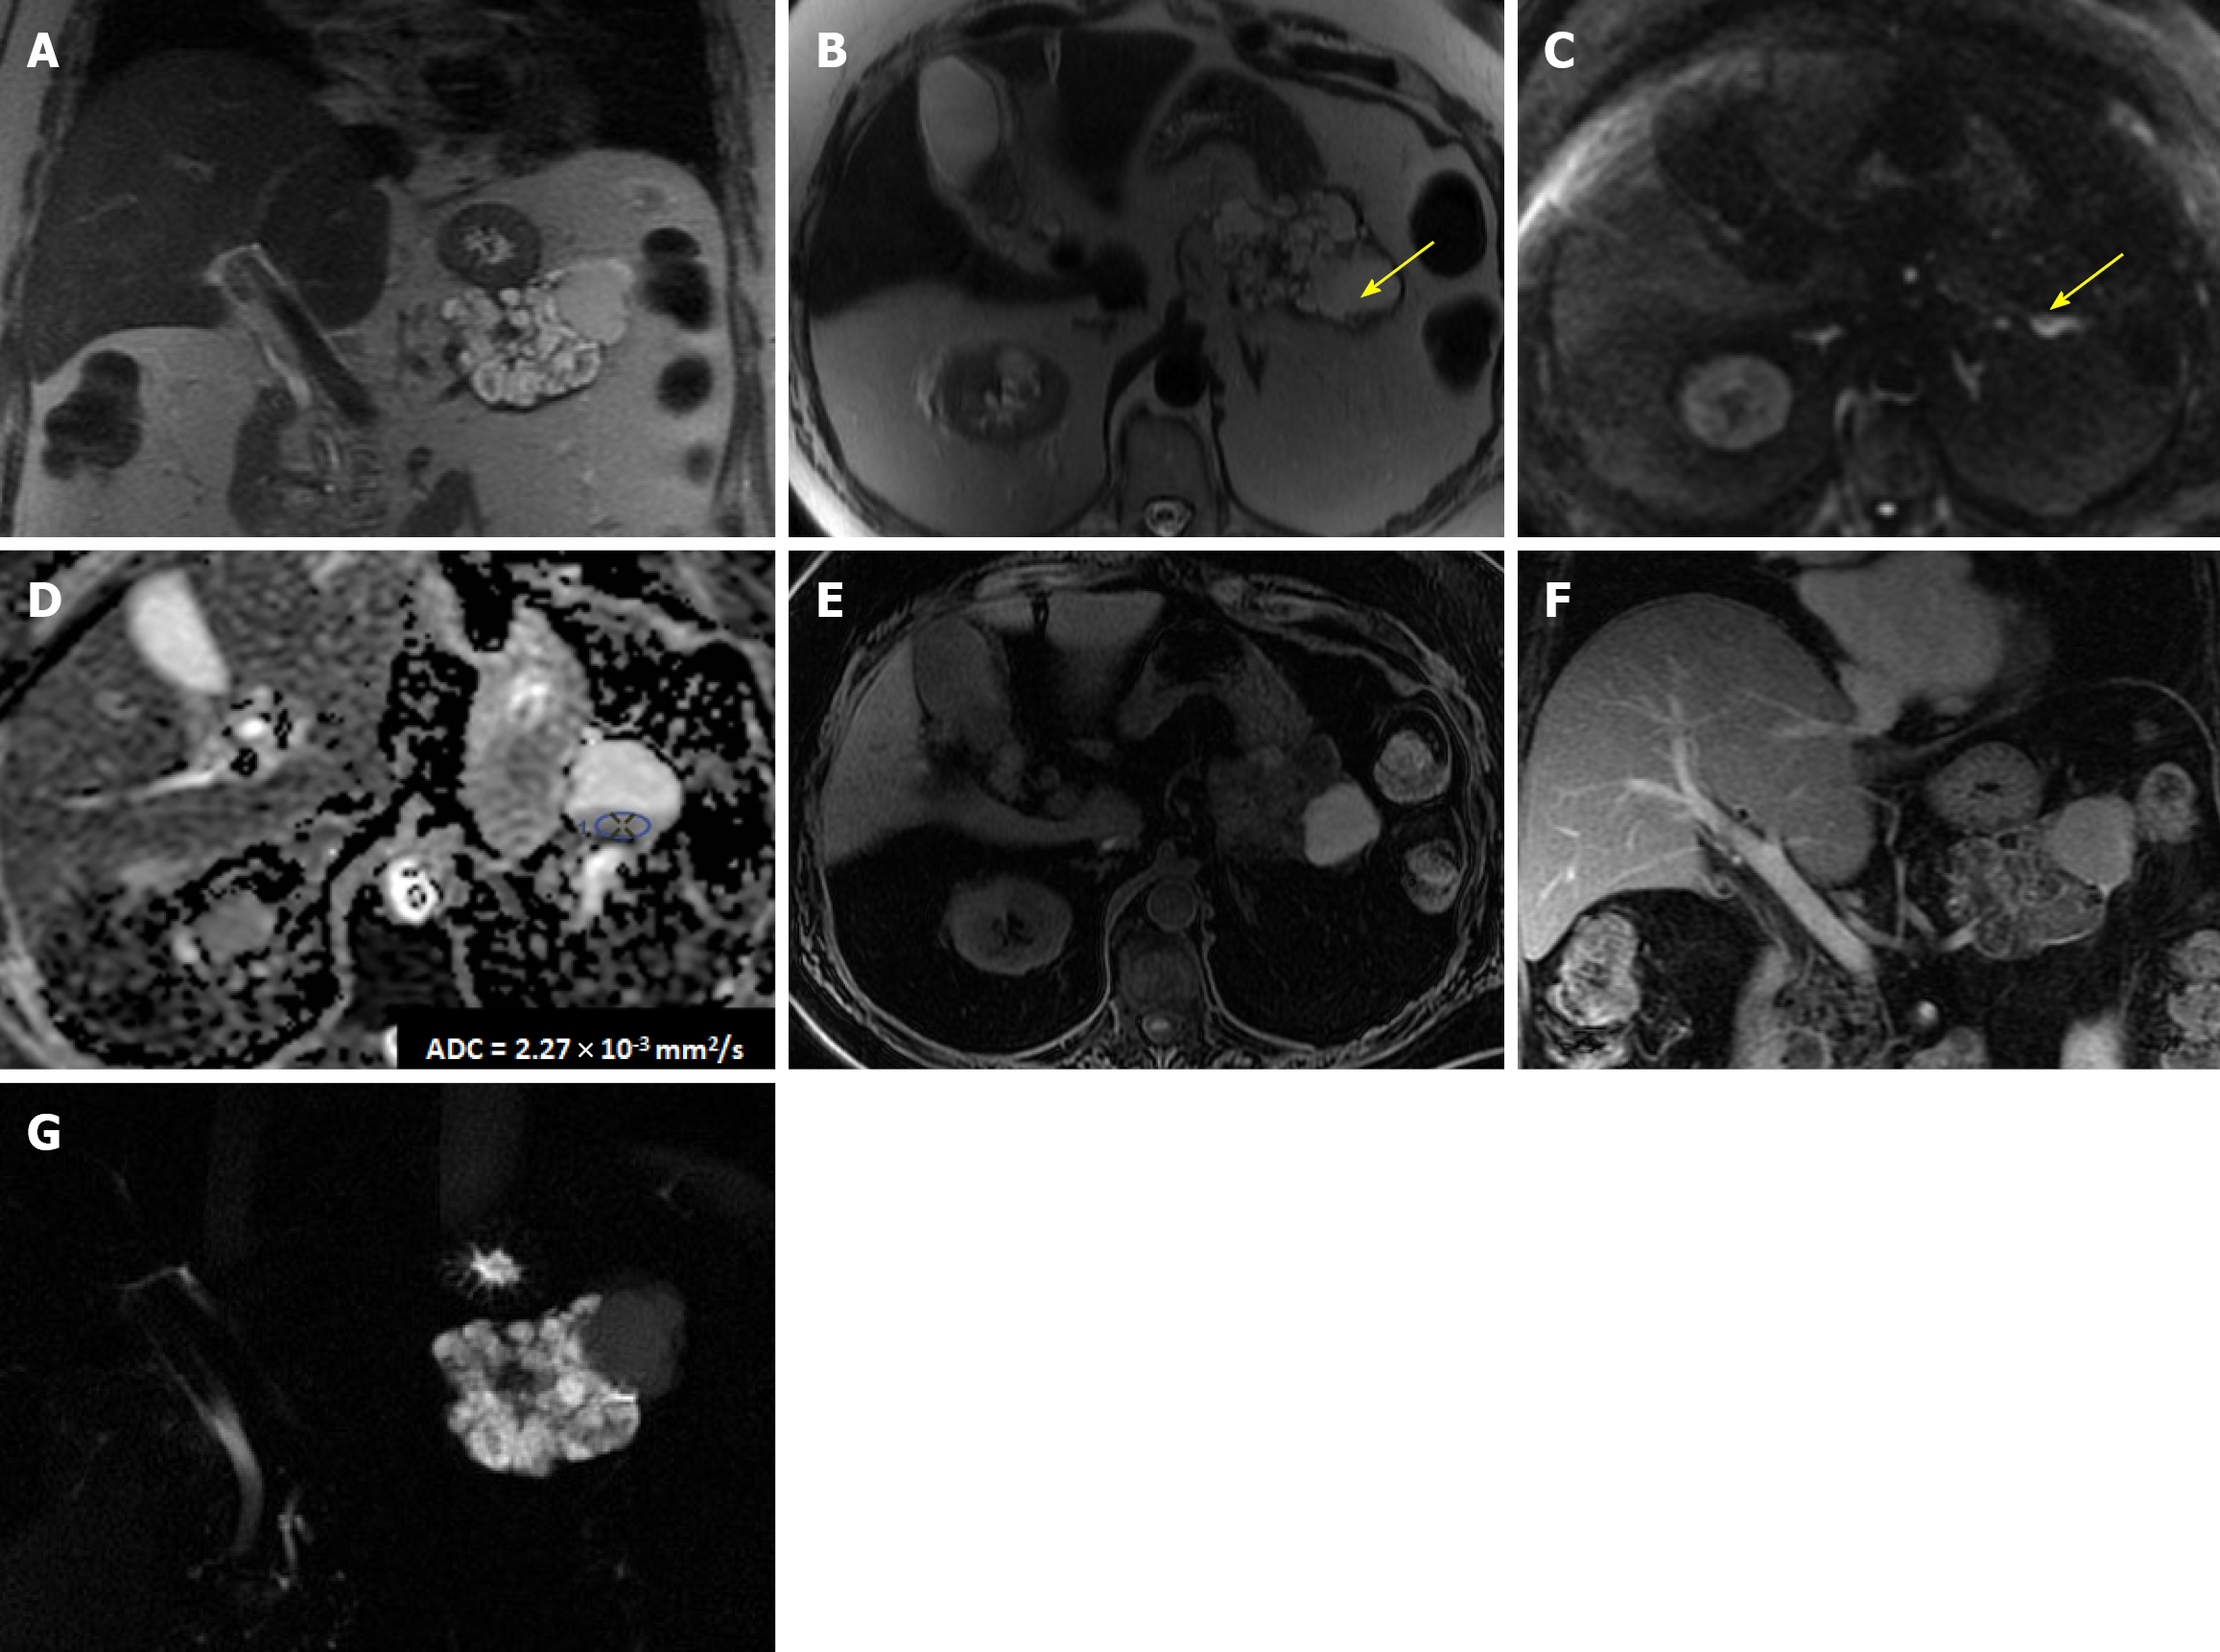
Figure 10 Serous cystic neoplasm with intratumoral hemorrhage.
A: Coronal single-shot T2-weighted image shows a markedly hyperintense microcystic lesion in the pancreatic tail with an associated macrocystic component; B: Axial single-shot T2-weighted image demonstrates a dependent hypointense layer within the macrocyst (arrow), consistent with sedimented hemorrhagic products; C and D: Diffusion weighted imaging (b = 1000 second/mm2) shows no true diffusion restriction, with minimal dependent hyperintensity (arrow) related to hemorrhagic debris. On apparent diffusion coefficient (ADC) maps, the lesion appears predominantly hyperintense with a small dependent hypointense component, at the level of which a high ADC value (ADC = 2.27 × 10⁻³ mm2/second) confirms the absence of true diffusion restriction and supports hemorrhagic content rather than a solid component; E and F: Pre-contrast and post-contrast T1-weighted images show intrinsic T1 hyperintensity of the macrocyst and delayed septal enhancement, without enhancement of the hemorrhagic component; G: Magnetic resonance cholangiopancreatography thick-slab confirms the microcystic architecture and relative hypointensity of the macrocystic component due to intracystic hemorrhage.
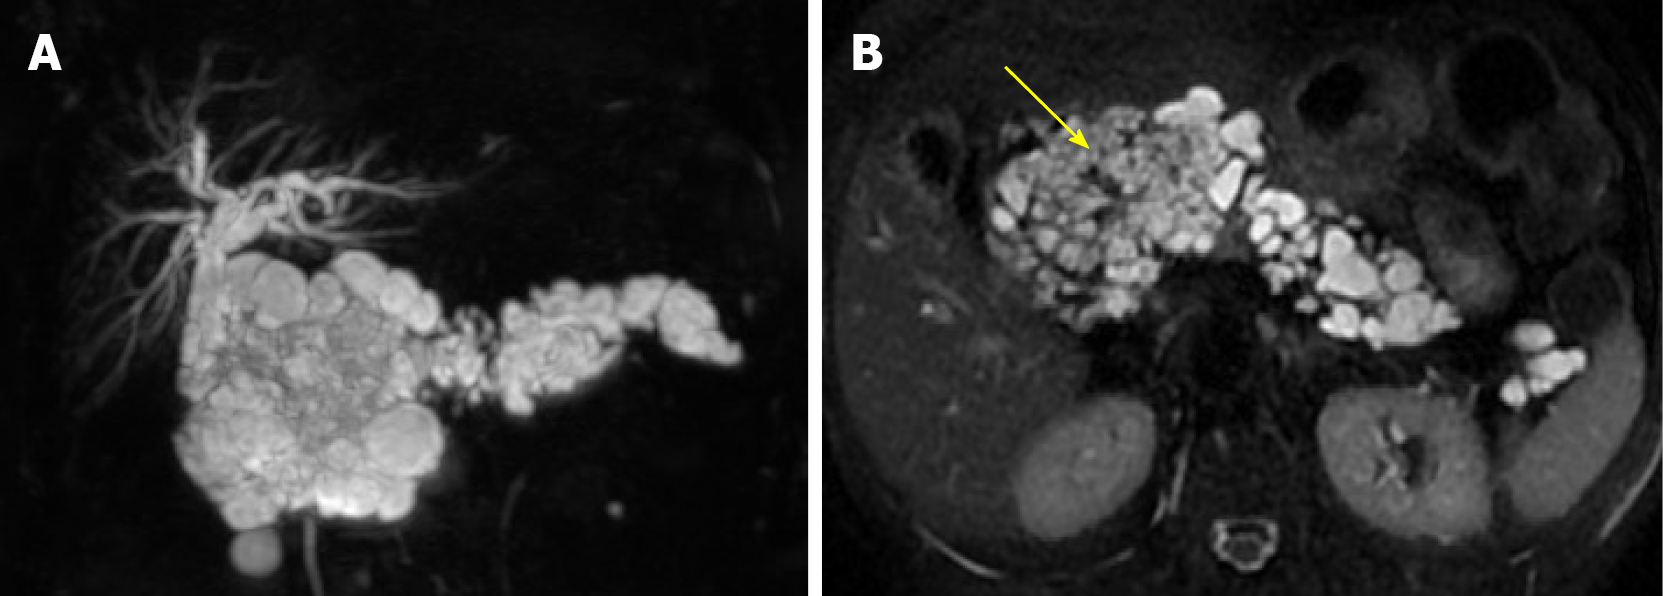
Figure 11 Disseminated form of serous cystic neoplasm.
A: Magnetic resonance cholangiopancreatography maximum intensity projection reconstruction shows marked pancreatic enlargement with complete replacement by innumerable microcysts exhibiting very high T2 signal intensity; B: Axial single-shot T2-weighted image demonstrates a markedly hyperintense microcystic mass with thin septa converging toward a central scar at the level of the pancreatic head (arrow).
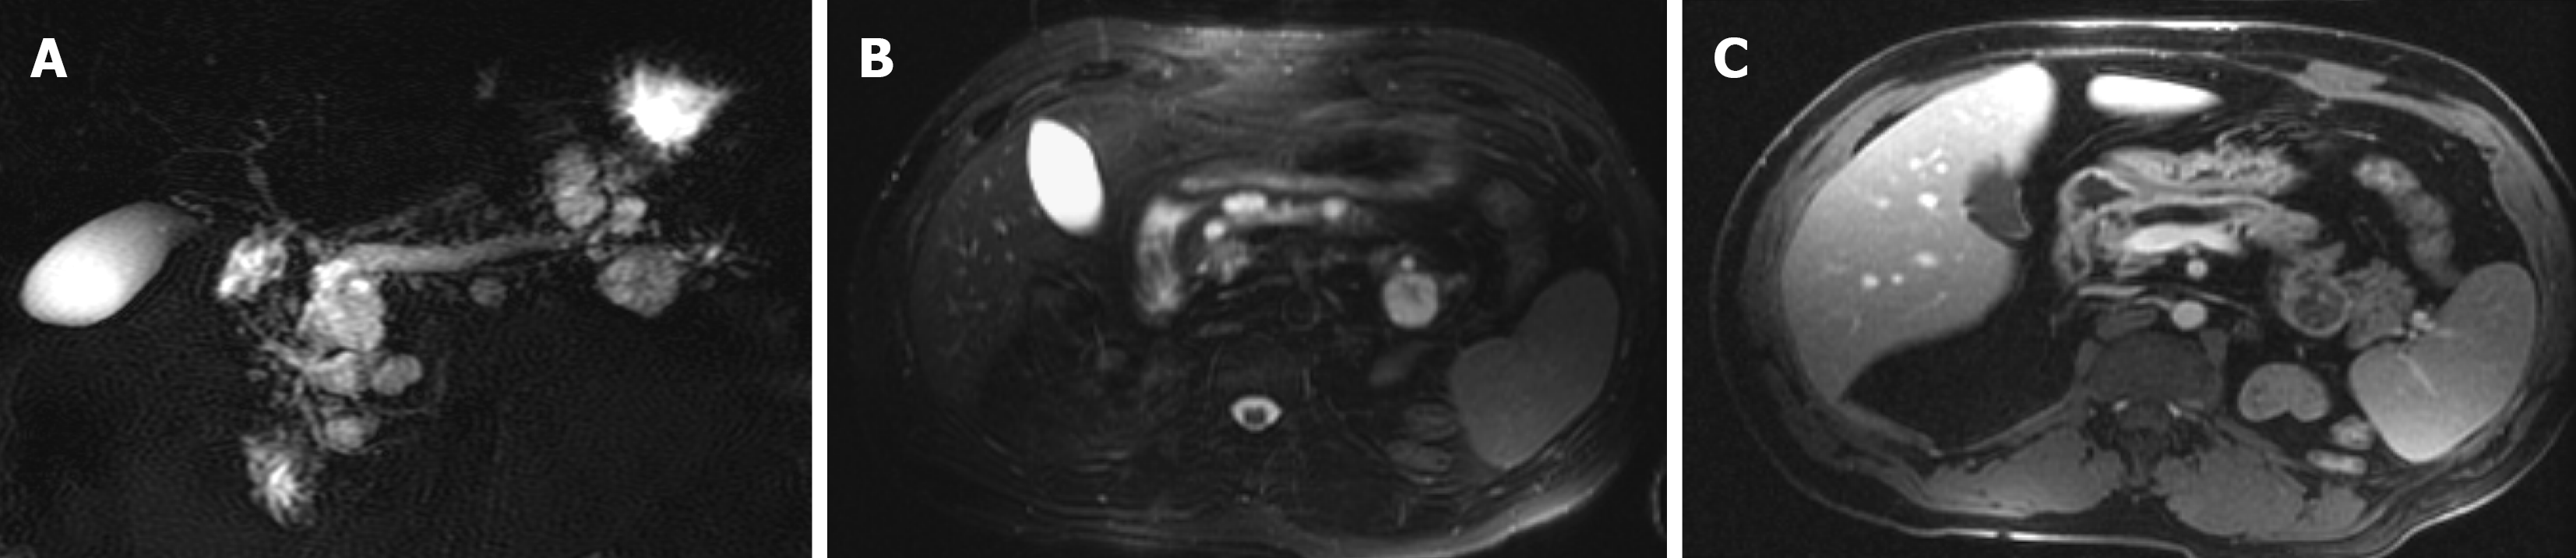
Figure 12 Von Hippel-Lindau disease with multiple serous cystic neoplasms.
A: Thick-slab magnetic resonance cholangiopancreatography shows multiple cystic lesions diffusely involving the pancreas; B: Axial T2-weighted image demonstrates numerous markedly hyperintense cysts of variable size scattered throughout the pancreatic parenchyma; C: Contrast-enhanced T1-weighted image shows multiple cystic lesions with delayed peripheral and septal enhancement without communication with the main pancreatic duct.
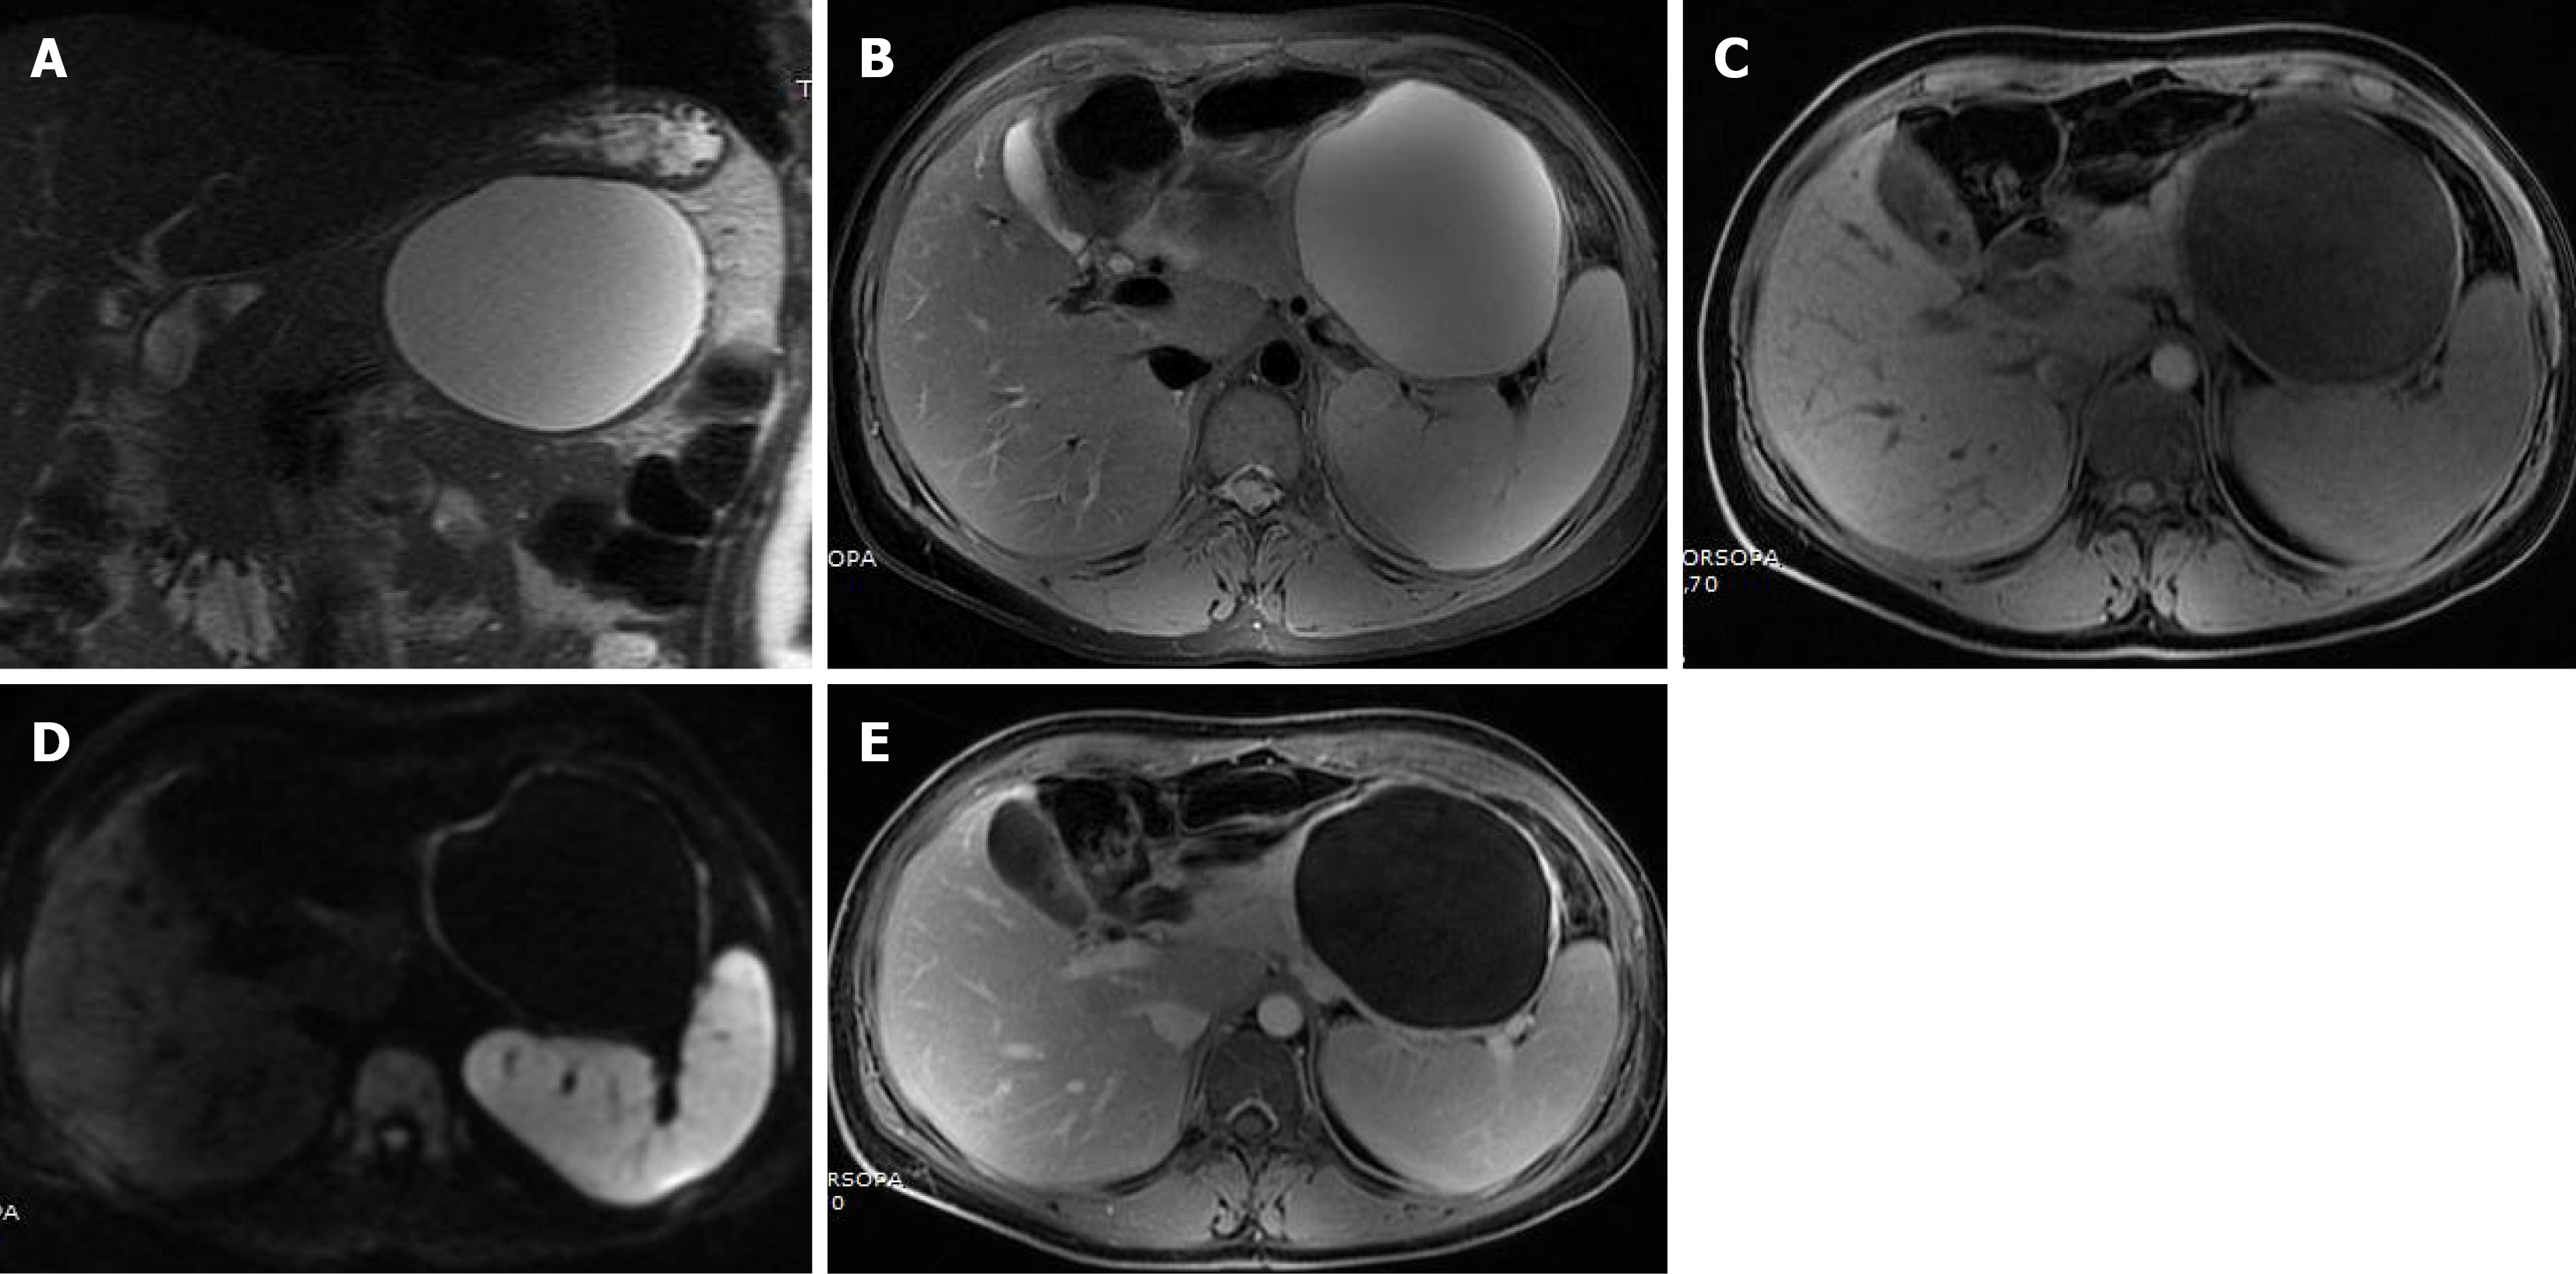
Figure 13 Typical magnetic resonance imaging appearance of mucinous cystic neoplasm.
A and B: Coronal and axial T2-weighted images show a well-defined unilocular cystic lesion in the pancreatic tail, with homogeneous high signal intensity and smooth margins; C: Axial T1-weighted image demonstrates homogeneous low signal intensity of the cystic content, without intrinsic T1 hyperintensity suggestive of hemorrhagic or proteinaceous material; D: Diffusion weighted imaging (b = 1000 second/mm2) shows no diffusion restriction within the lesion; E: Post-contrast T1-weighted image shows no enhancing mural nodules and no internal solid components.
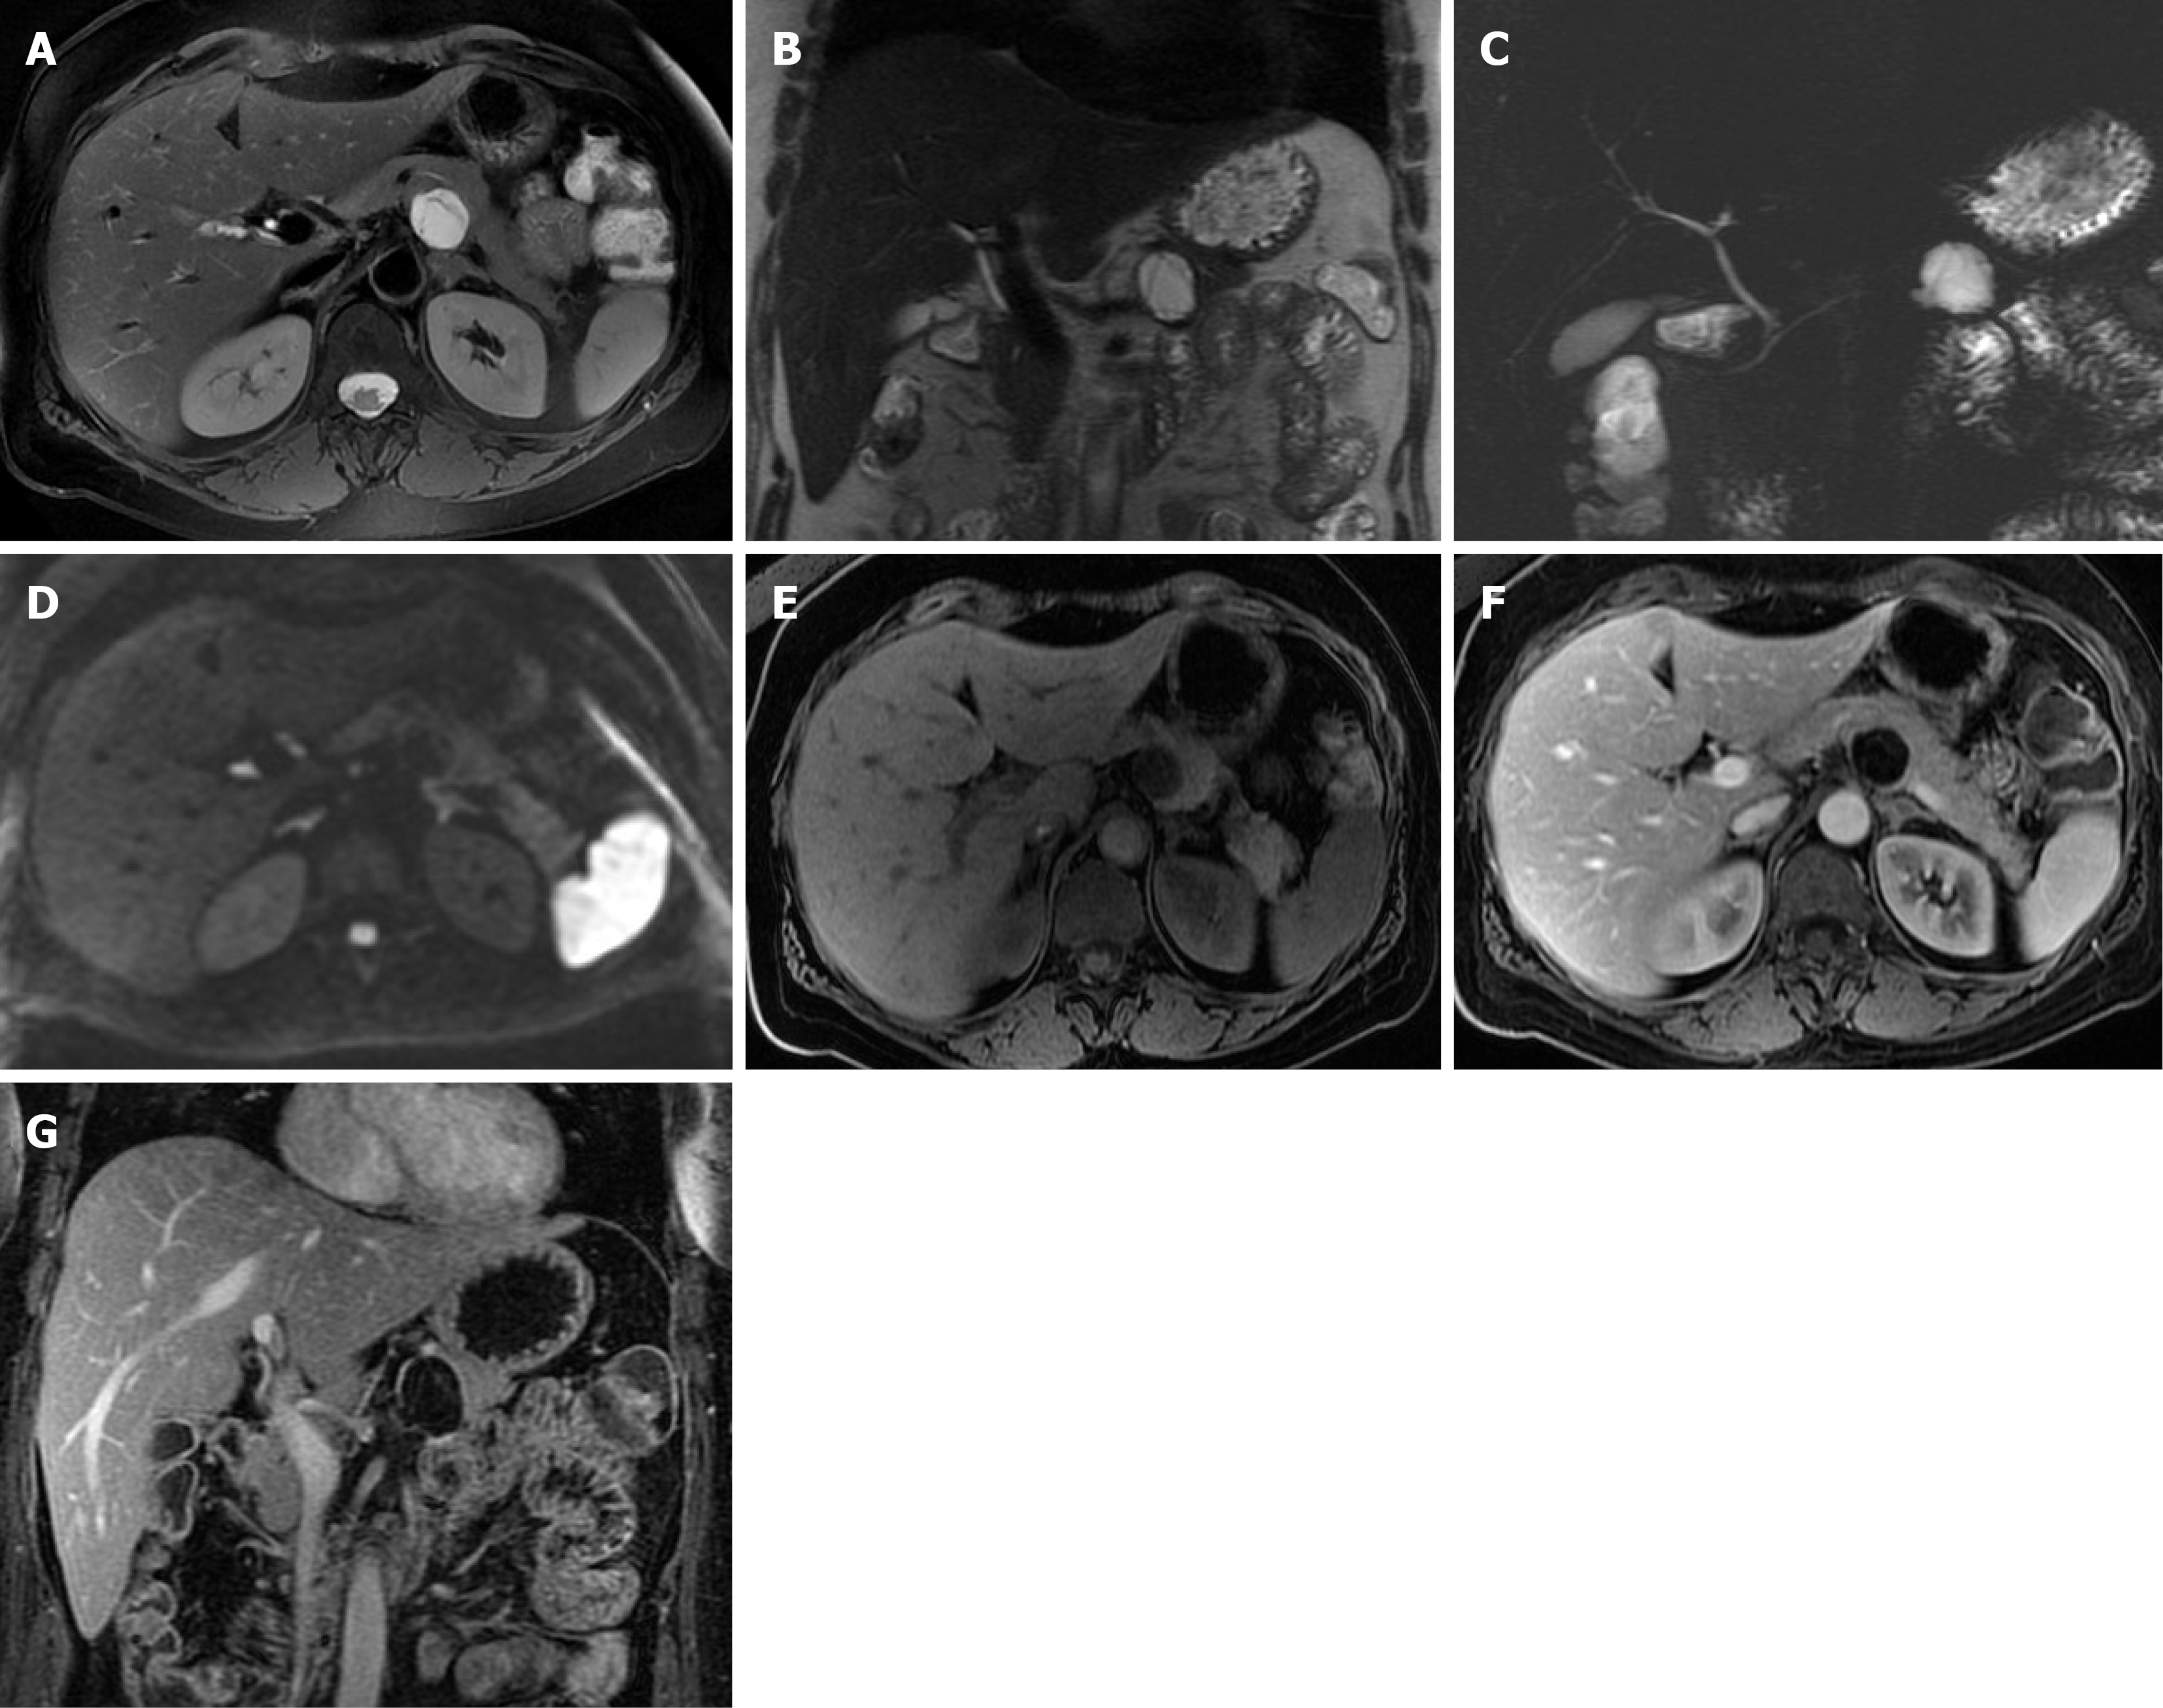
Figure 14 Small mucinous cystic neoplasm.
A and B: Axial and coronal T2-weighted images show a small (< 3 cm), well-circumscribed cystic lesion in the pancreatic body–tail region, with homogeneous high T2 signal intensity and subtle internal septations; C: Thick-slab magnetic resonance cholangiopancreatography demonstrates a unilocular cystic morphology without communication with the main pancreatic duct; D: Diffusion weighted imaging (b = 1000 second/mm2) shows no evidence of diffusion restriction, with mild hyperintensity of the cyst wall; E: Axial T1-weighted image shows low signal intensity, without intrinsic T1 hyperintensity; F and G: Post-contrast T1-weighted images depict minimal enhancement of thin internal septa, without enhancing mural nodules.
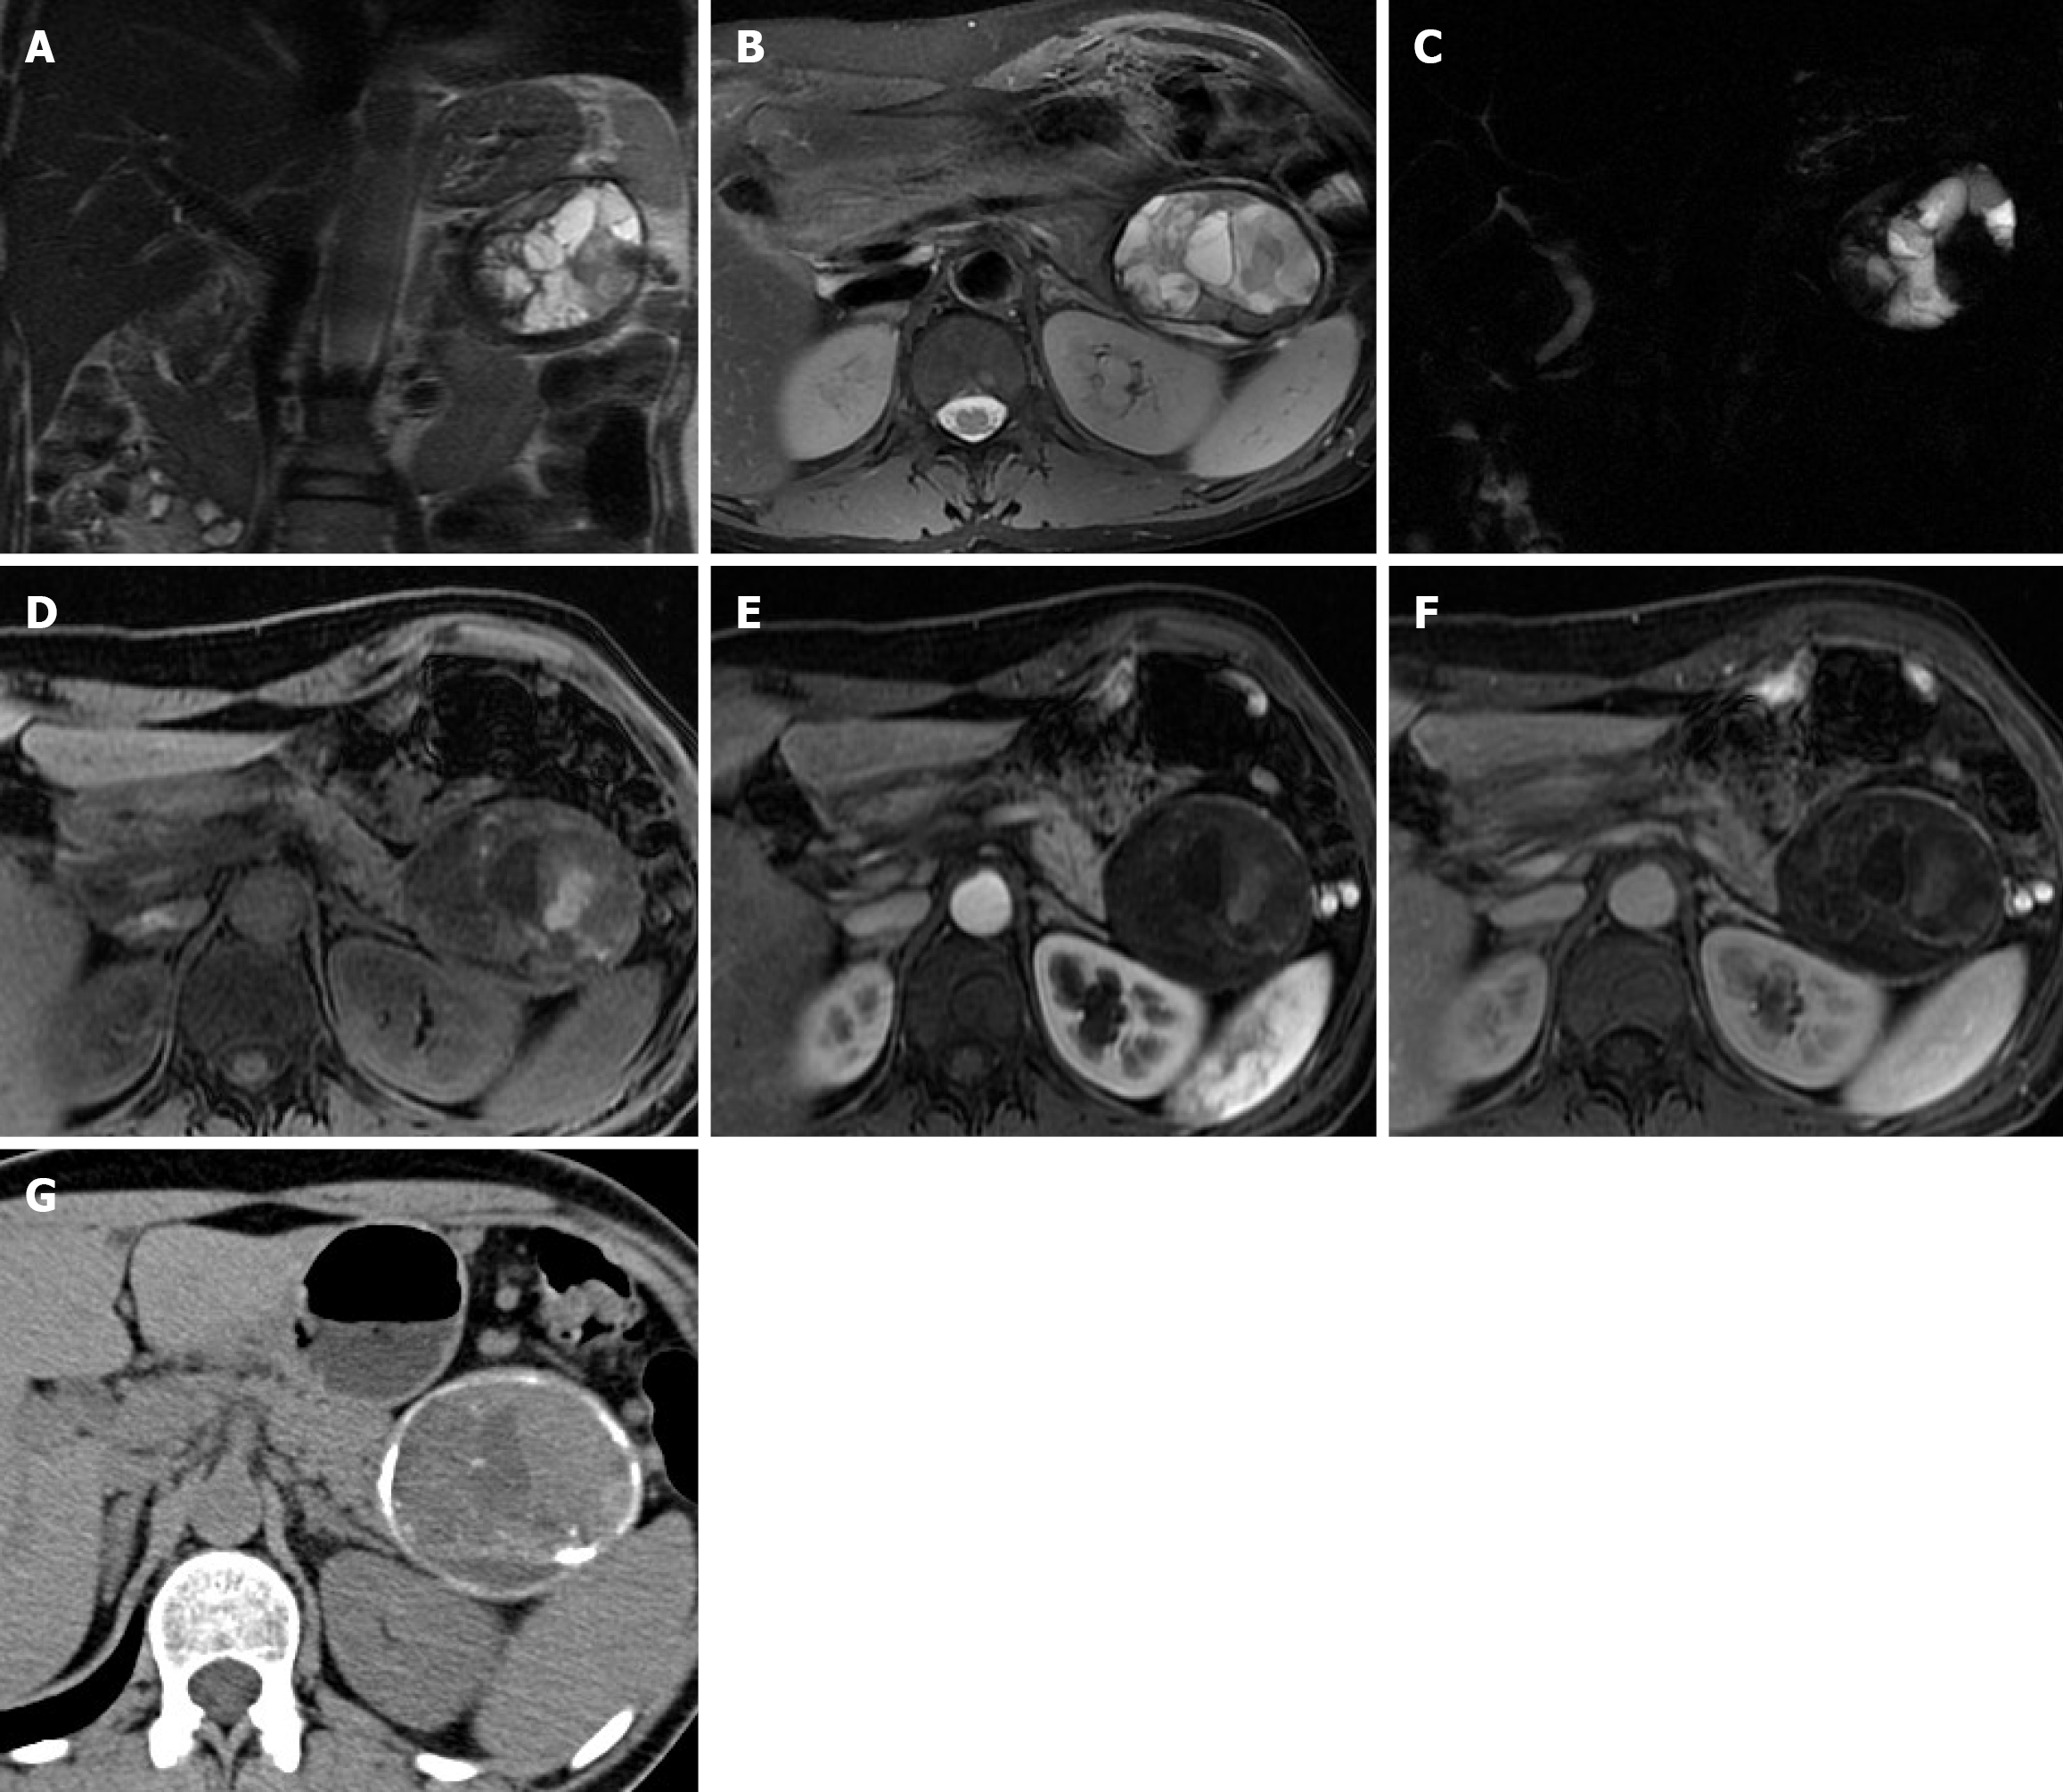
Figure 15 Mucinous cystic neoplasm with “cyst-within-cyst” architecture.
A and B: Coronal and axial single-shot T2-weighted images show a well-defined cystic lesion containing multiple internal cystic components with heterogeneous fluid signal; C: Thick-slab magnetic resonance cholangiopancreatography demonstrates a normal-caliber main pancreatic duct without communication with the cystic lesion; D: Axial T1-weighted image confirms intracystic heterogeneity, with focal hyperintense areas suggestive of hemorrhagic or proteinaceous content; E and F: Post-contrast axial T1-weighted images show minimal enhancement of the thin intracystic septa; G: Non-contrast computed tomography demonstrates peripheral (mural) and intraseptal calcifications. The “cyst-within-cyst” appearance may enter the differential diagnosis with hydatid cyst.
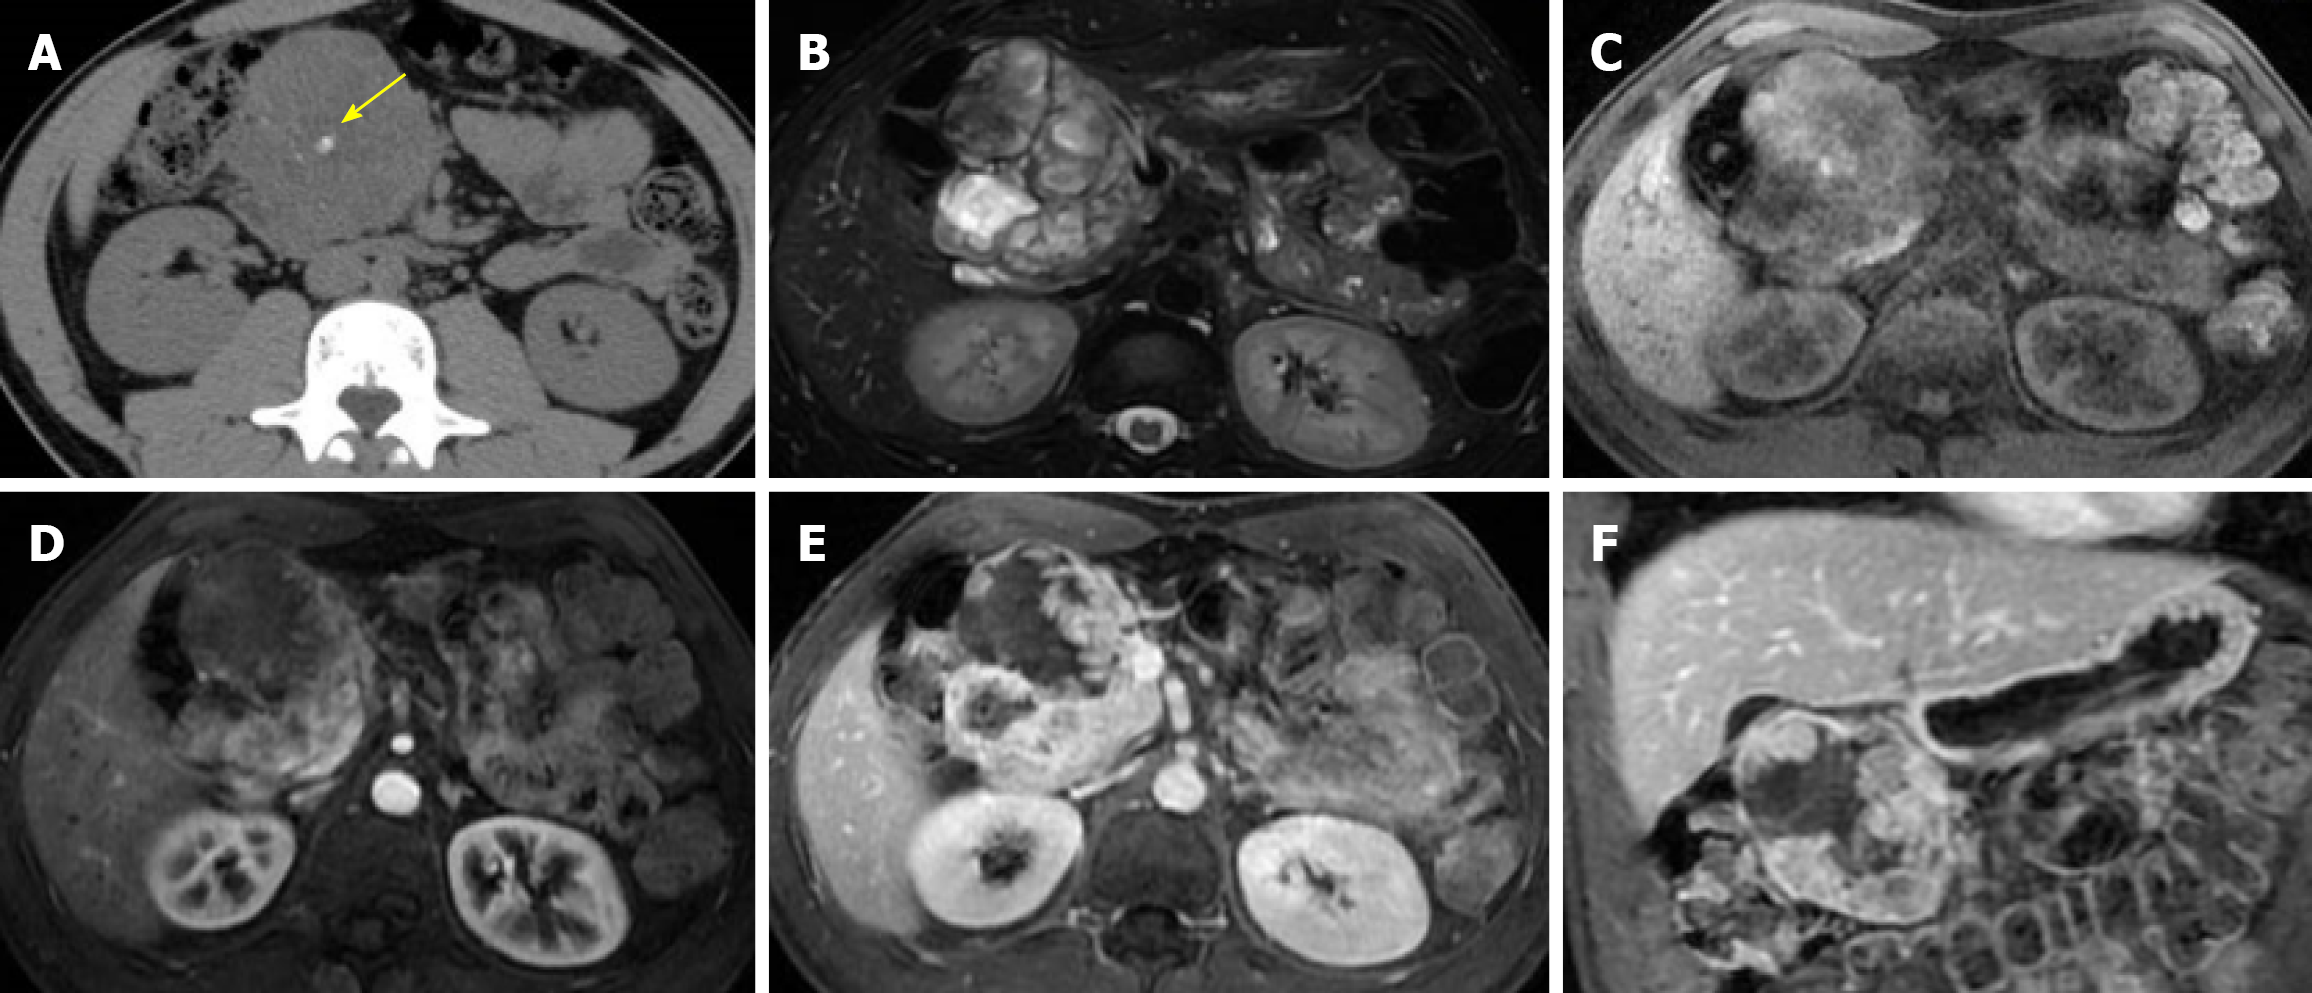
Figure 16 Typical magnetic resonance imaging appearance of solid pseudopapillary neoplasm.
A: Non-contrast computed tomography shows a heterogeneous lesion with small internal calcifications (arrow) of the pancreatic head; B: Axial single-shot T2-weighted image demonstrates a predominantly hyperintense mass with internal heterogeneity related to cystic and solid areas; C: Axial T1-weighted image shows intrinsic areas of high signal intensity consistent with hemorrhagic components; D and E: Axial post contrast-enhanced T1-weighted images in arterial and portal-venous phases, demonstrate progressive heterogeneous enhancement of the solid portions; F: Coronal post contrast-enhanced T1-weighted image confirms the encapsulated appearance and mixed solid-cystic architecture.
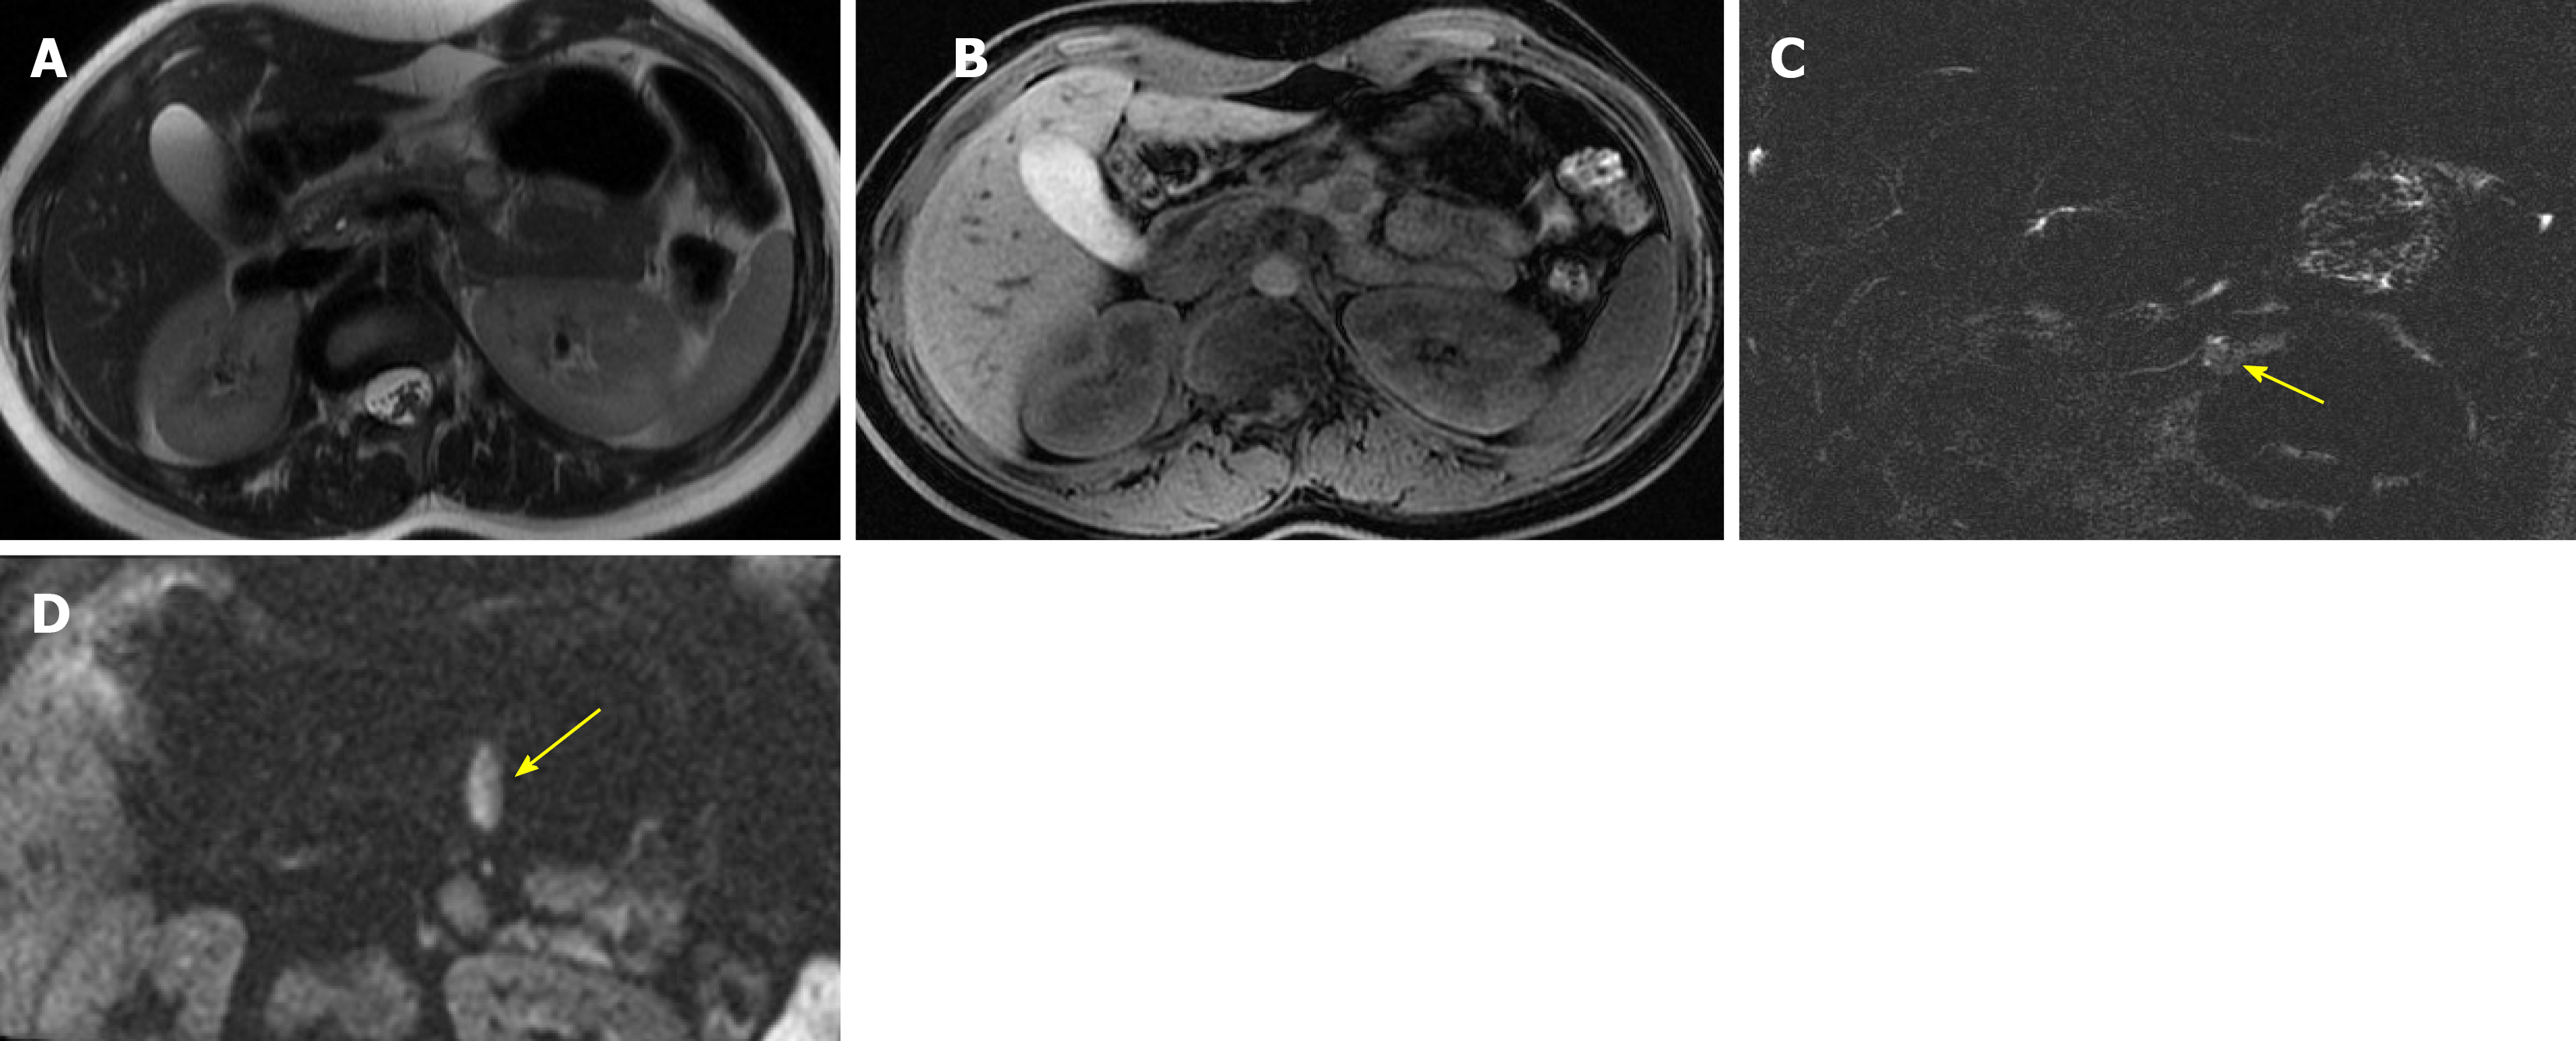
Figure 17 Atypical small solid variant of solid pseudopapillary neoplasm.
A: Axial T2-weighted image shows a small, well-defined solid lesion with mildly hyperintense signal in the pancreatic body; B: Axial T1-weighted image demonstrates low signal intensity; C: Thin-slab magnetic resonance cholangiopancreatography shows only poor hyperintensity (arrow), reflecting the predominantly solid nature of the lesion; D: Diffusion weighted imaging (b = 1000 second/mm2) demonstrates high hyperintensity on high b values (arrow). In a 34-year-old woman, this homogeneous solid appearance represents an atypical presentation of solid pseudopapillary neoplasm and may mimic a pancreatic neuroendocrine tumor.
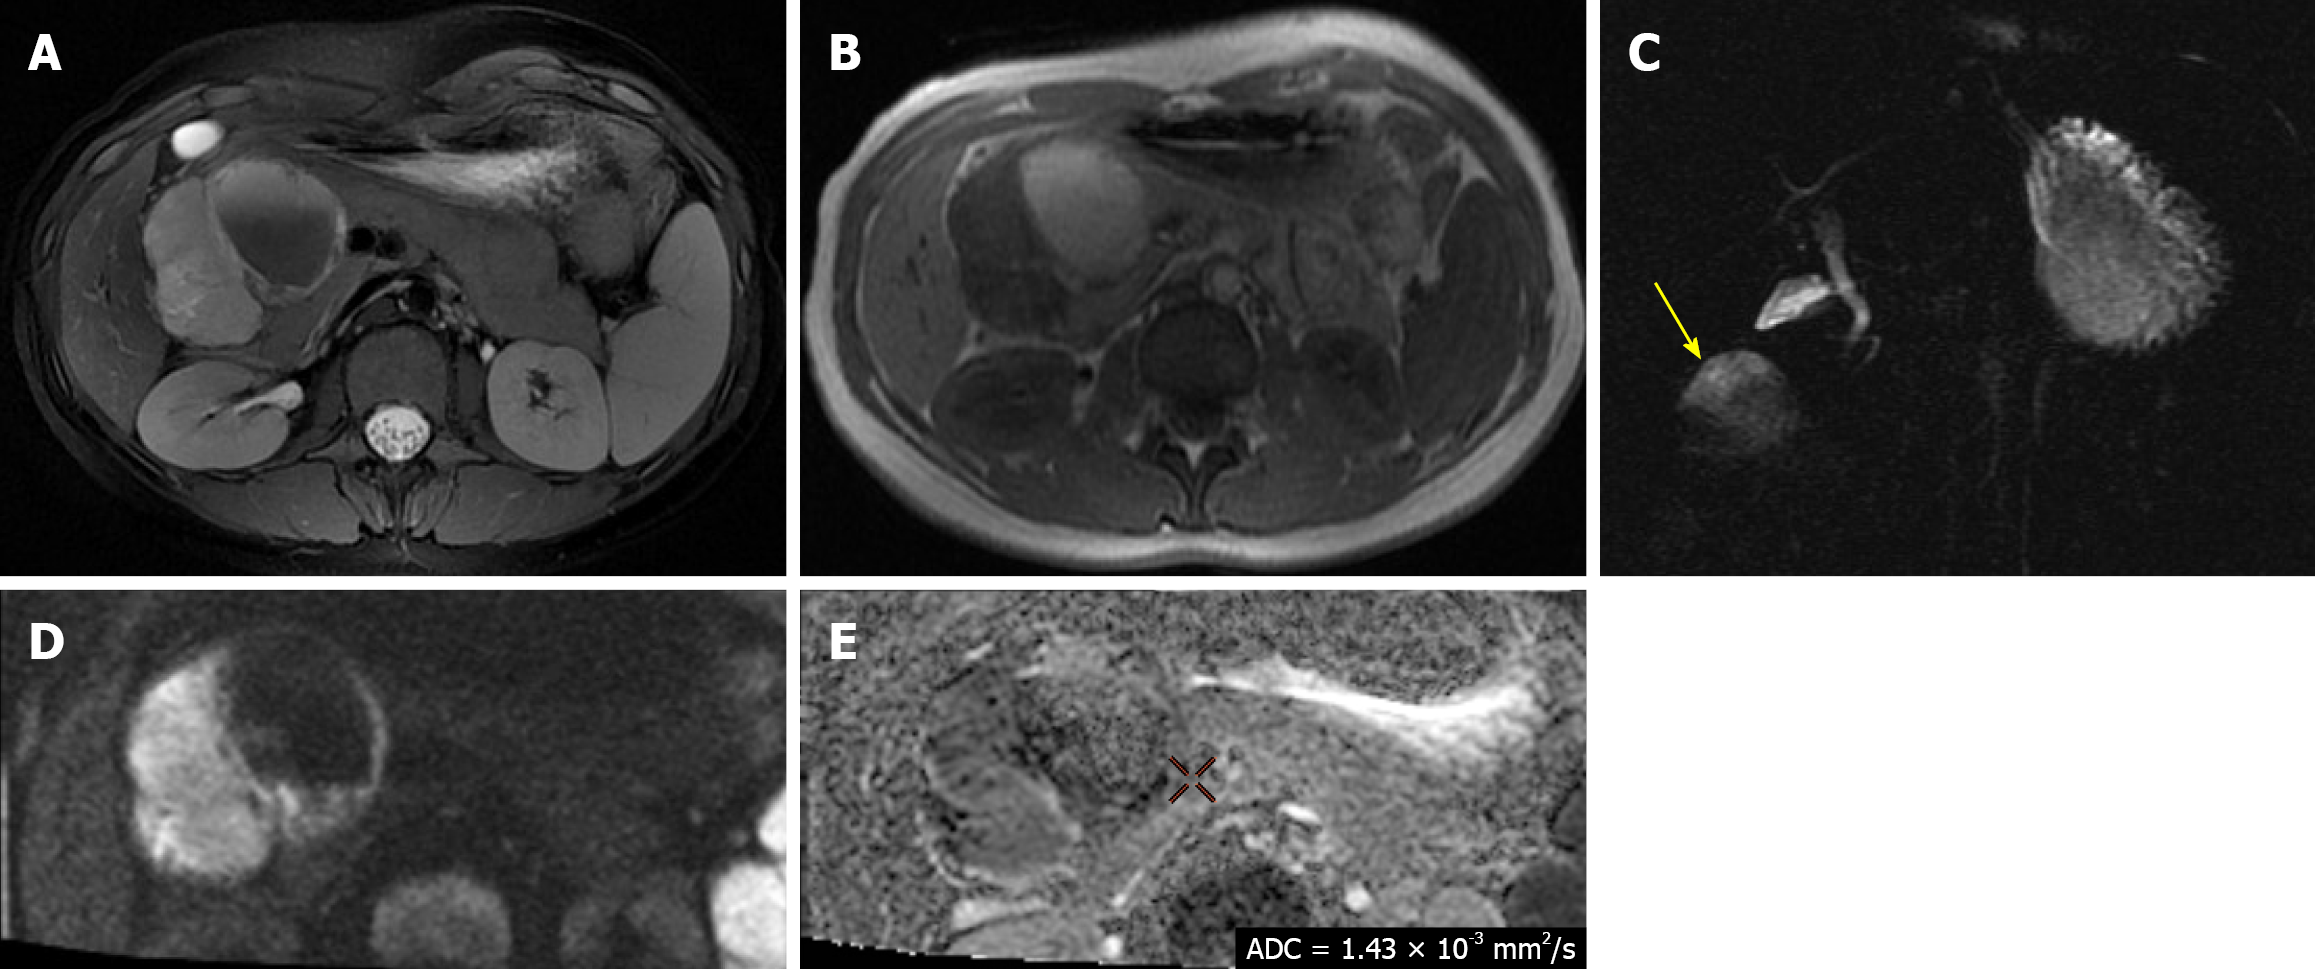
Figure 18 Atypical solid pseudopapillary tumor with extensive hemorrhagic cystic component.
A: Axial T2-weighted image shows a well-defined heterogeneous mass in the pancreatic head, characterized by a large hyperintense cystic component with internal fluid–fluid level, consistent with hemorrhagic sedimentation; B: Axial T1-weighted magnetic resonance image demonstrates intrinsic high signal intensity of the cystic component, consistent with intralesional hemorrhage; C: Thin-slab magnetic resonance cholangiopancreatography confirms the presence of cystic components (arrow) within the lesion, without evidence of communication with the main pancreatic duct; D and E: Diffusion weighted imaging (b = 1000 second/mm2) shows high signal intensity of the solid components, with true diffusion restriction, confirmed by apparent diffusion coefficient (ADC) map which demonstrates moderate signal drop, and low ADC value (ADC = 1.42 × 10⁻³ mm2/second).
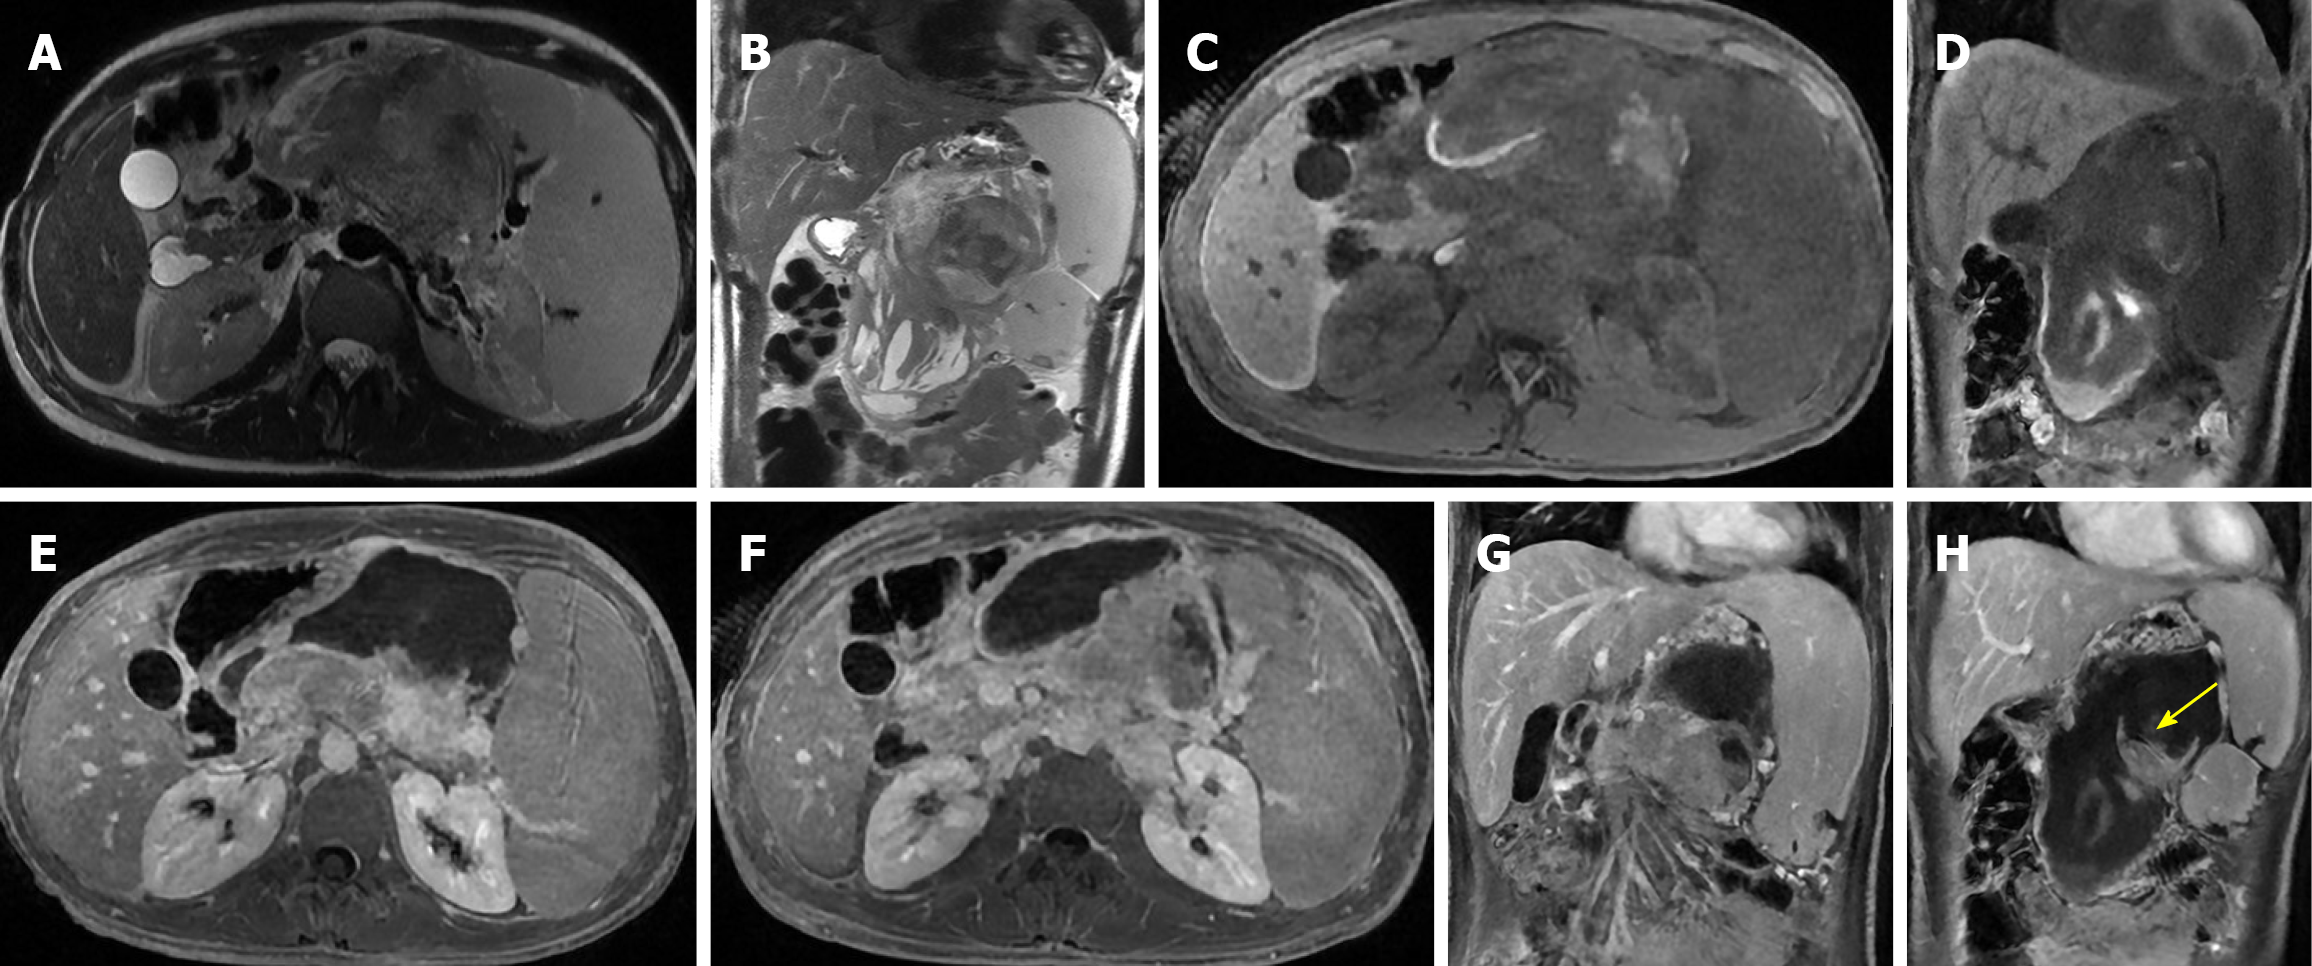
Figure 19 Large solid pseudopapillary neoplasm with spontaneous rupture and hemoperitoneum.
A and B: Axial and coronal T2-weighted images show a large heterogeneous pancreatic mass with mixed solid and cystic components and extensive intralesional hemorrhage; C and D: Axial and coronal T1-weighted images demonstrate intrinsic high signal intensity consistent with blood products; E and F: Axial post-contrast T1-weighted images show heterogeneous enhancement of the viable solid portions with non-enhancing hemorrhagic areas; G and H: Coronal post-contrast T1-weighted images confirm capsular disruption (arrow) with adjacent fluid collections consistent with hemoperitoneum. In a 16-year-old boy, these findings are consistent with spontaneous rupture of solid pseudopapillary neoplasm complicated by intra-tumoral hemorrhage and hemoperitoneum.
- Citation: Boraschi P, Cervelli R, Donati F. Common cystic pancreatic neoplasms: A comprehensive magnetic resonance imaging-based review of typical and atypical imaging features. World J Radiol 2026; 18(7): 120526
- URL: https://www.wjgnet.com/1949-8470/full/v18/i7/120526.htm
- DOI: https://dx.doi.org/10.4329/wjr.120526