
















Copyright: ©Author(s) 2026.
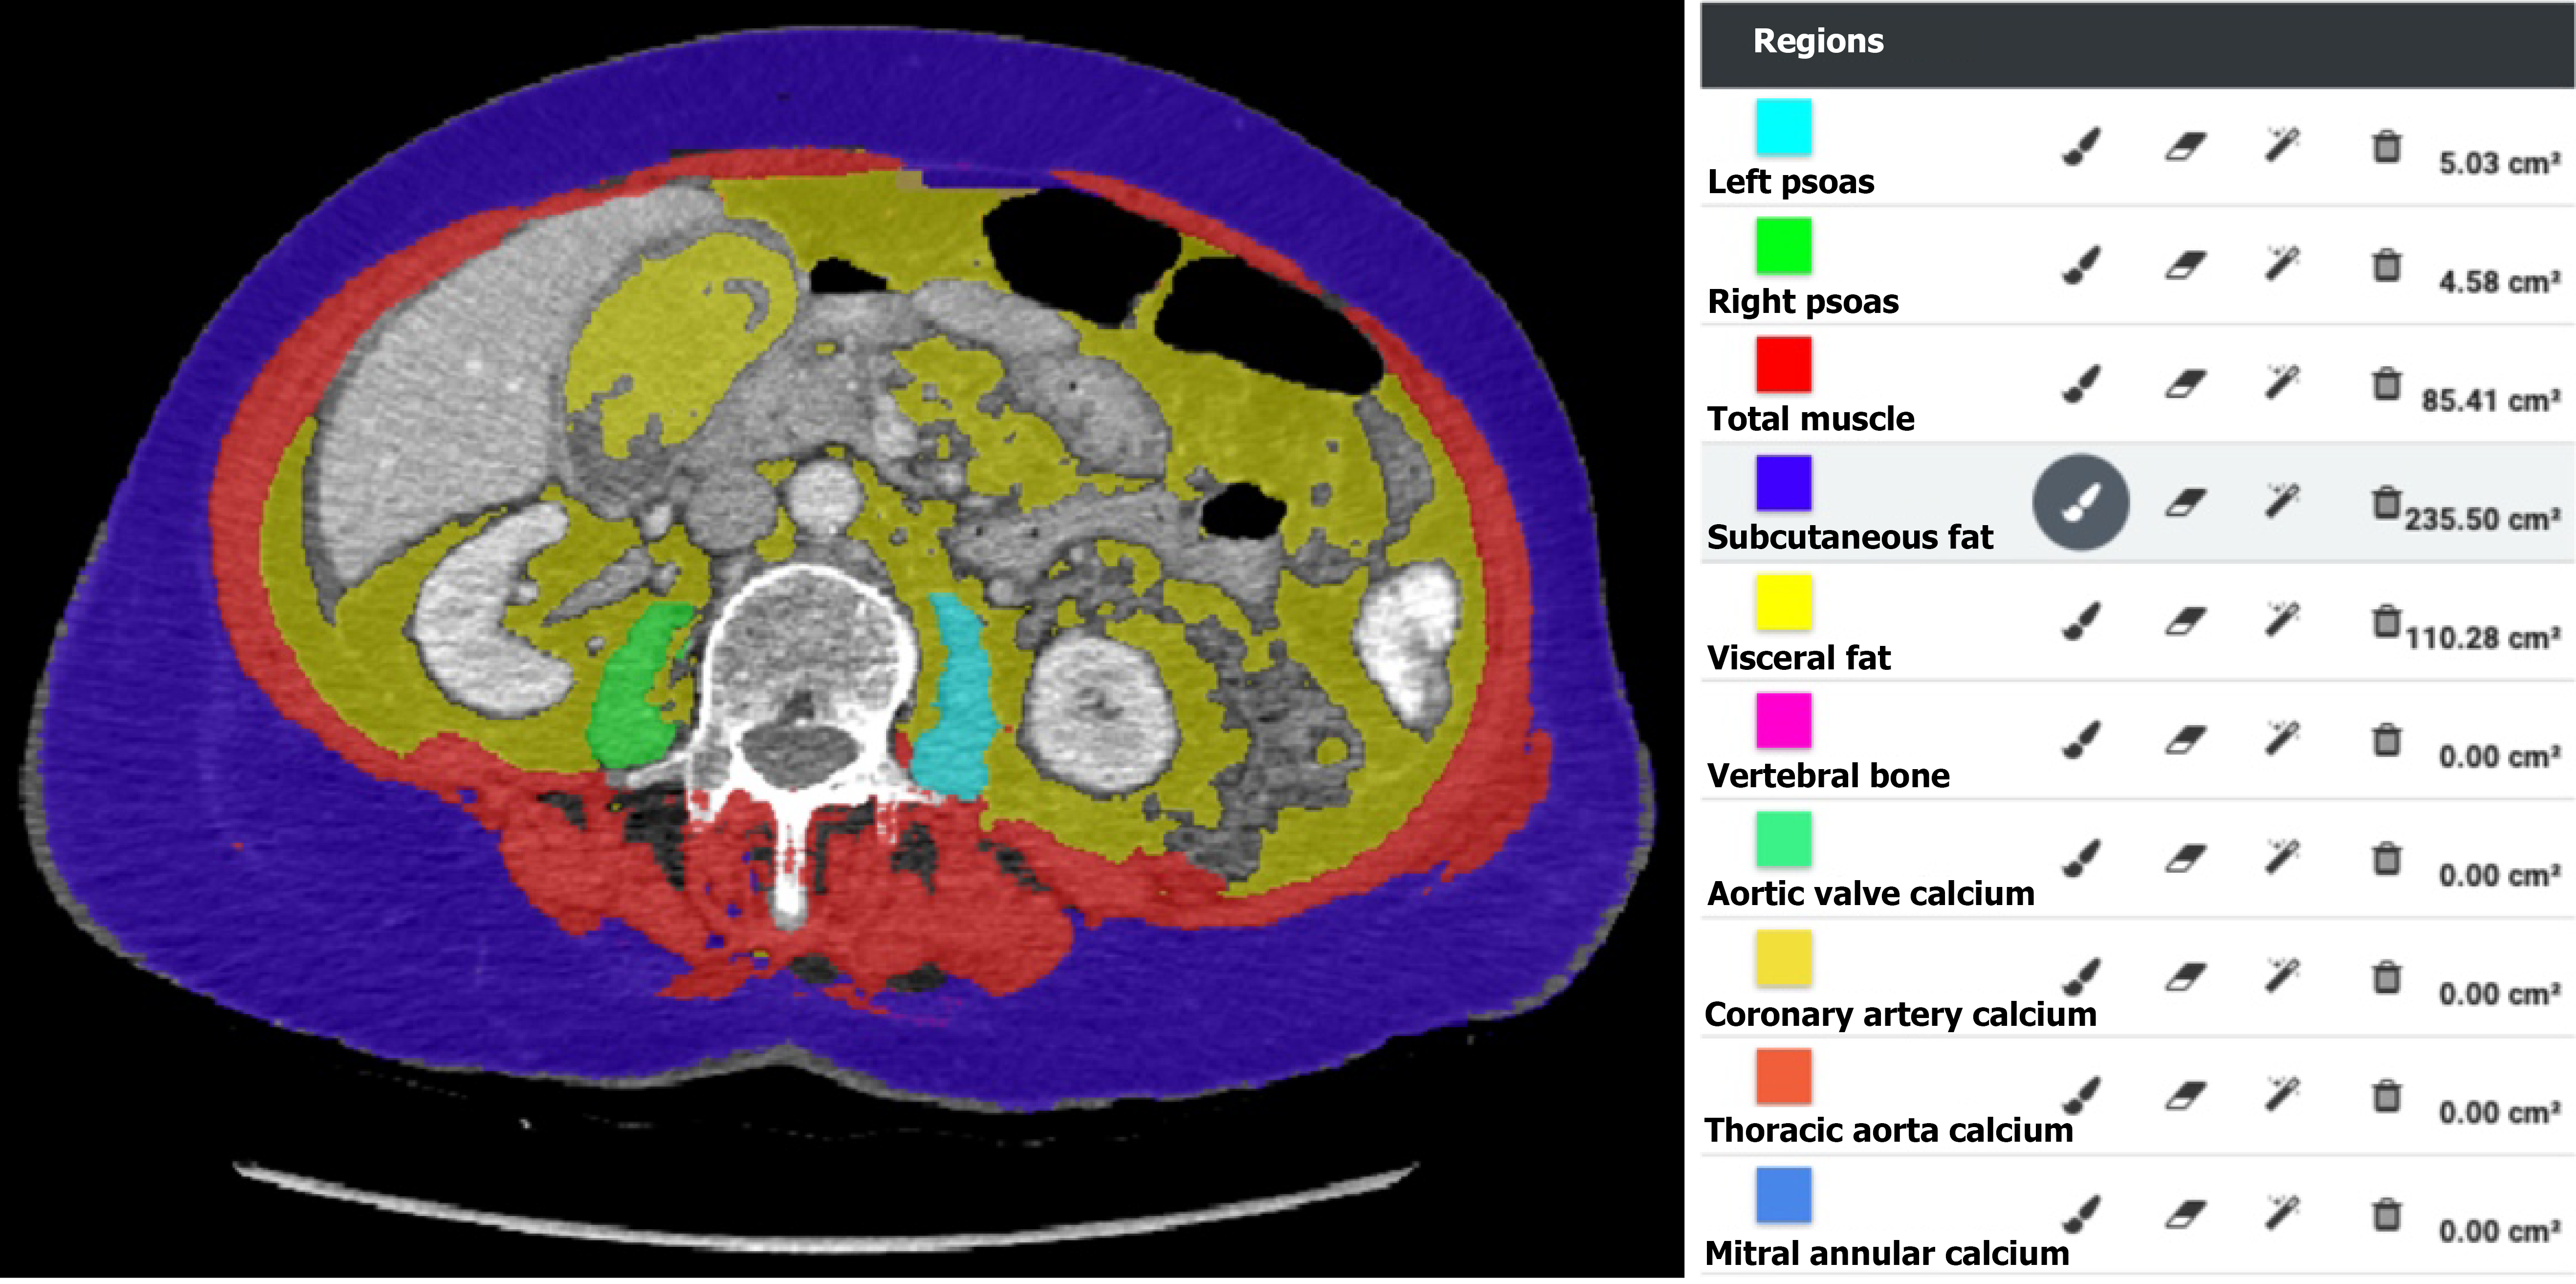
Figure 1 Morphomic analysis using CoreSlicer.
Semi-automated morphomic analysis conducted at the L3 level using CoreSlicer. Blue: Subcutaneous fat; Green: Right psoas muscle; Teal: Left psoas muscle; Yellow: Visceral fat; Red: Paraspinal and abdominal wall muscles.
- Citation: Shet S, O’Shea OC, De Kock LGA, Kakish E, Lee RJ, Ni Chleirigh N, O’Broin E, Ryan DJ, Maher MM. Computed tomography derived morphomics in the prediction of long-term outcomes in acute pancreatitis. World J Radiol 2026; 18(7): 118613
- URL: https://www.wjgnet.com/1949-8470/full/v18/i7/118613.htm
- DOI: https://dx.doi.org/10.4329/wjr.118613