
















Copyright: ©Author(s) 2026.
World J Radiol. May 28, 2026; 18(5): 119367
Published online May 28, 2026. doi: 10.4329/wjr.v18.i5.119367
Published online May 28, 2026. doi: 10.4329/wjr.v18.i5.119367
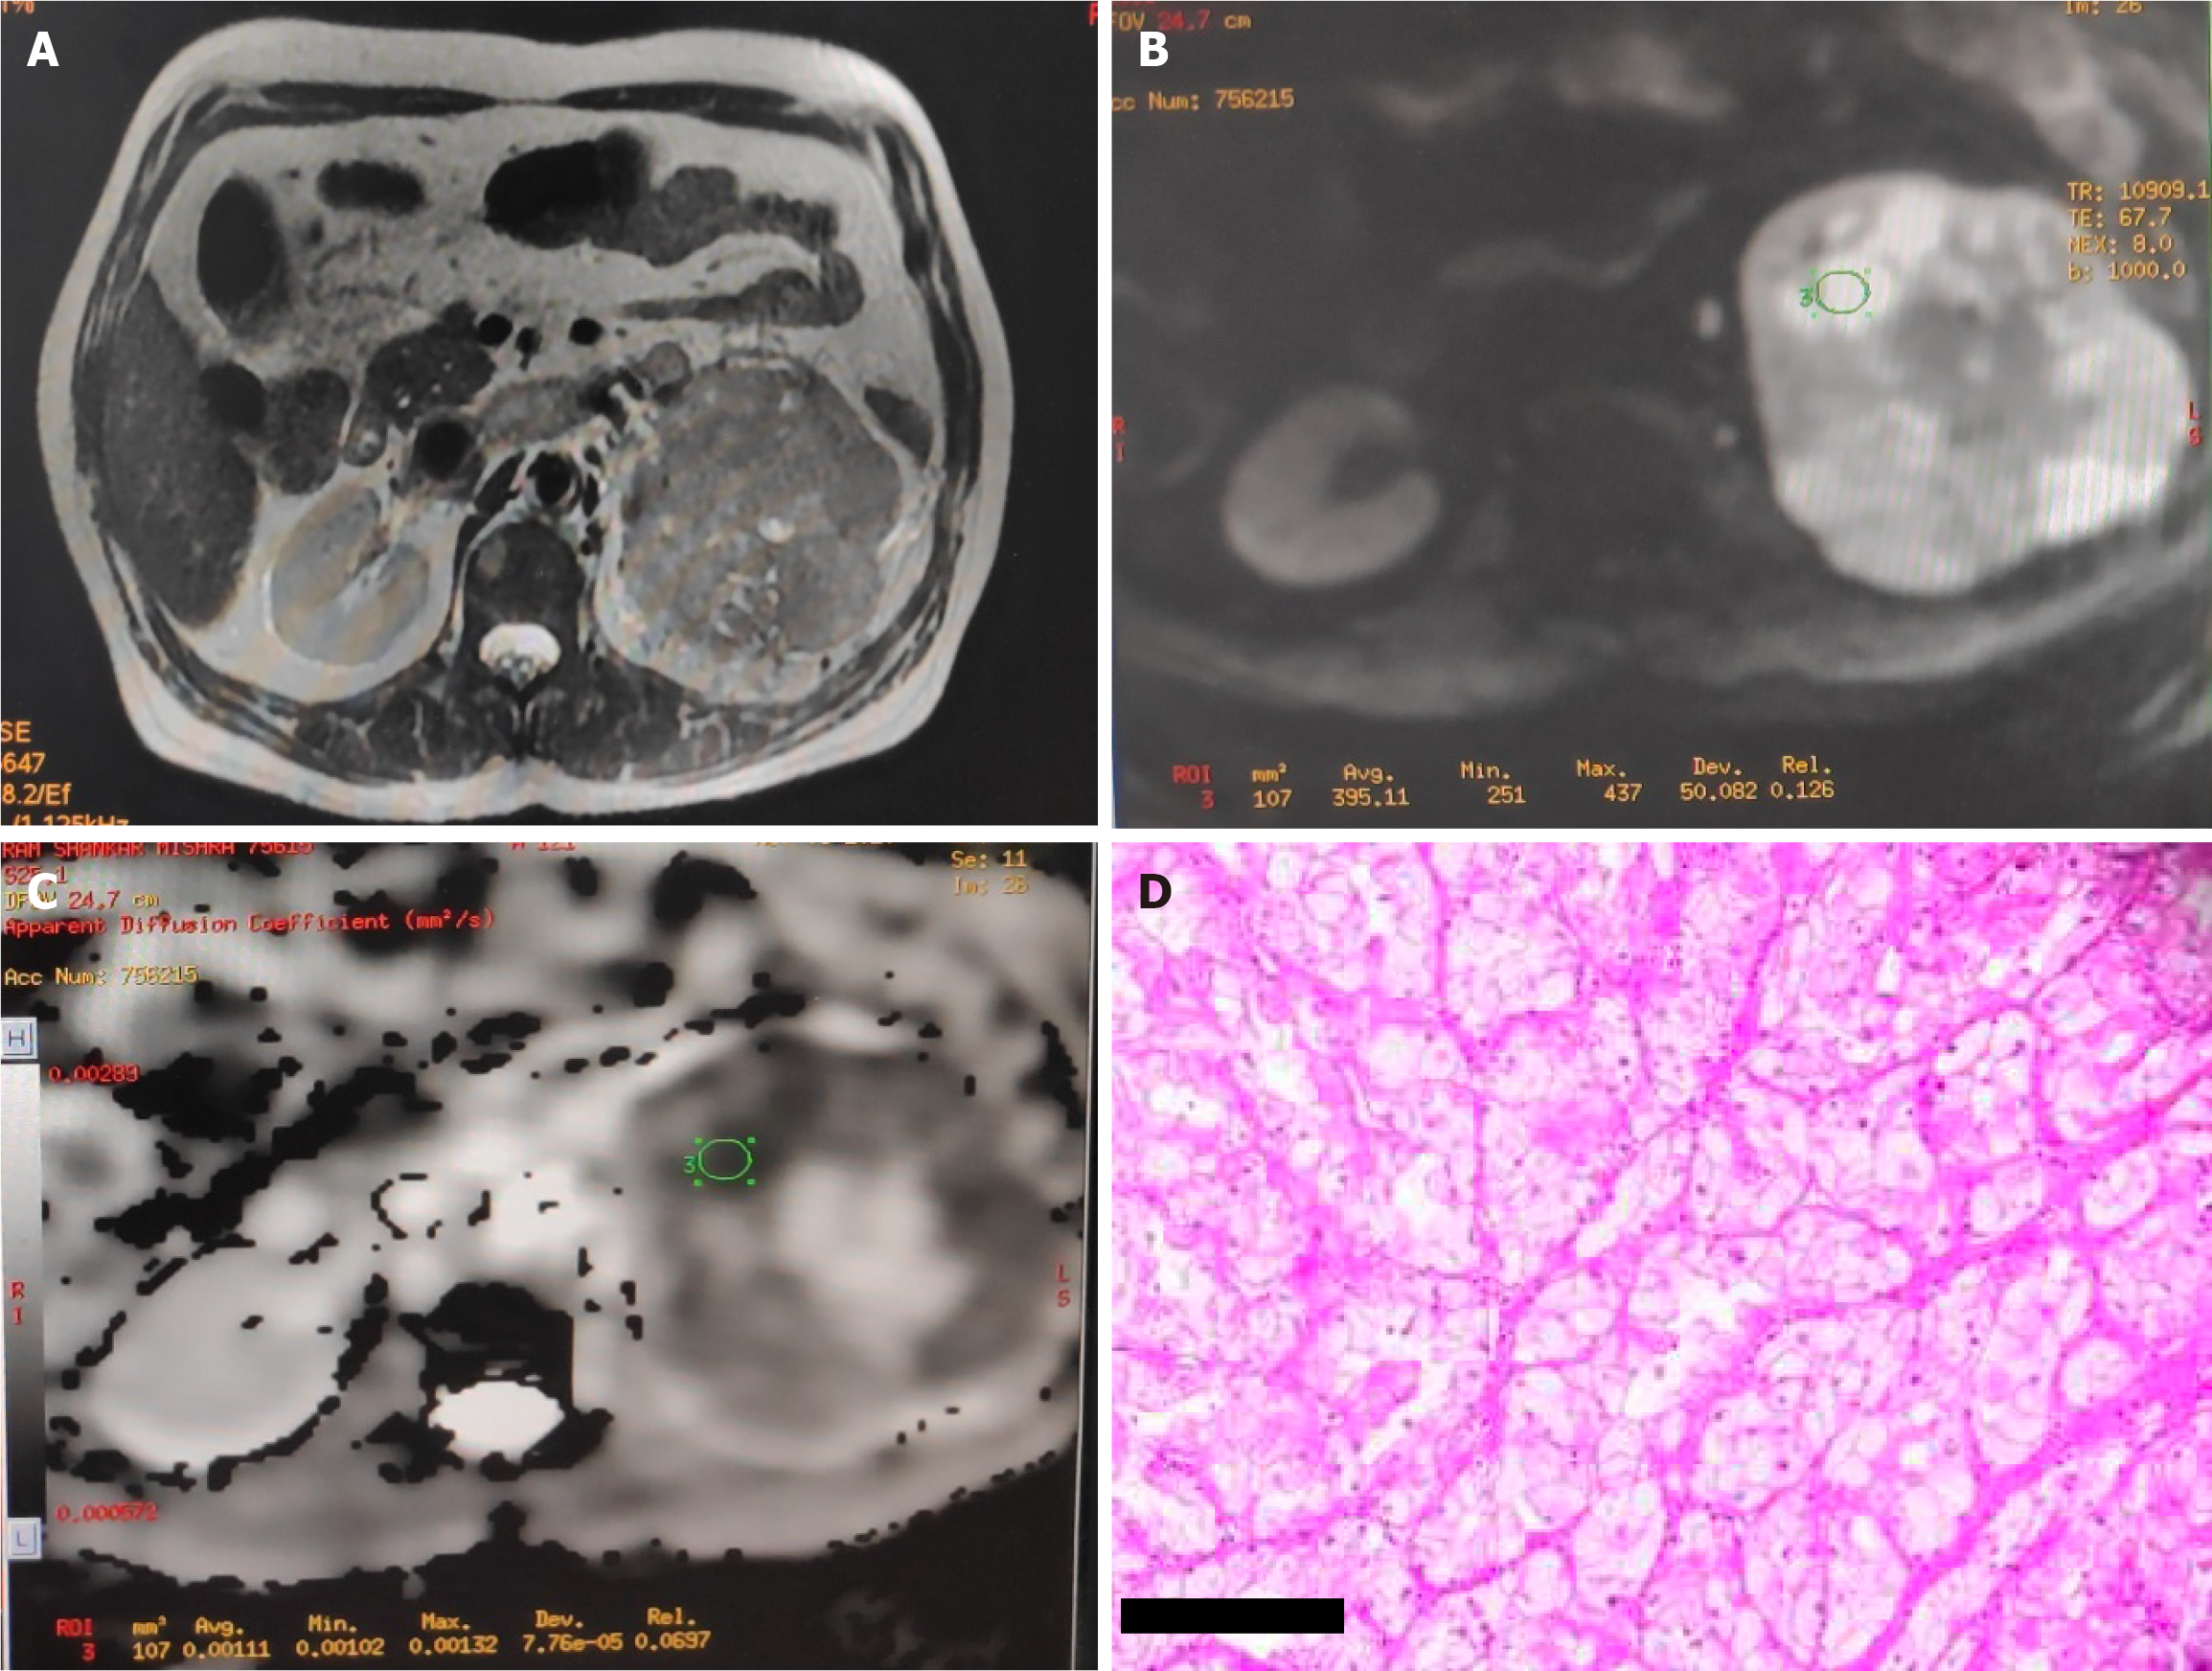
Figure 1 Imaging and histopathological correlation in clear cell renal cell carcinoma.
A: Axial T2-weighted magnetic resonance image showing renal cell carcinoma; B: Diffusion-weighted image of the same lesion; C: Corresponding apparent diffusion coefficient map; D: Histopathological image confirming clear cell renal cell carcinoma (200 × magnification, scale bar = 50 μm).
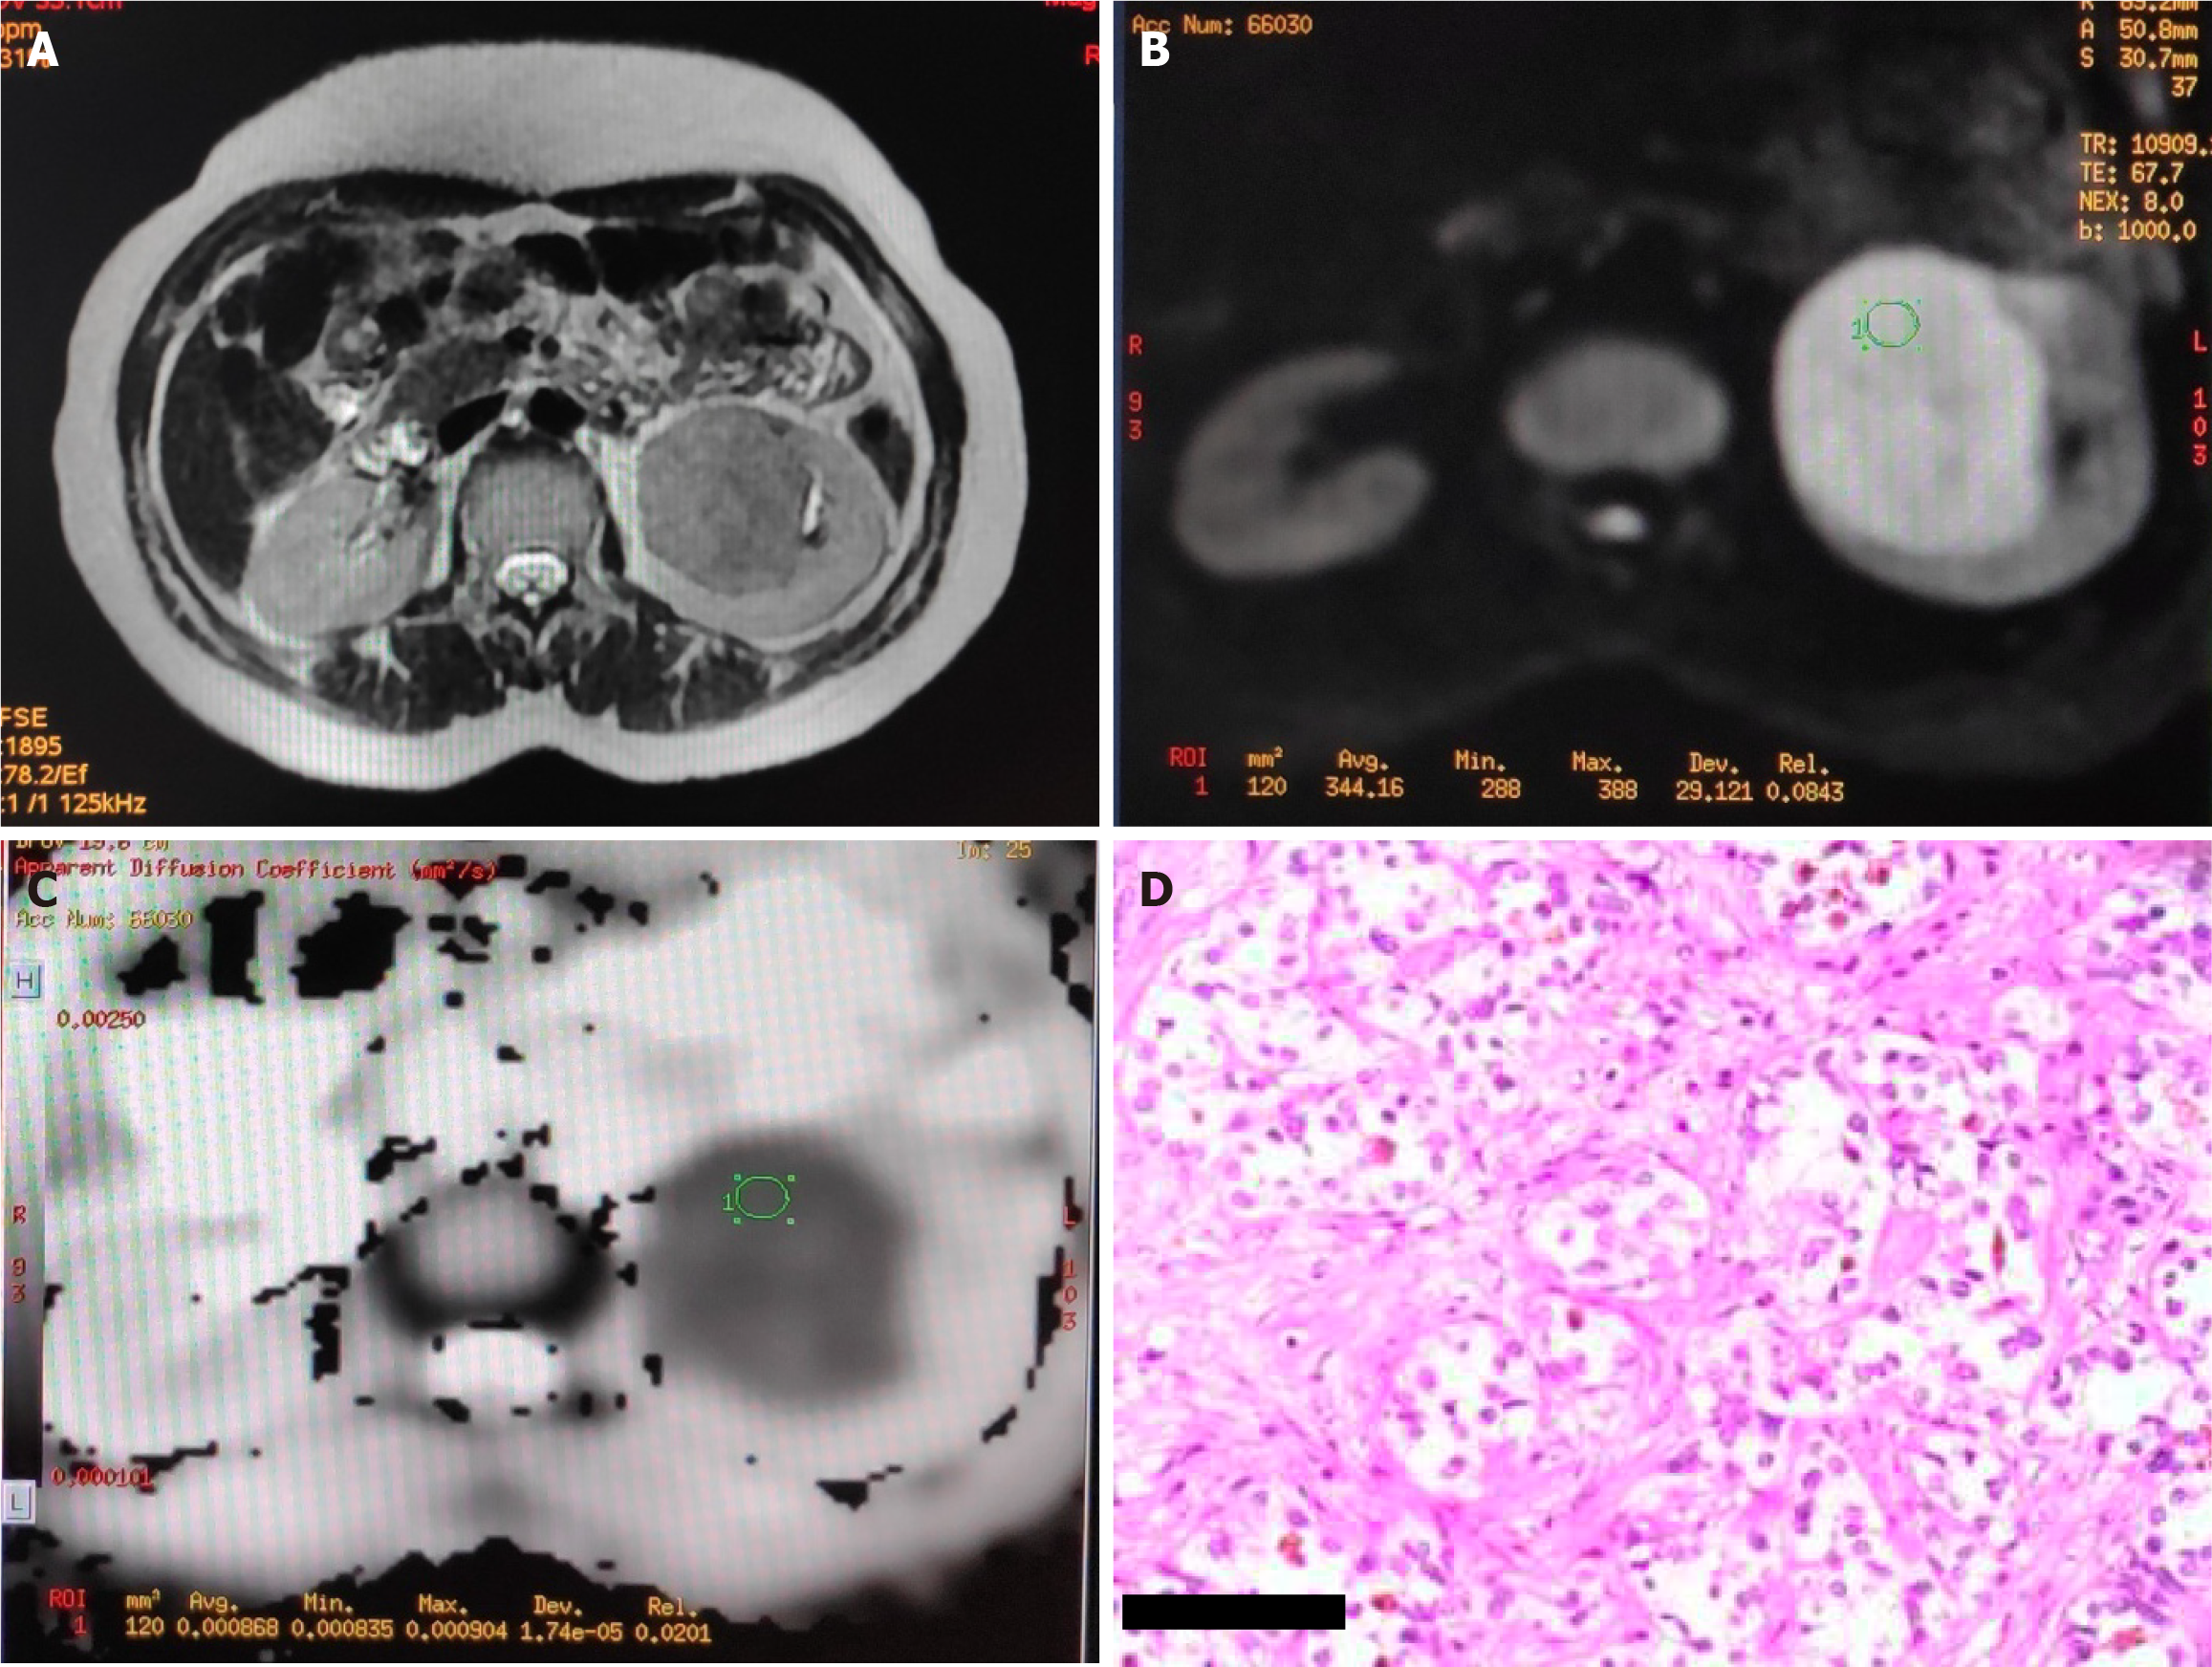
Figure 2 Imaging and histopathological correlation in papillary renal cell carcinoma.
A: Axial T2-weighted magnetic resonance image showing papillary renal cell carcinoma; B: Diffusion-weighted image of the lesion; C: Corresponding apparent diffusion coefficient map; D: Histopathological image confirming papillary renal cell carcinoma (200 × magnification, scale bar = 50 μm).
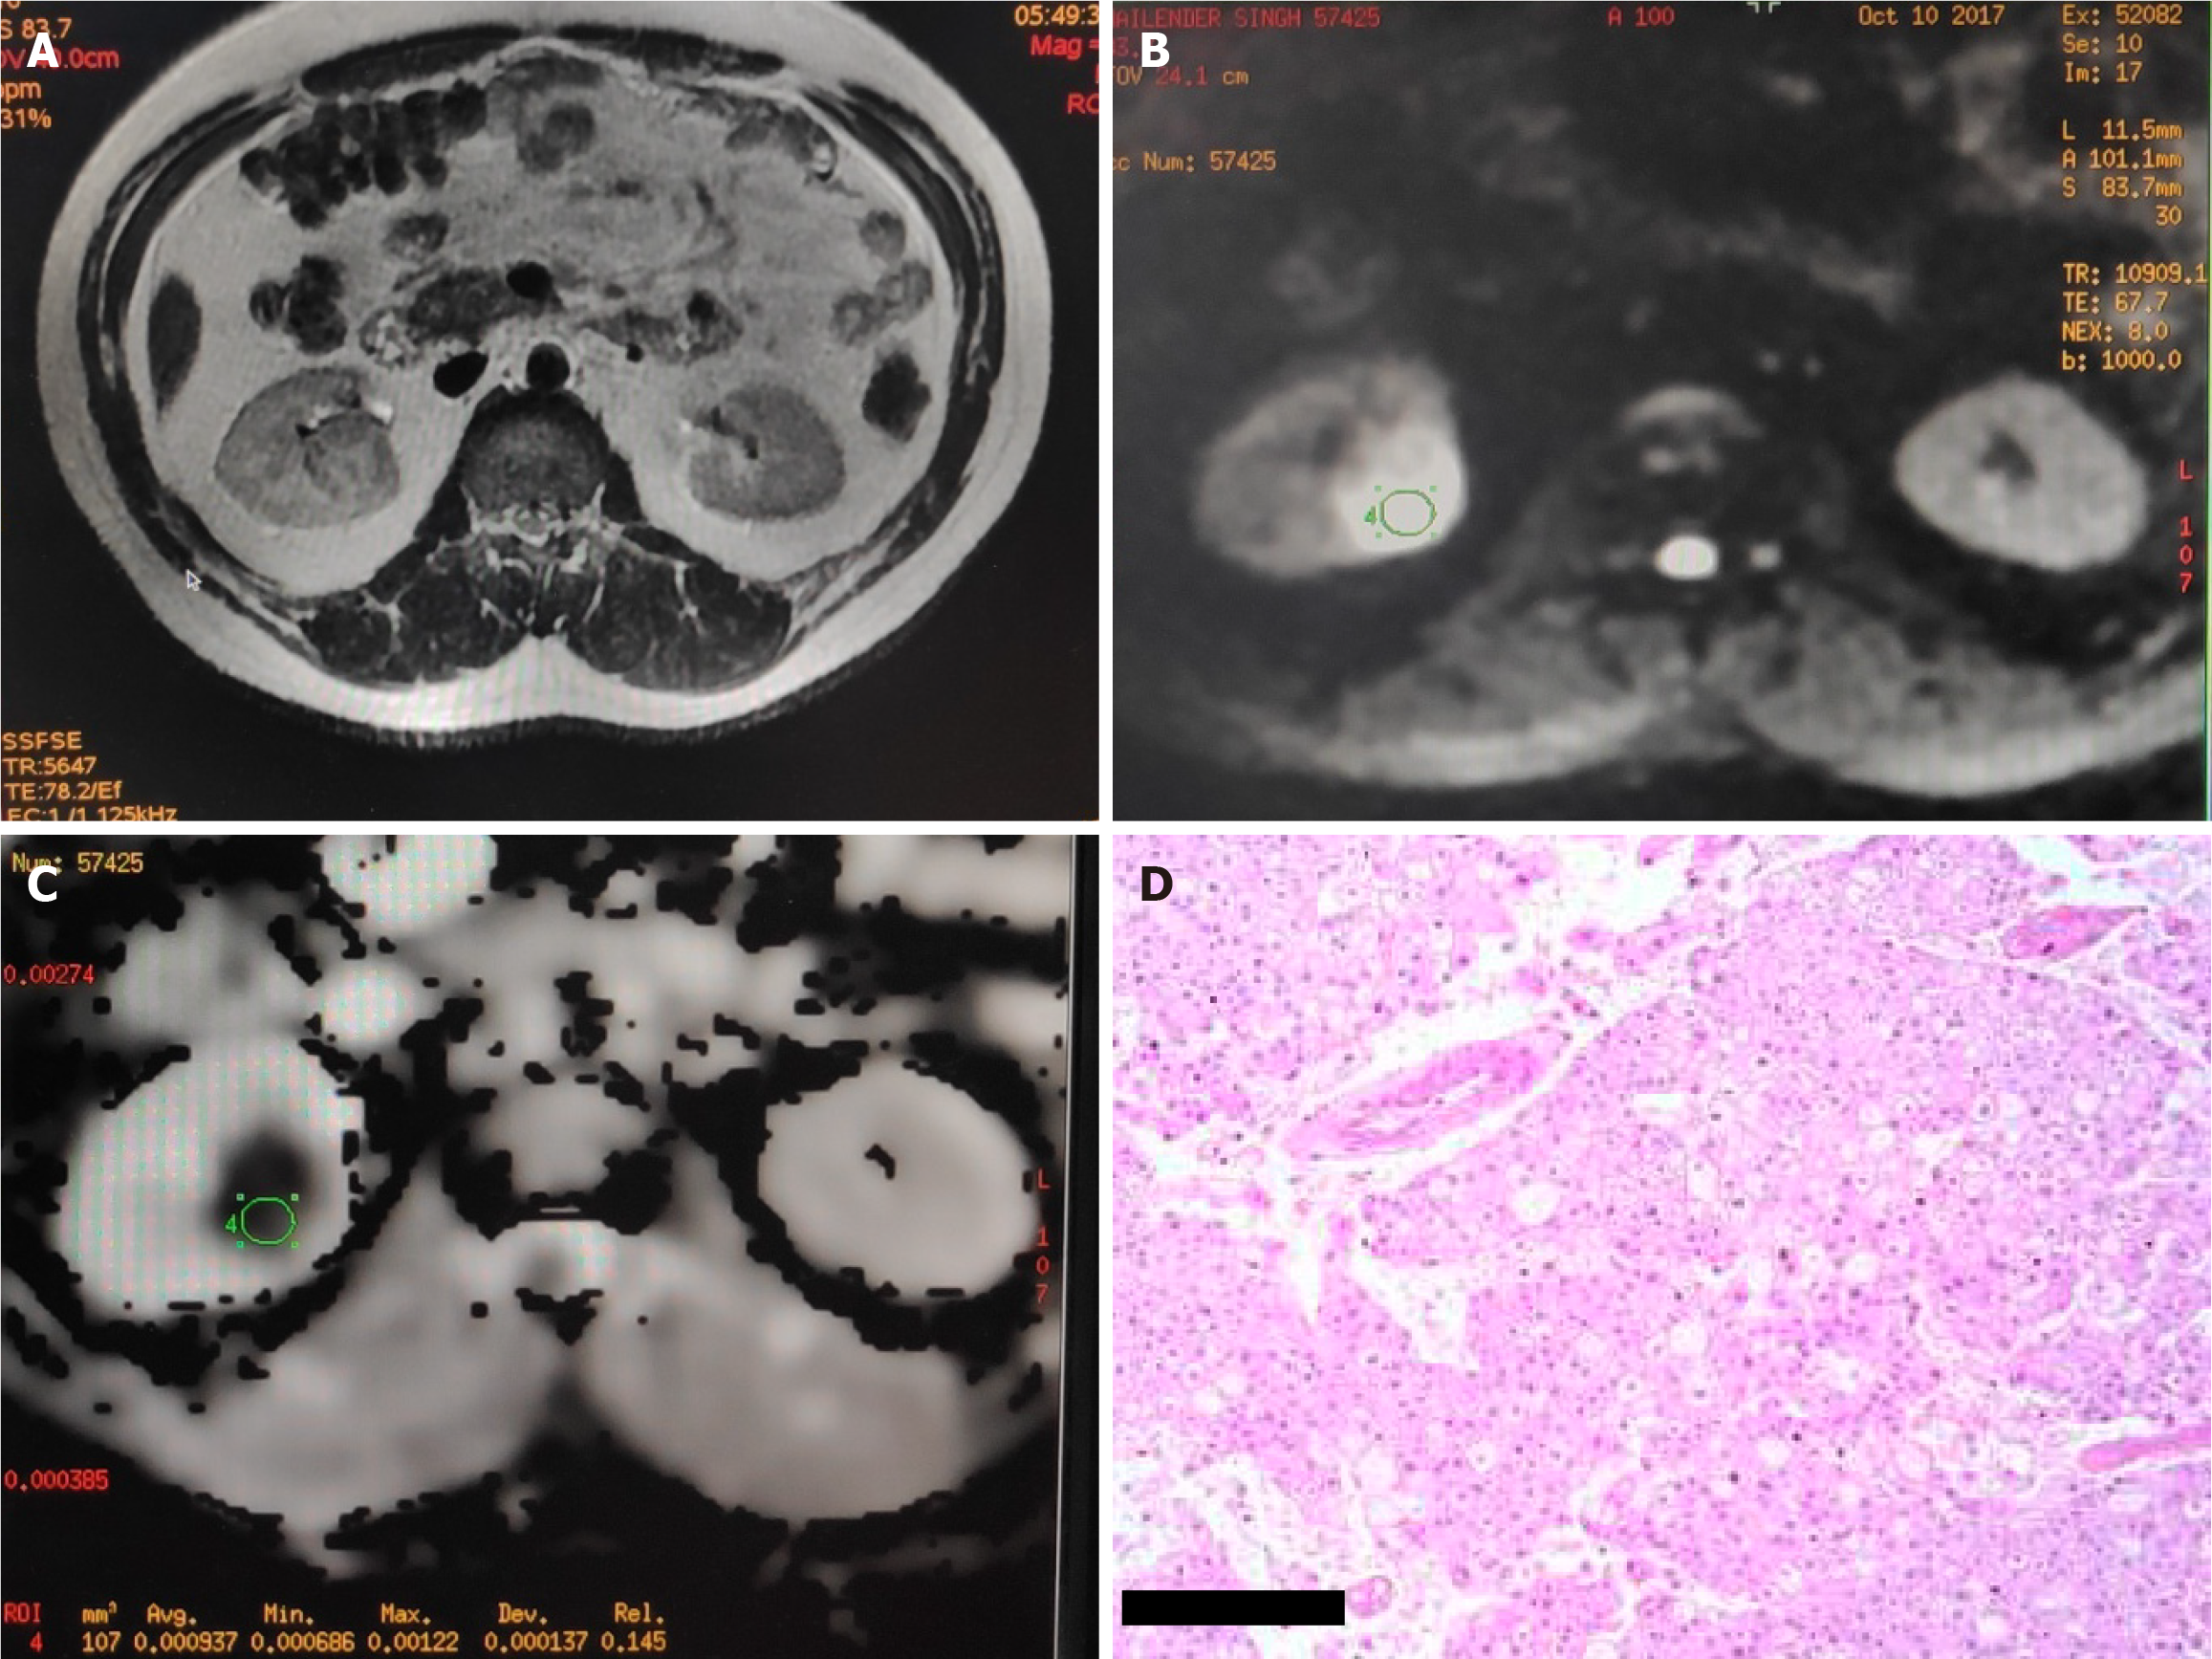
Figure 3 Imaging and histopathological correlation in chromophobe renal cell carcinoma.
A: Axial T2-weighted magnetic resonance image showing chromophobe renal cell carcinoma; B: Diffusion-weighted image of the lesion; C: Corresponding apparent diffusion coefficient map; D: Histopathological image confirming chromophobe renal cell carcinoma (200 × magnification, scale bar = 50 μm).
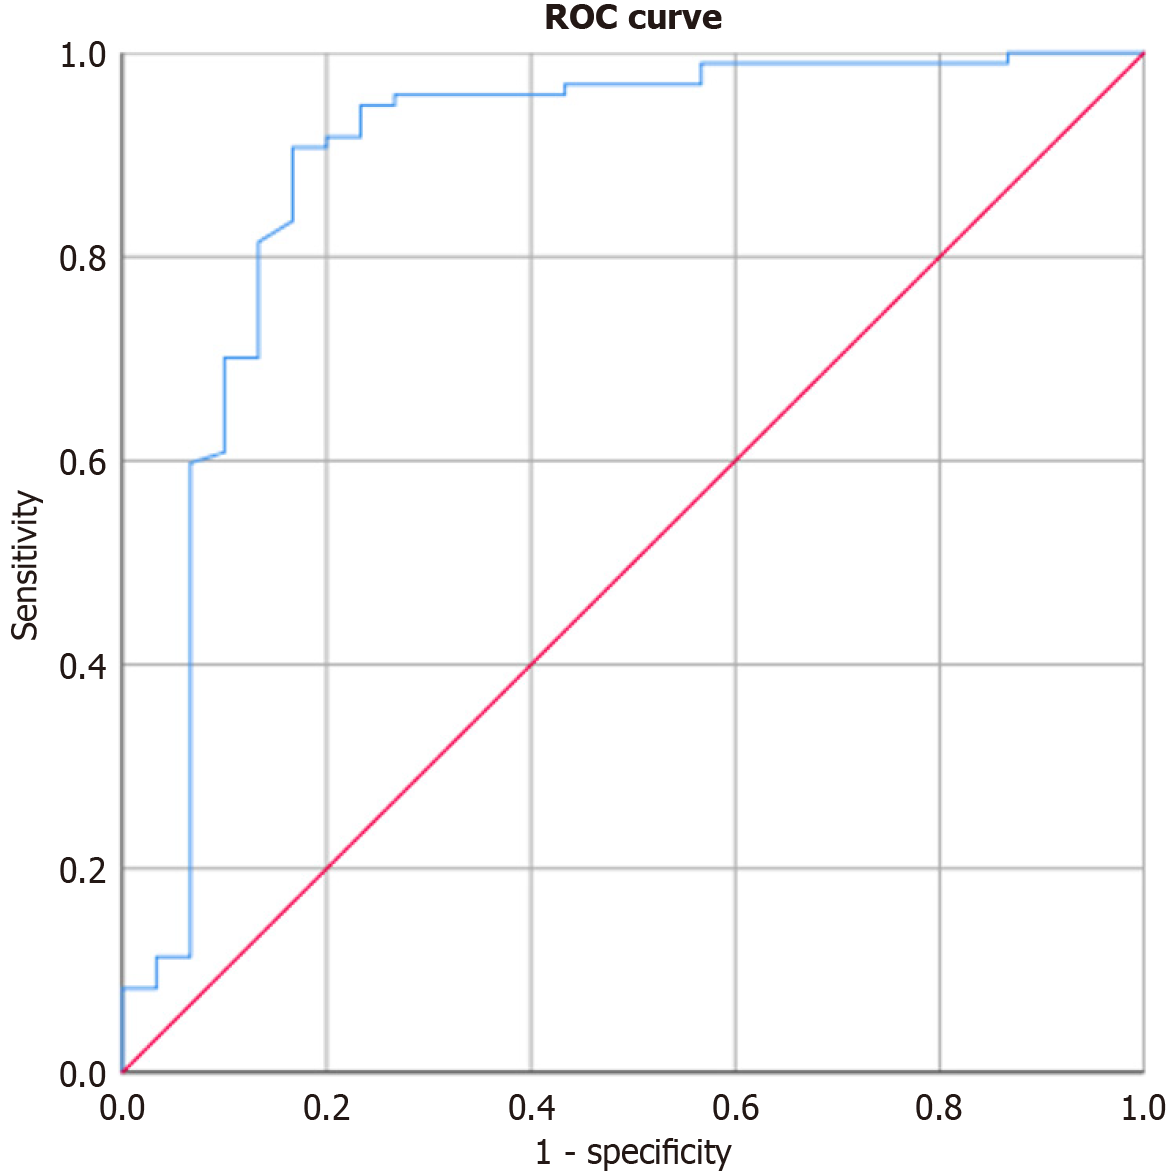
Figure 4 Receiver operating characteristic curve analysis demonstrating the diagnostic performance of apparent diffusion coefficient values in differentiating clear cell renal cell carcinoma from non-clear cell renal cell carcinoma.
ROC: Receiver operating characteristic.
- Citation: Lal H, Jowel P, Verma P, Shamim A, Prasad R, Singh A, Singh UP, Sureka SK, Siddiqui F, Jain M, Srivastava A, Yadav P. Role of diffusion-weighted magnetic resonance imaging and apparent diffusion coefficient in subtyping renal cell carcinoma. World J Radiol 2026; 18(5): 119367
- URL: https://www.wjgnet.com/1949-8470/full/v18/i5/119367.htm
- DOI: https://dx.doi.org/10.4329/wjr.v18.i5.119367