
















Copyright: ©Author(s) 2026.
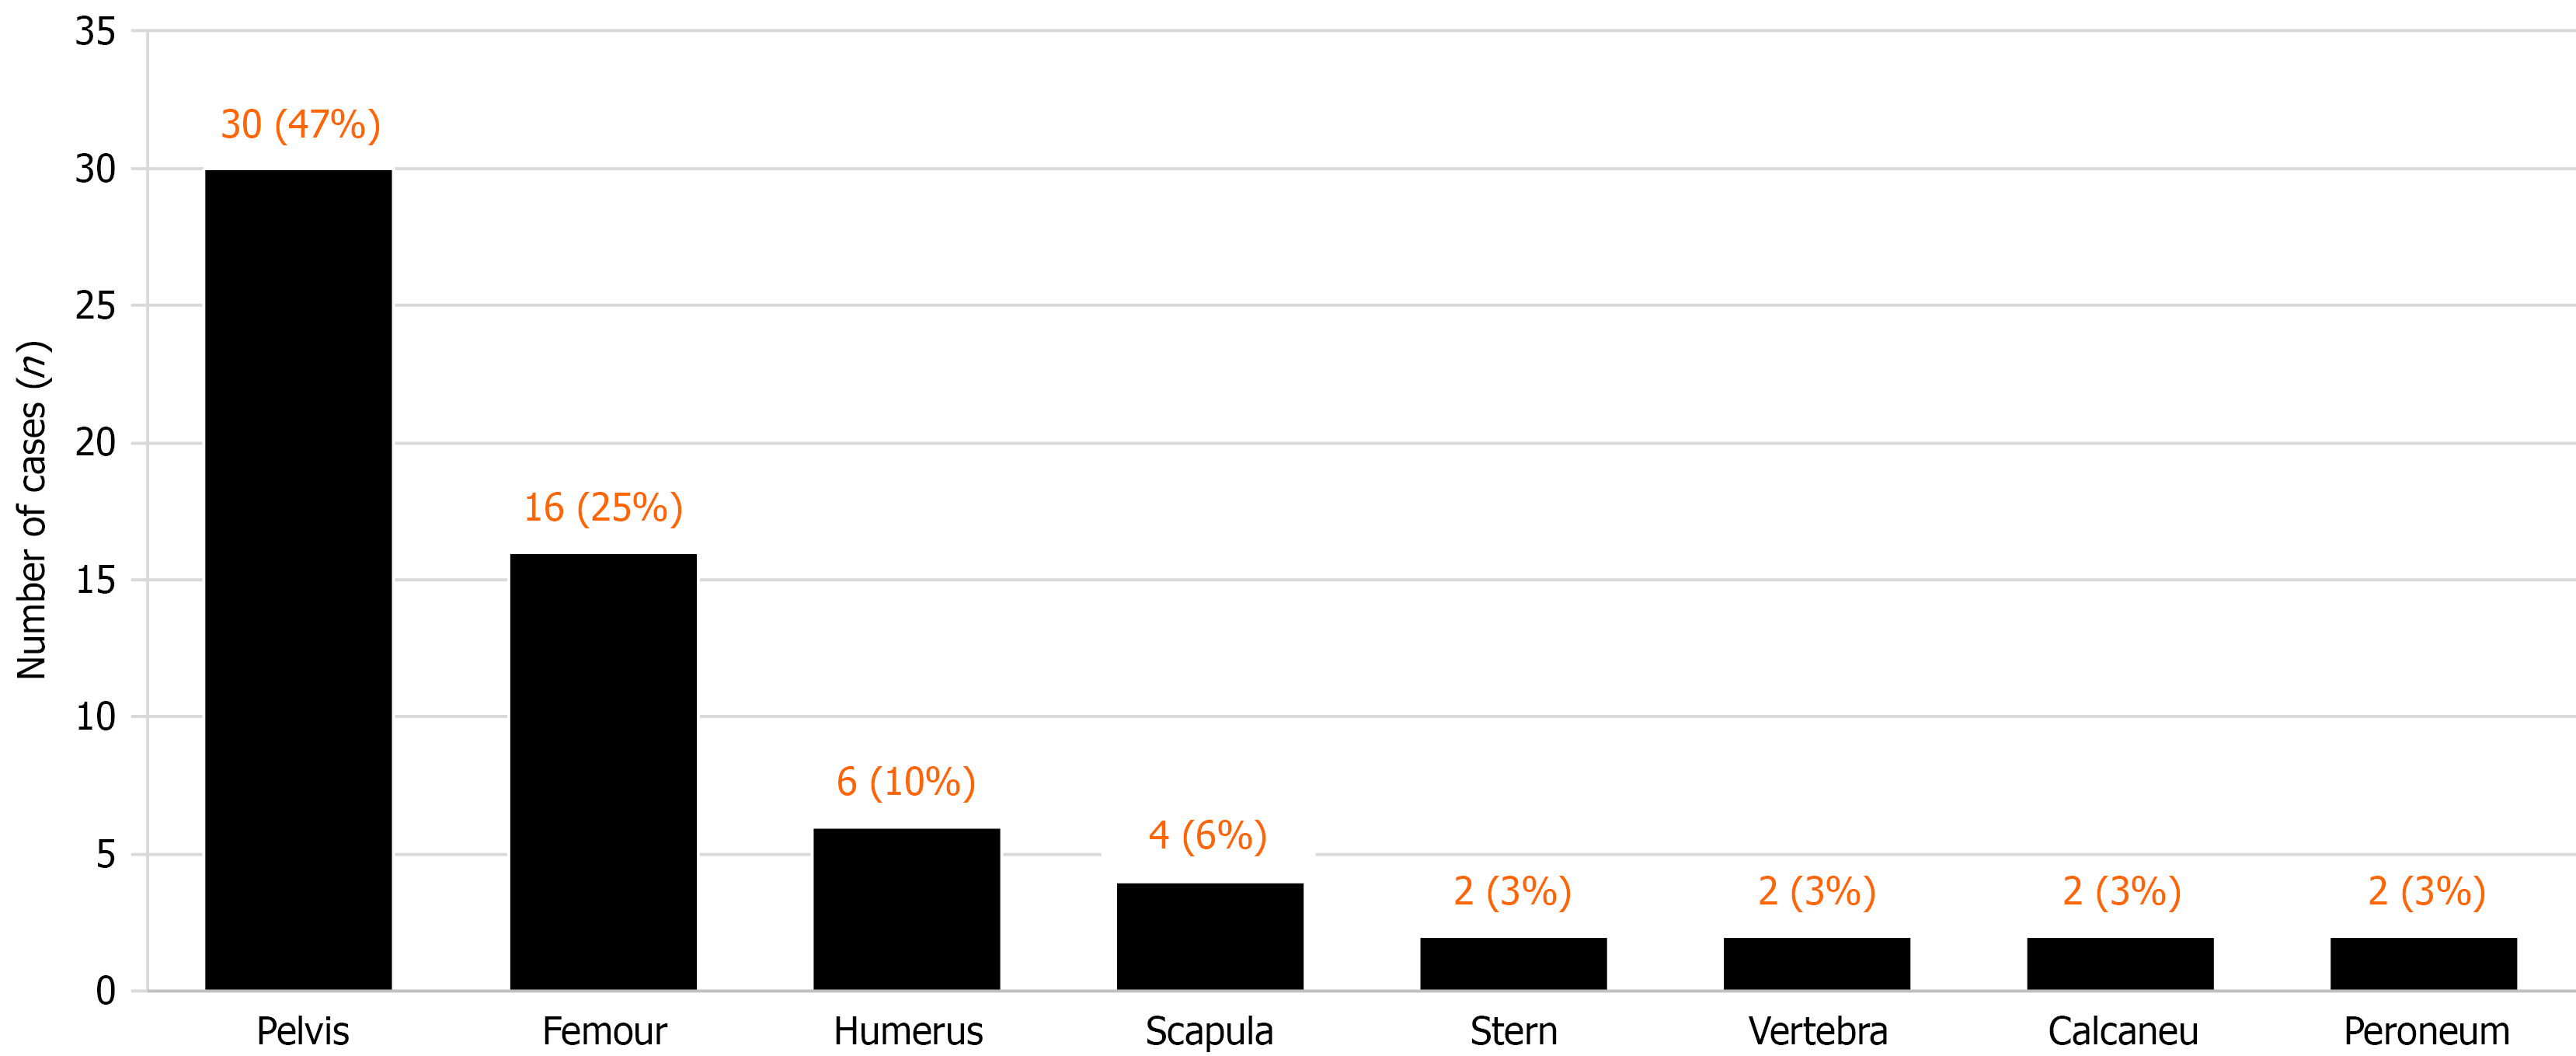
Figure 1
Anatomical distribution of the 64 included biopsy procedures.
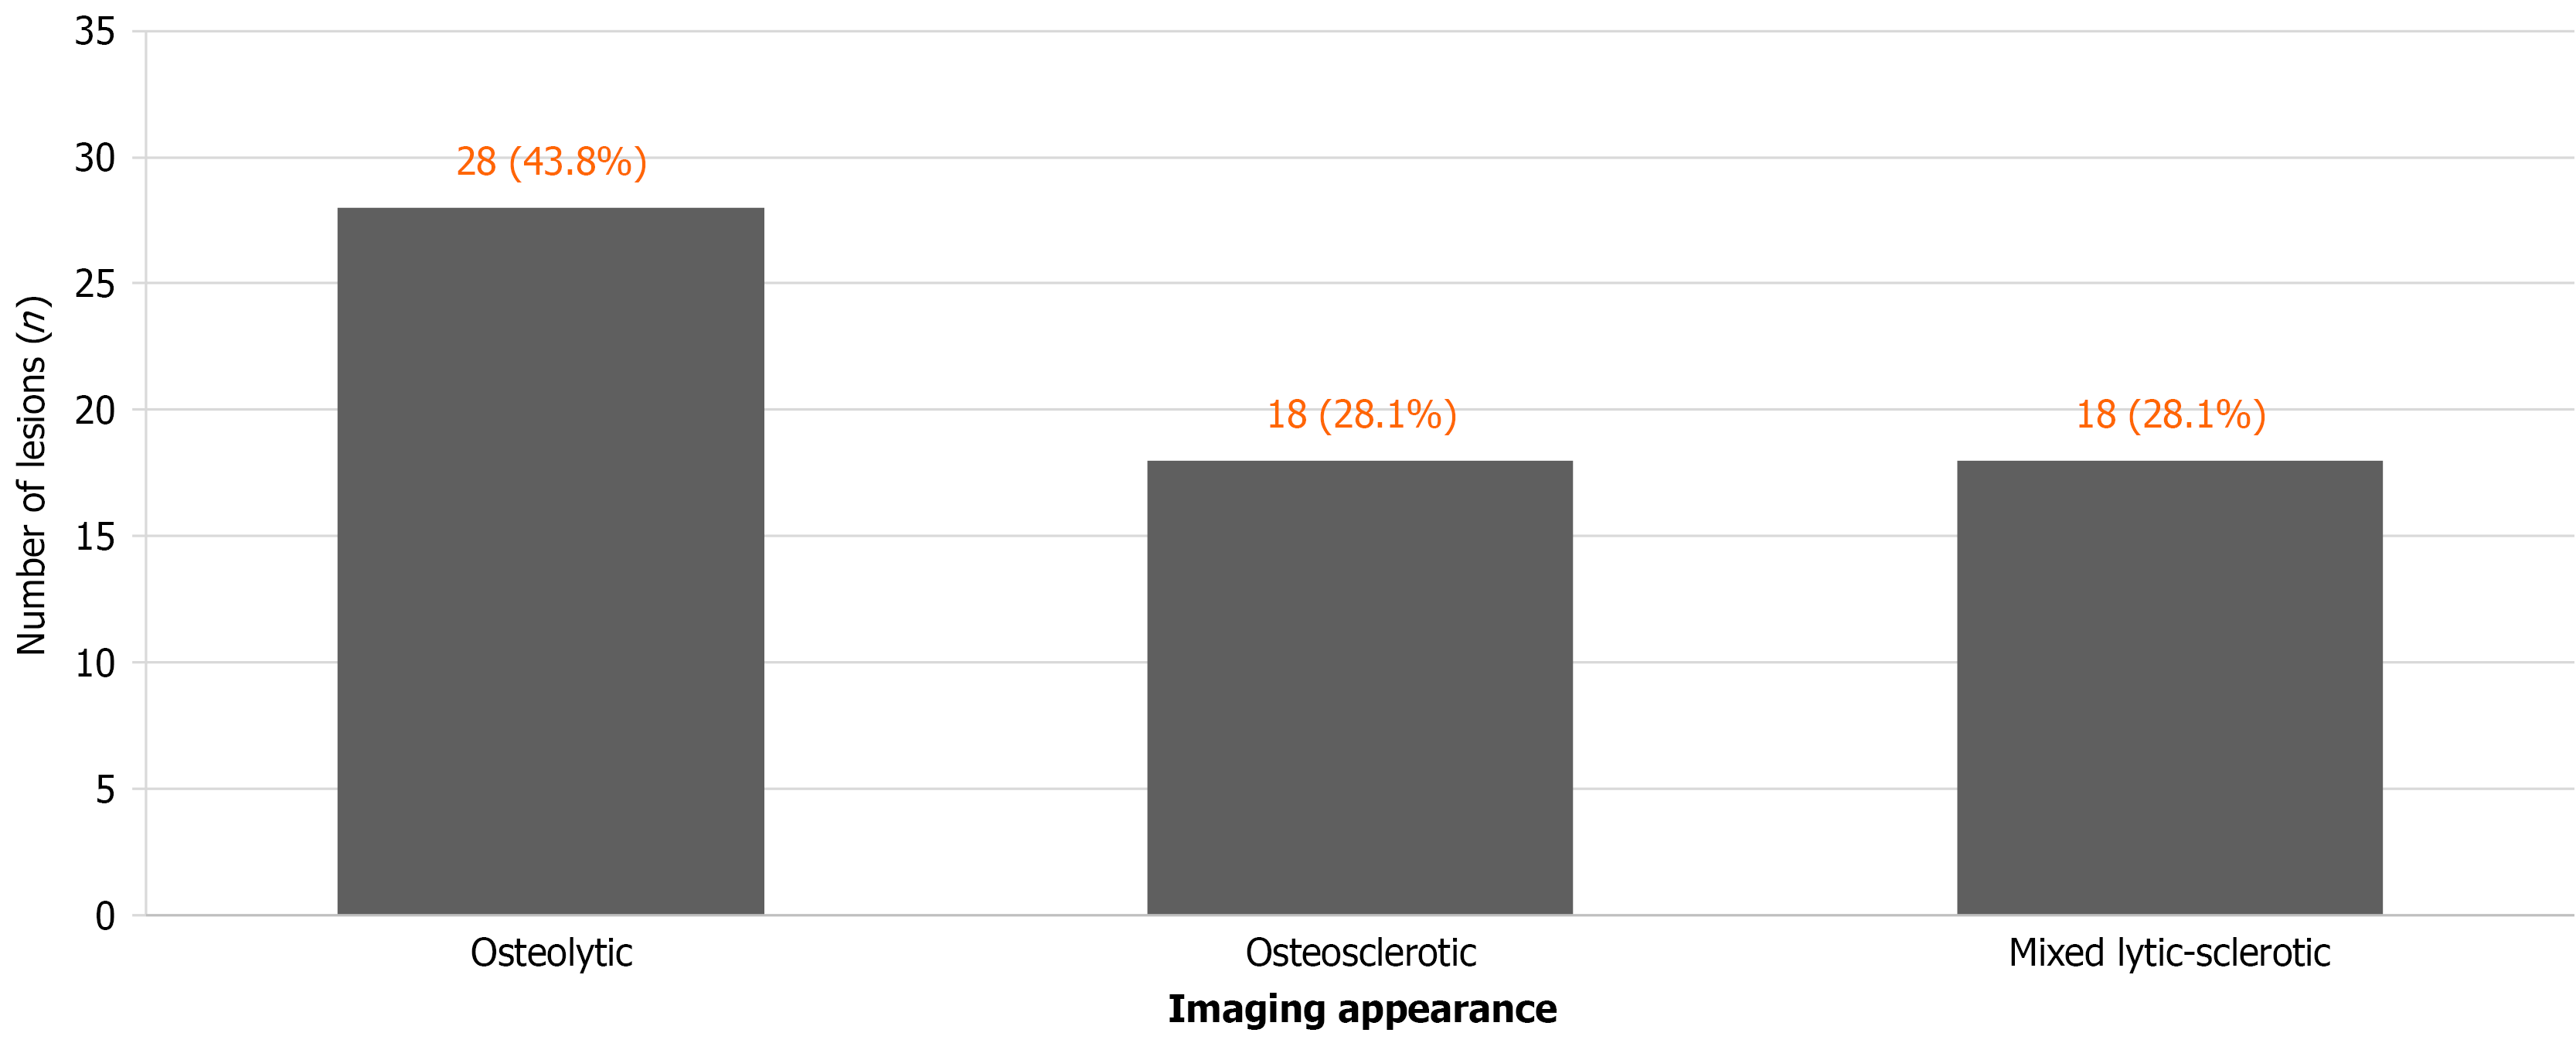
Figure 2 Imaging morphology of the 64 included biopsy procedures: Osteolytic, 28/64 (43.
8%); osteosclerotic, 18/64 (28.1%); mixed lytic-sclerotic, 18/64 (28.1%). Percentages use all 64 procedures as the denominator.
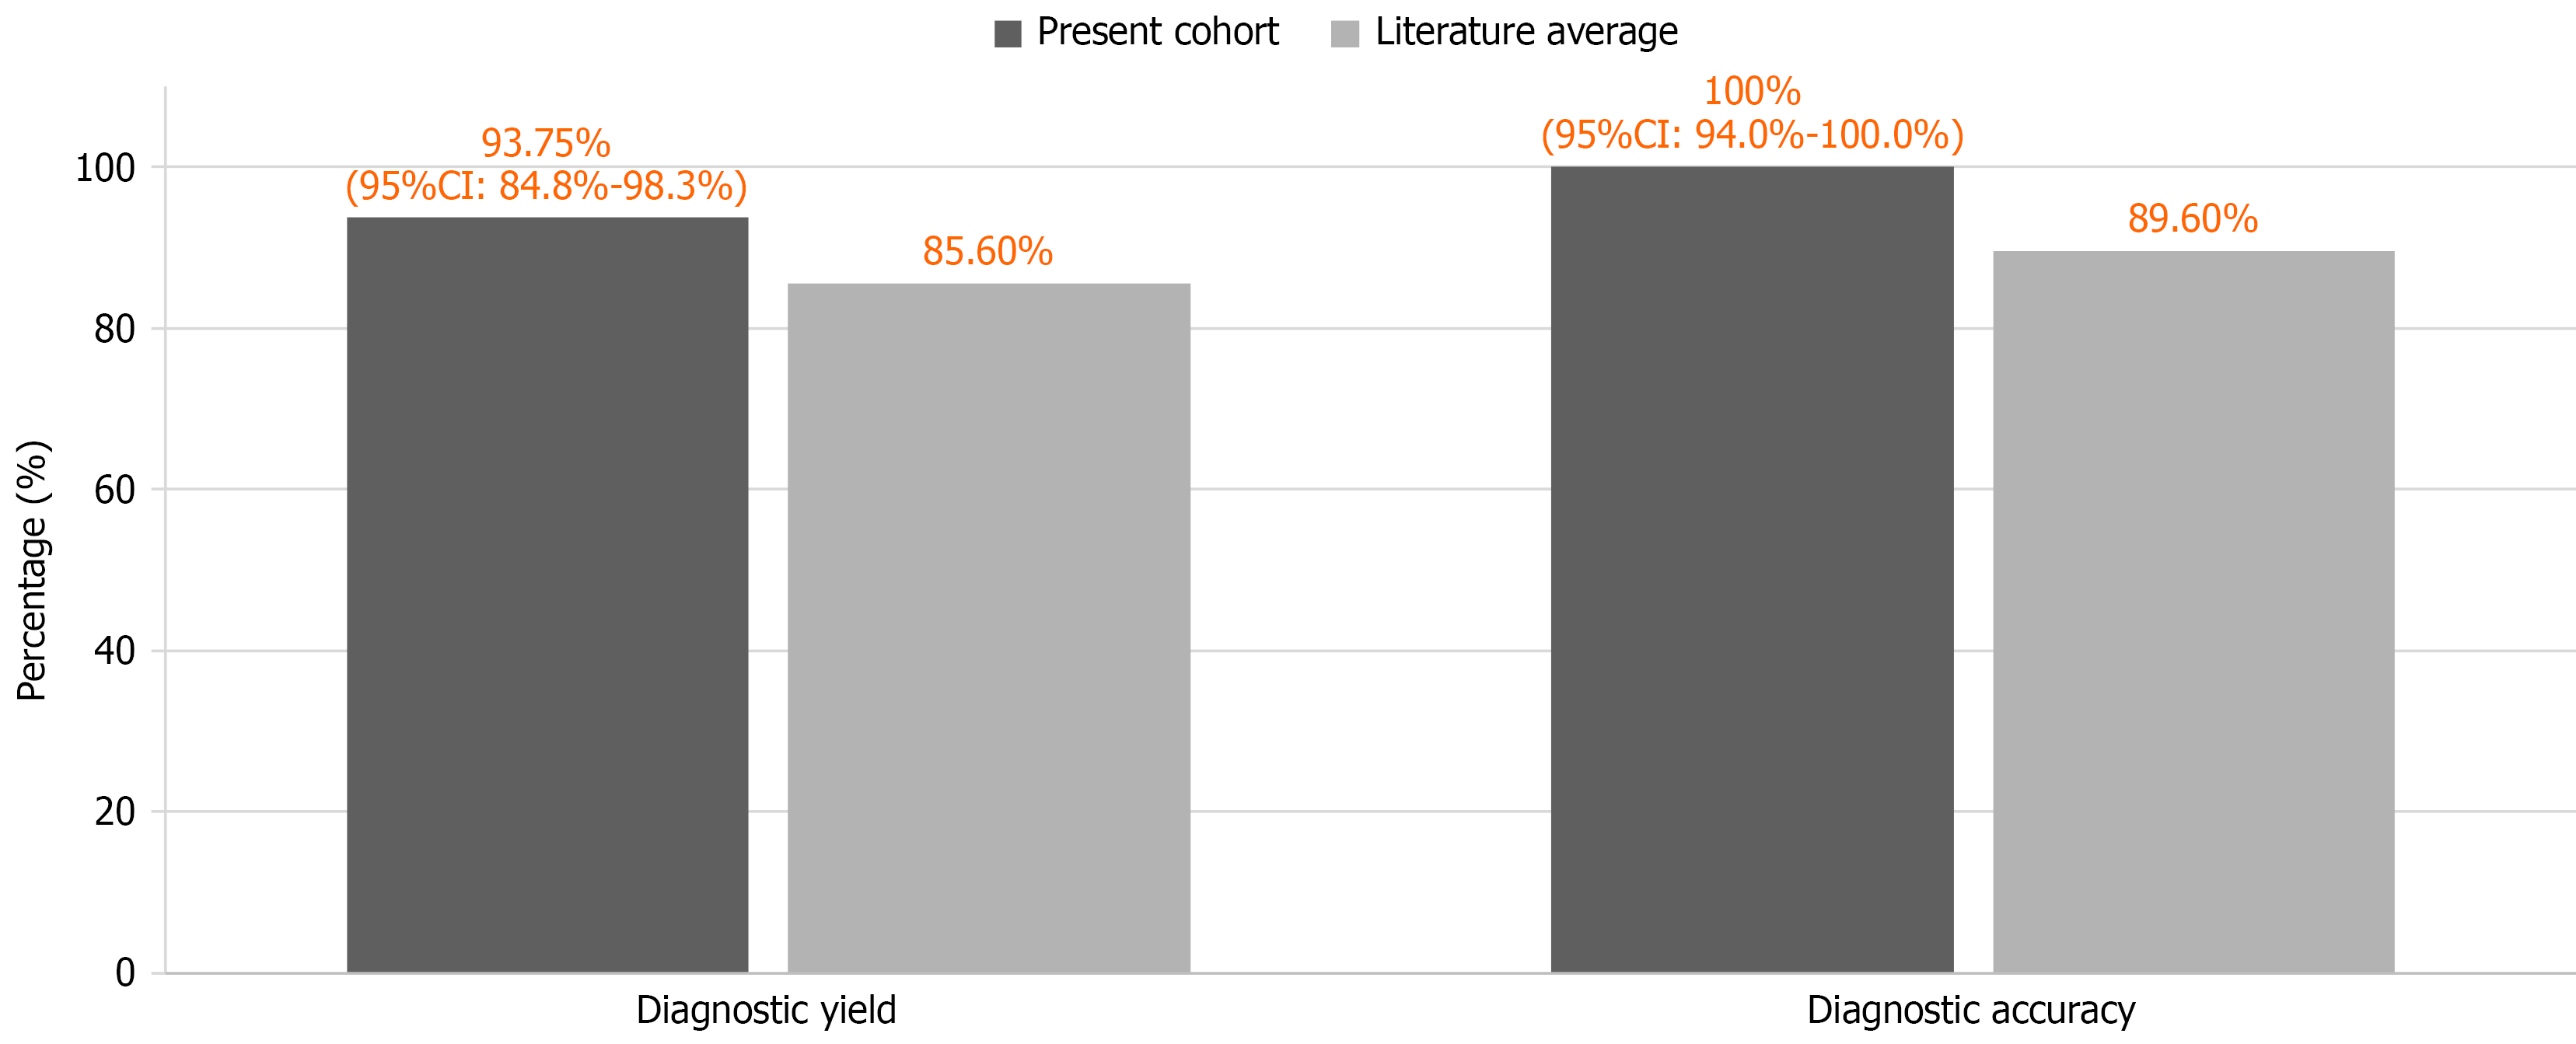
Figure 3 Procedure disposition and diagnostic-verification availability.
This flow diagram replaces the unsupported cohort-versus-literature-average chart. NR means not reported, not zero. Counts of 64, 60, and four are taken from the supplied manuscript; screening/exclusion totals and unique-patient linkage require source verification (AQ1-AQ3).
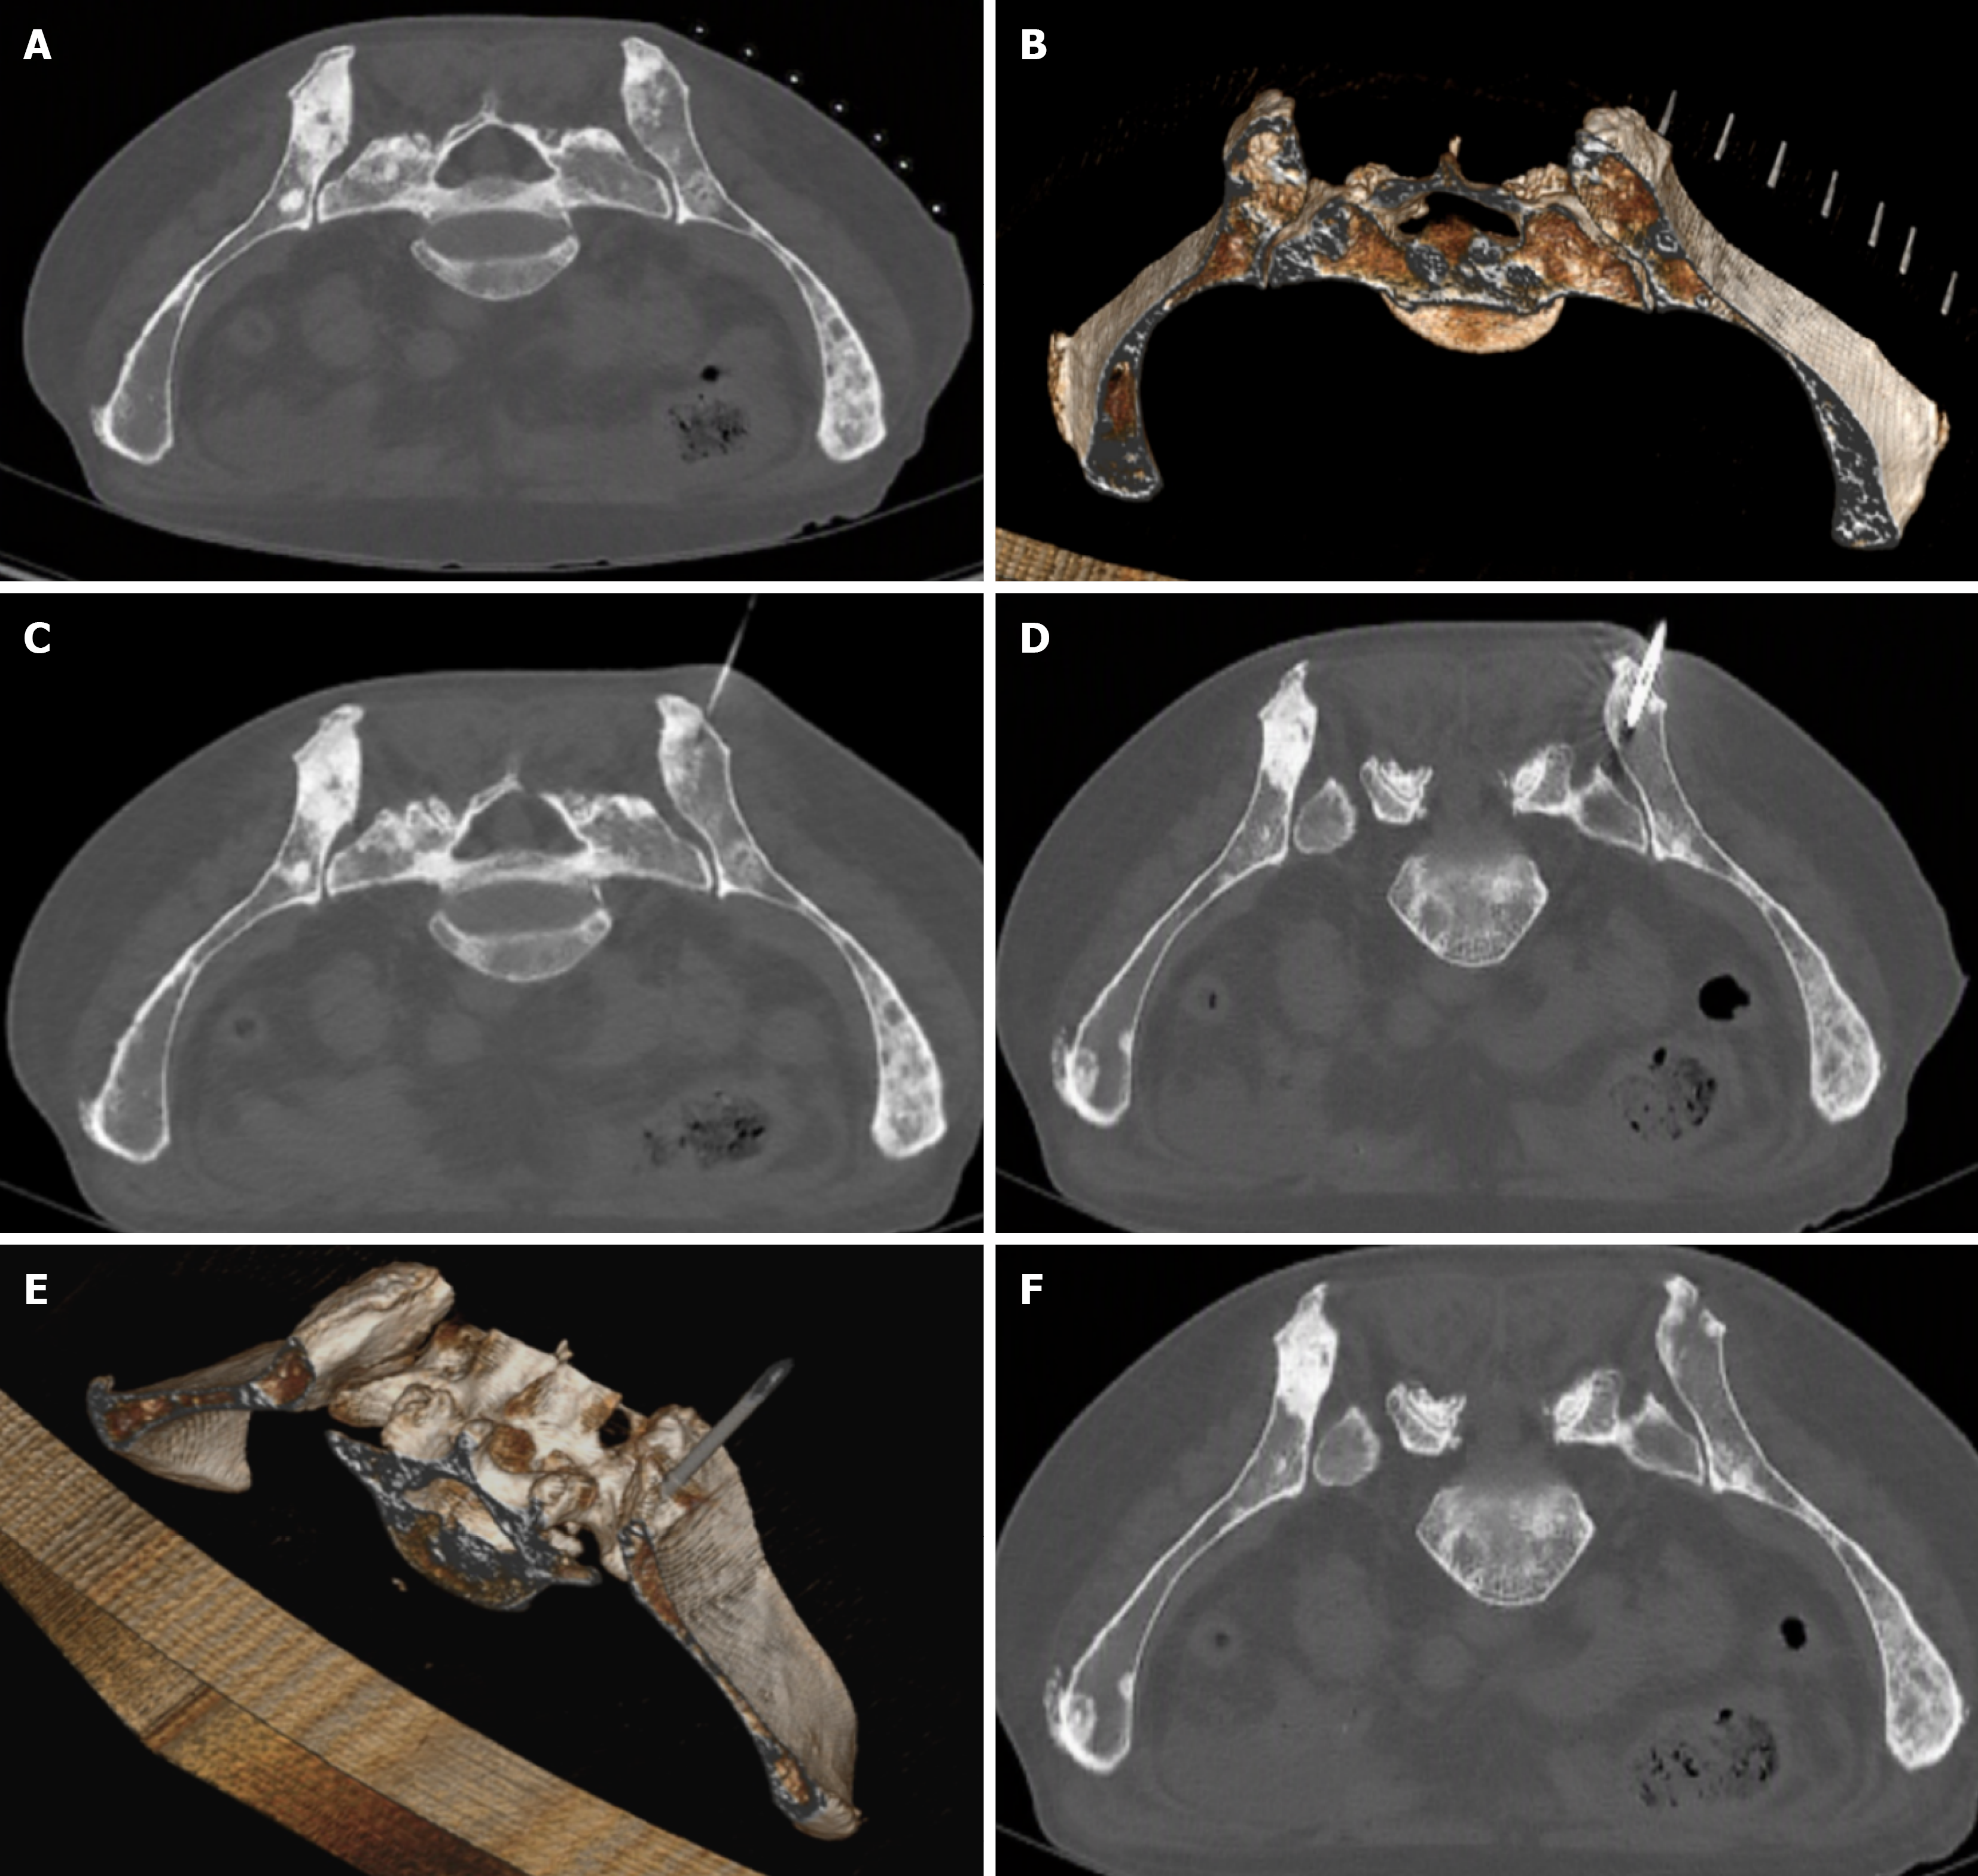
Figure 4 Computed tomography-guided needle biopsy of an osteocondensing lesion.
A: Needle computed tomography (CT) scan on the horizontal line; B: Needle scan on the horizontal line with three-dimensional reconstruction; C: Needle guidance under local anesthesia; D: Simple CT scan of the intralesional biopsy needle; E: Three-dimensional CT reconstructed view of the intralesional needle; F: Control scan, confirming the absence of local complications.
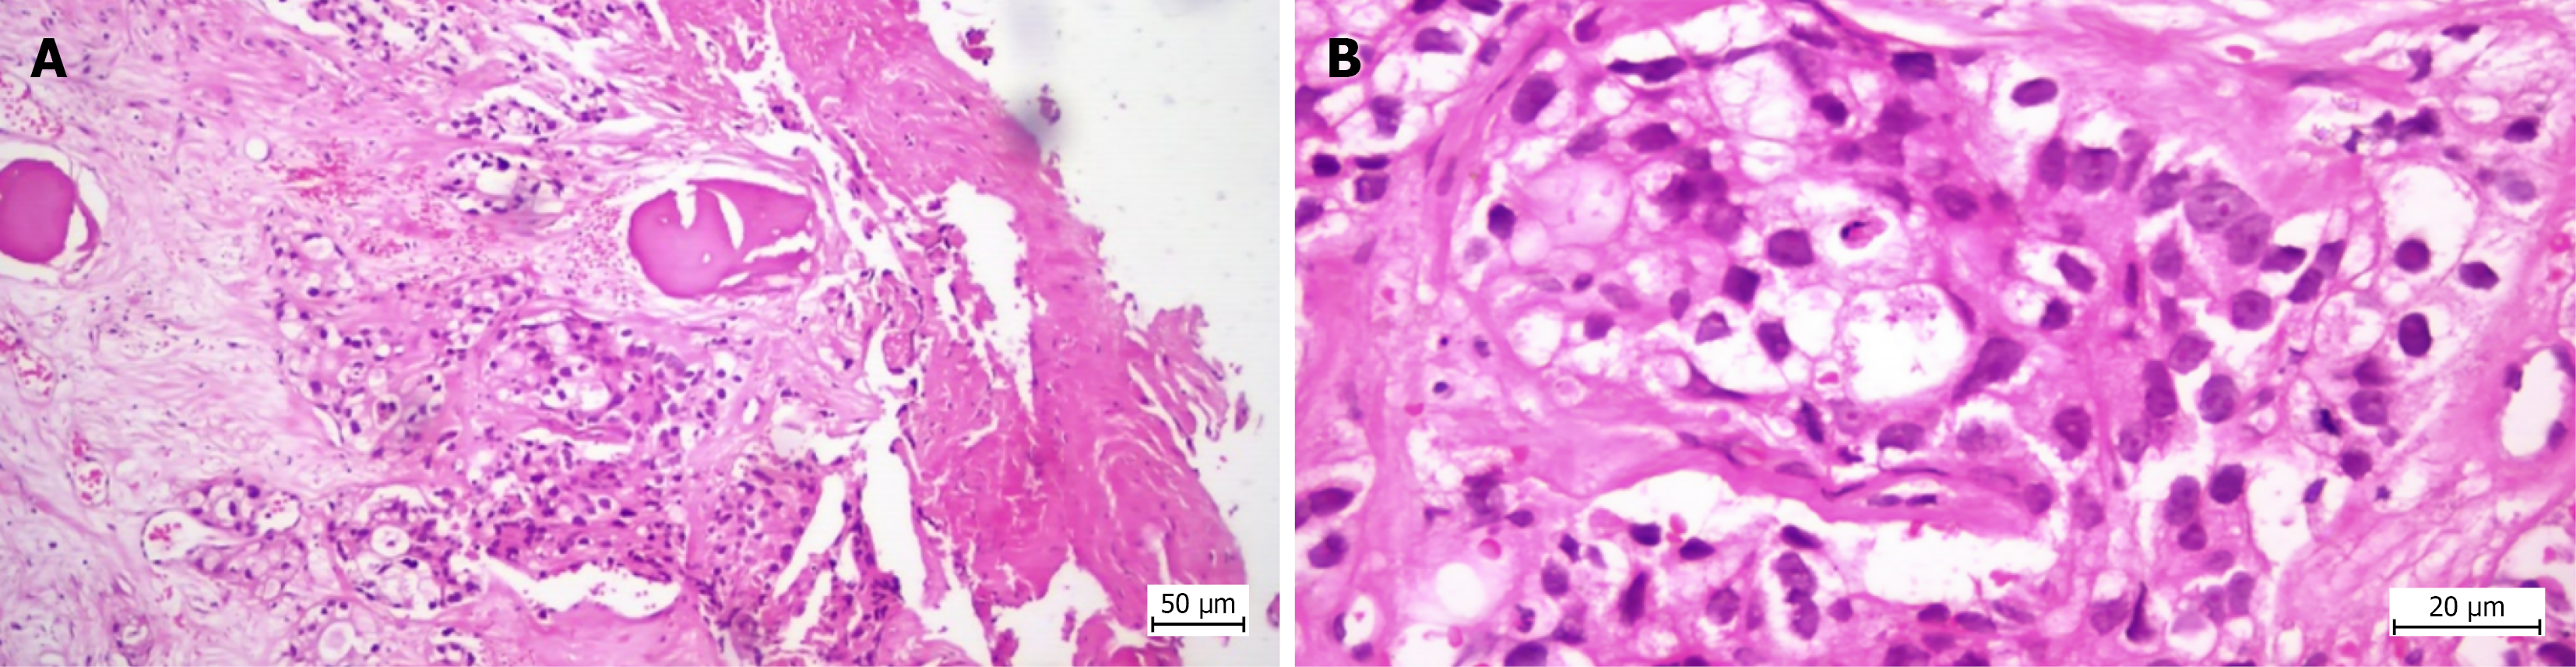
Figure 5 Histopathological appearance of the biopsy specimen in Case 1.
Bone tissue showing histological structure altered by malignant epithelial neoplastic proliferation with the histopathological appearance of poorly differentiated adenocarcinoma (G3) with glandular (distinct and cribriform) and solid development pattern. A: Hematoxylin and eosin staining, 100 × optical zoom; B: Hematoxylin and eosin staining, 400 × optical zoom.
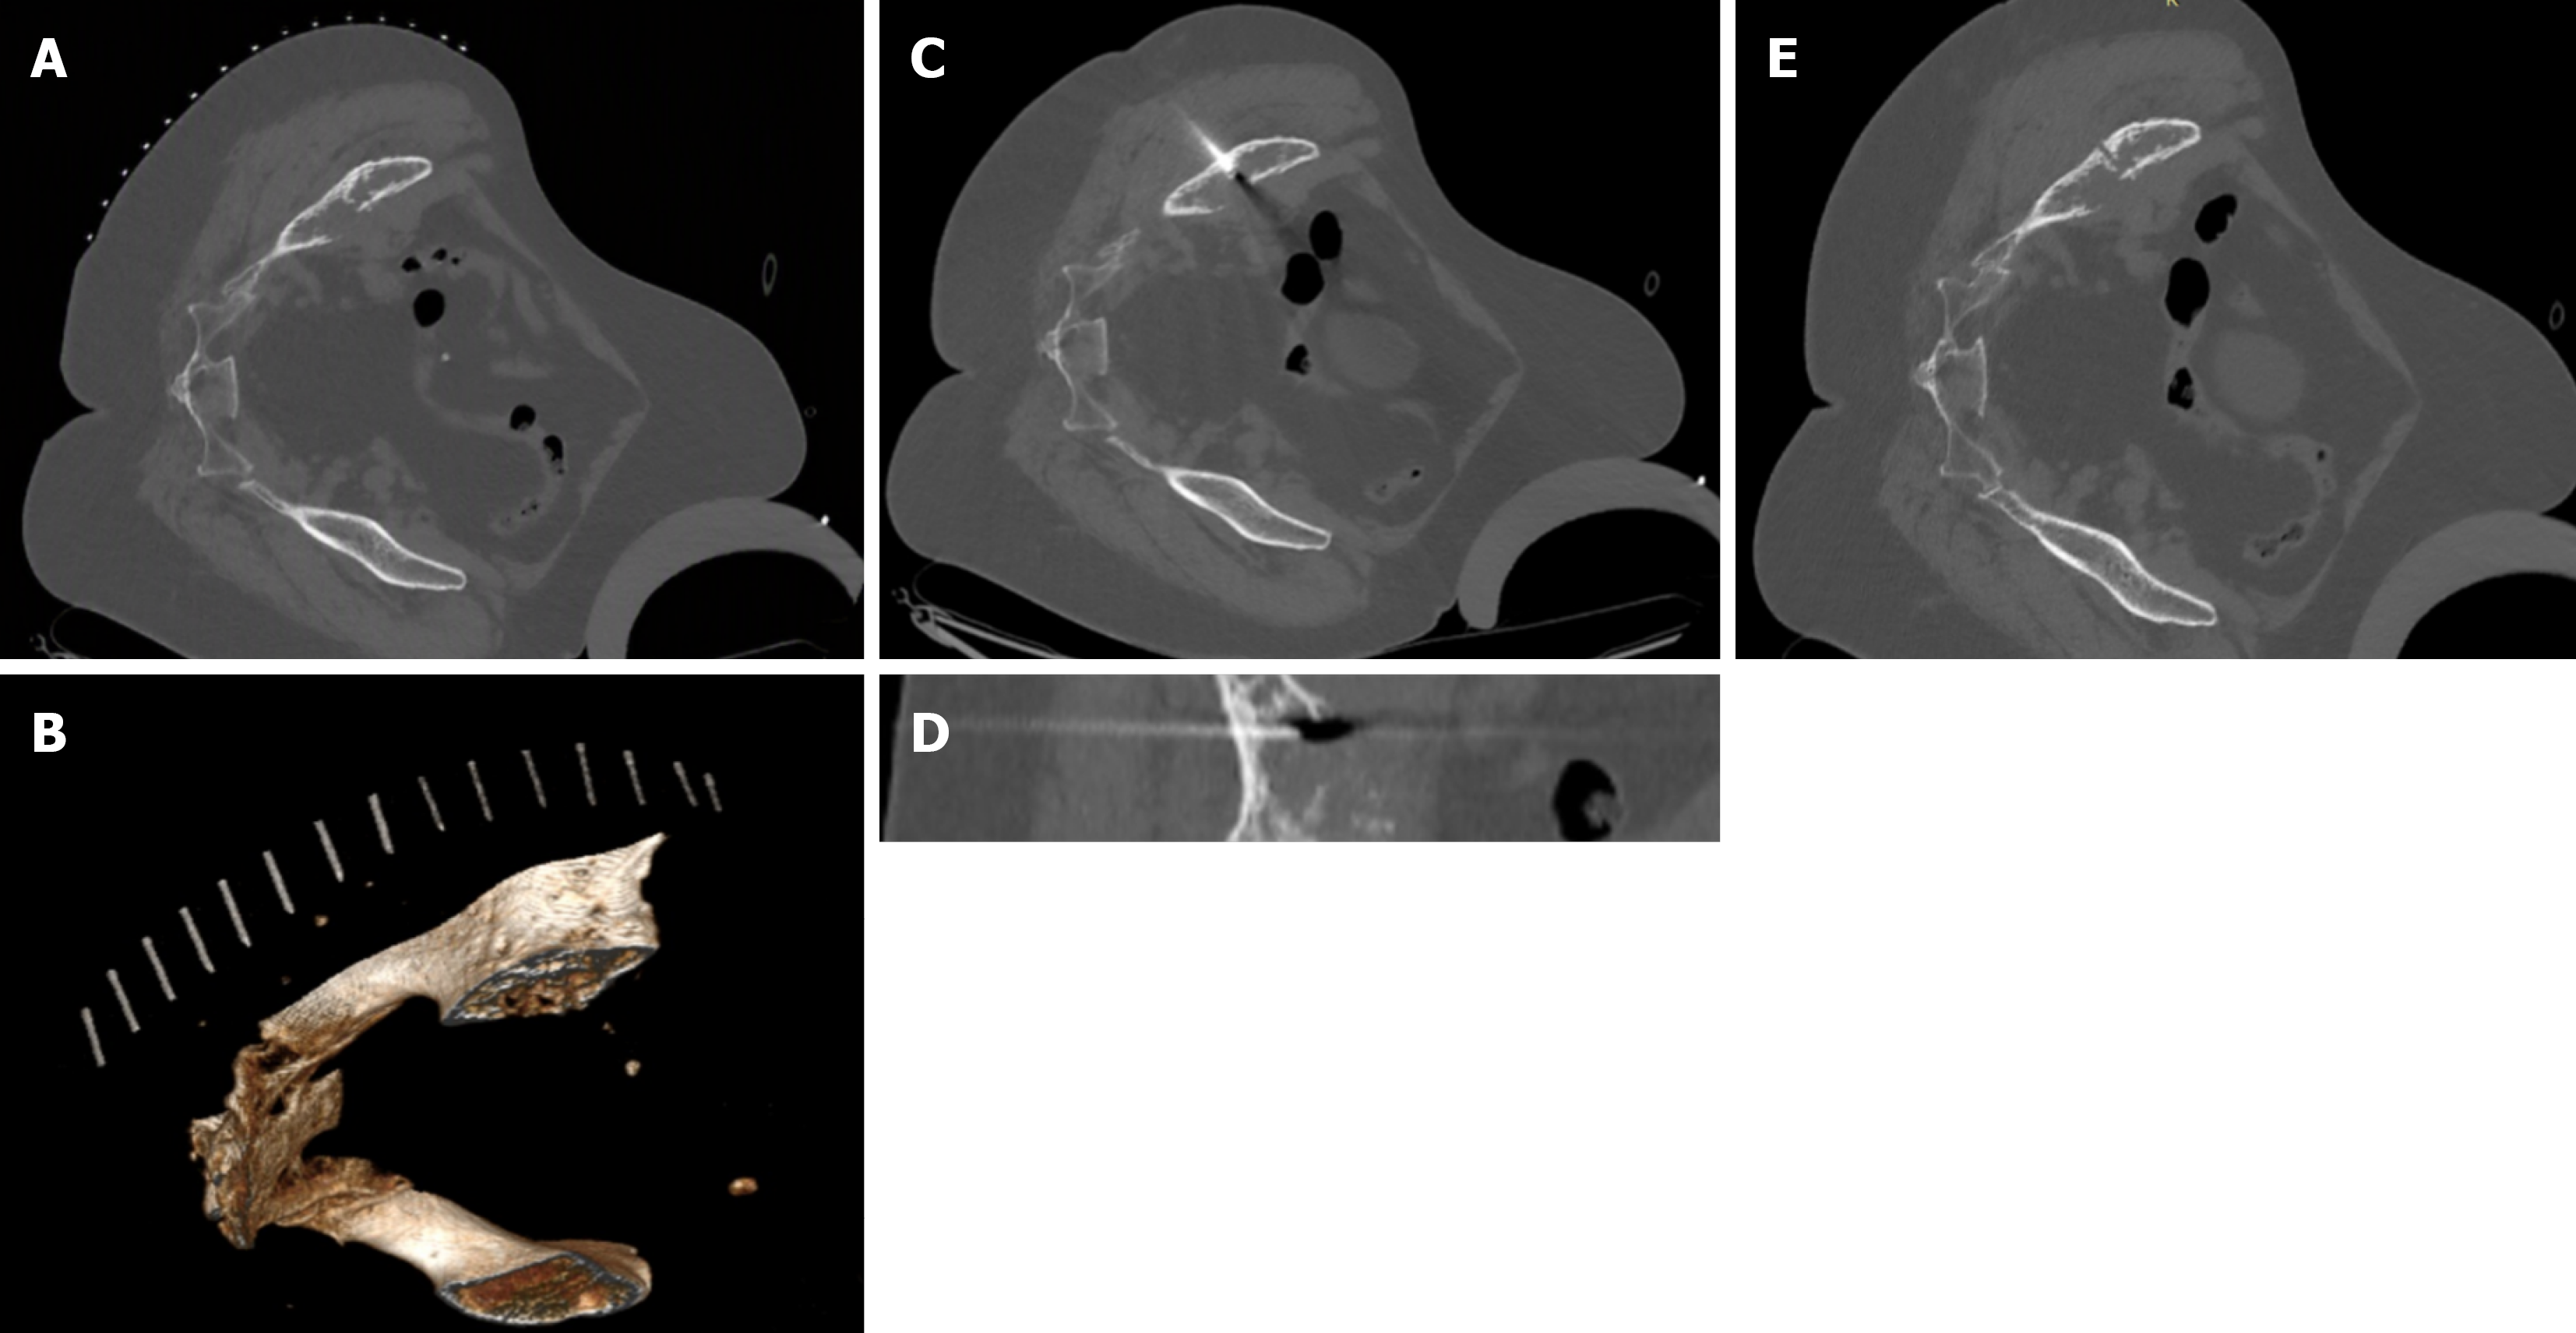
Figure 6 Computed tomography-guided needle biopsy of an osteolytic lesion.
A: Needle computed tomography (CT) scan on the horizontal line; B: Needle CT scan on the horizontal line, with three-dimensional reconstruction; C: Intralesional needle biopsy, whole CT scan view; D: Intralesional needle biopsy, zoomed-in view with needle contact; E: Control CT scan showing the complete absence of local complications
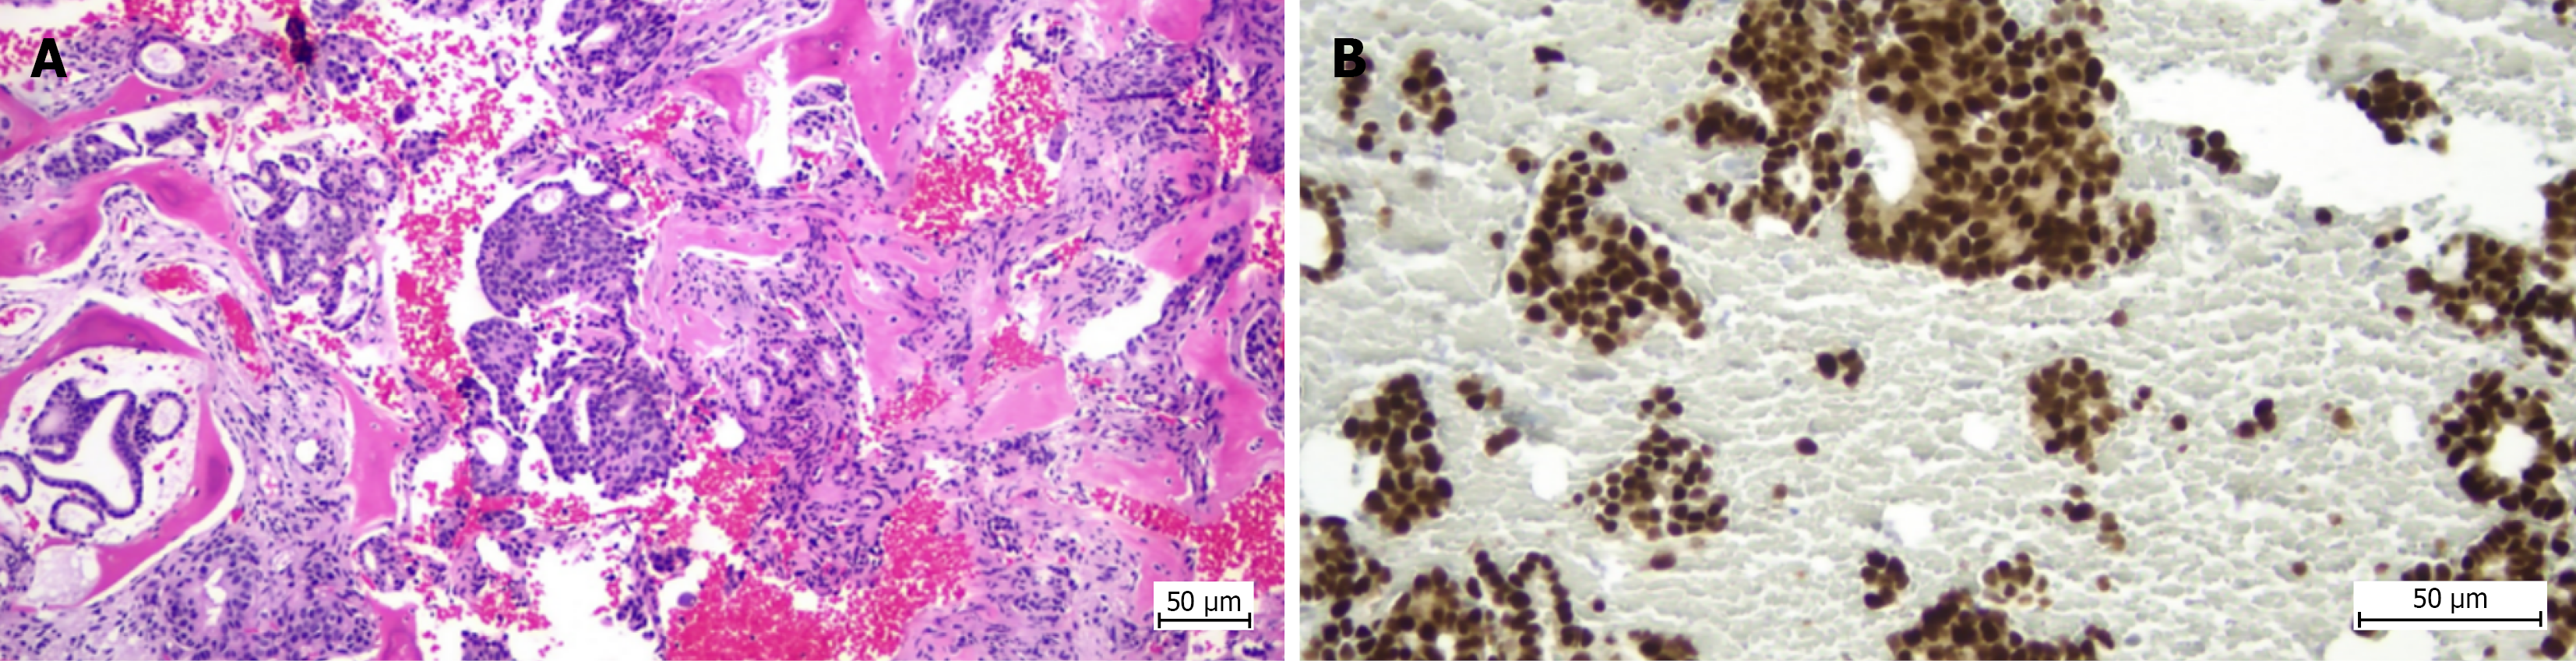
Figure 7 Histopathological and immunohistochemical appearance of the biopsy specimen in Case 2.
A: Fragments of trabecular bone tissue (black arrow) in which malignant neoplastic epithelial proliferation is identified, consisting of tubular, glandular and cribriform structures with rare solid structures (clusters, nests) and isolated cells, embedded in a desmoplastic stroma (hematoxylin and eosin staining, 100 × optical zoom); B: Estrogen receptor expression demonstrated by immunohistochemical staining, with intense and diffuse positivity in tumor cell nuclei (200 × optical zoom).
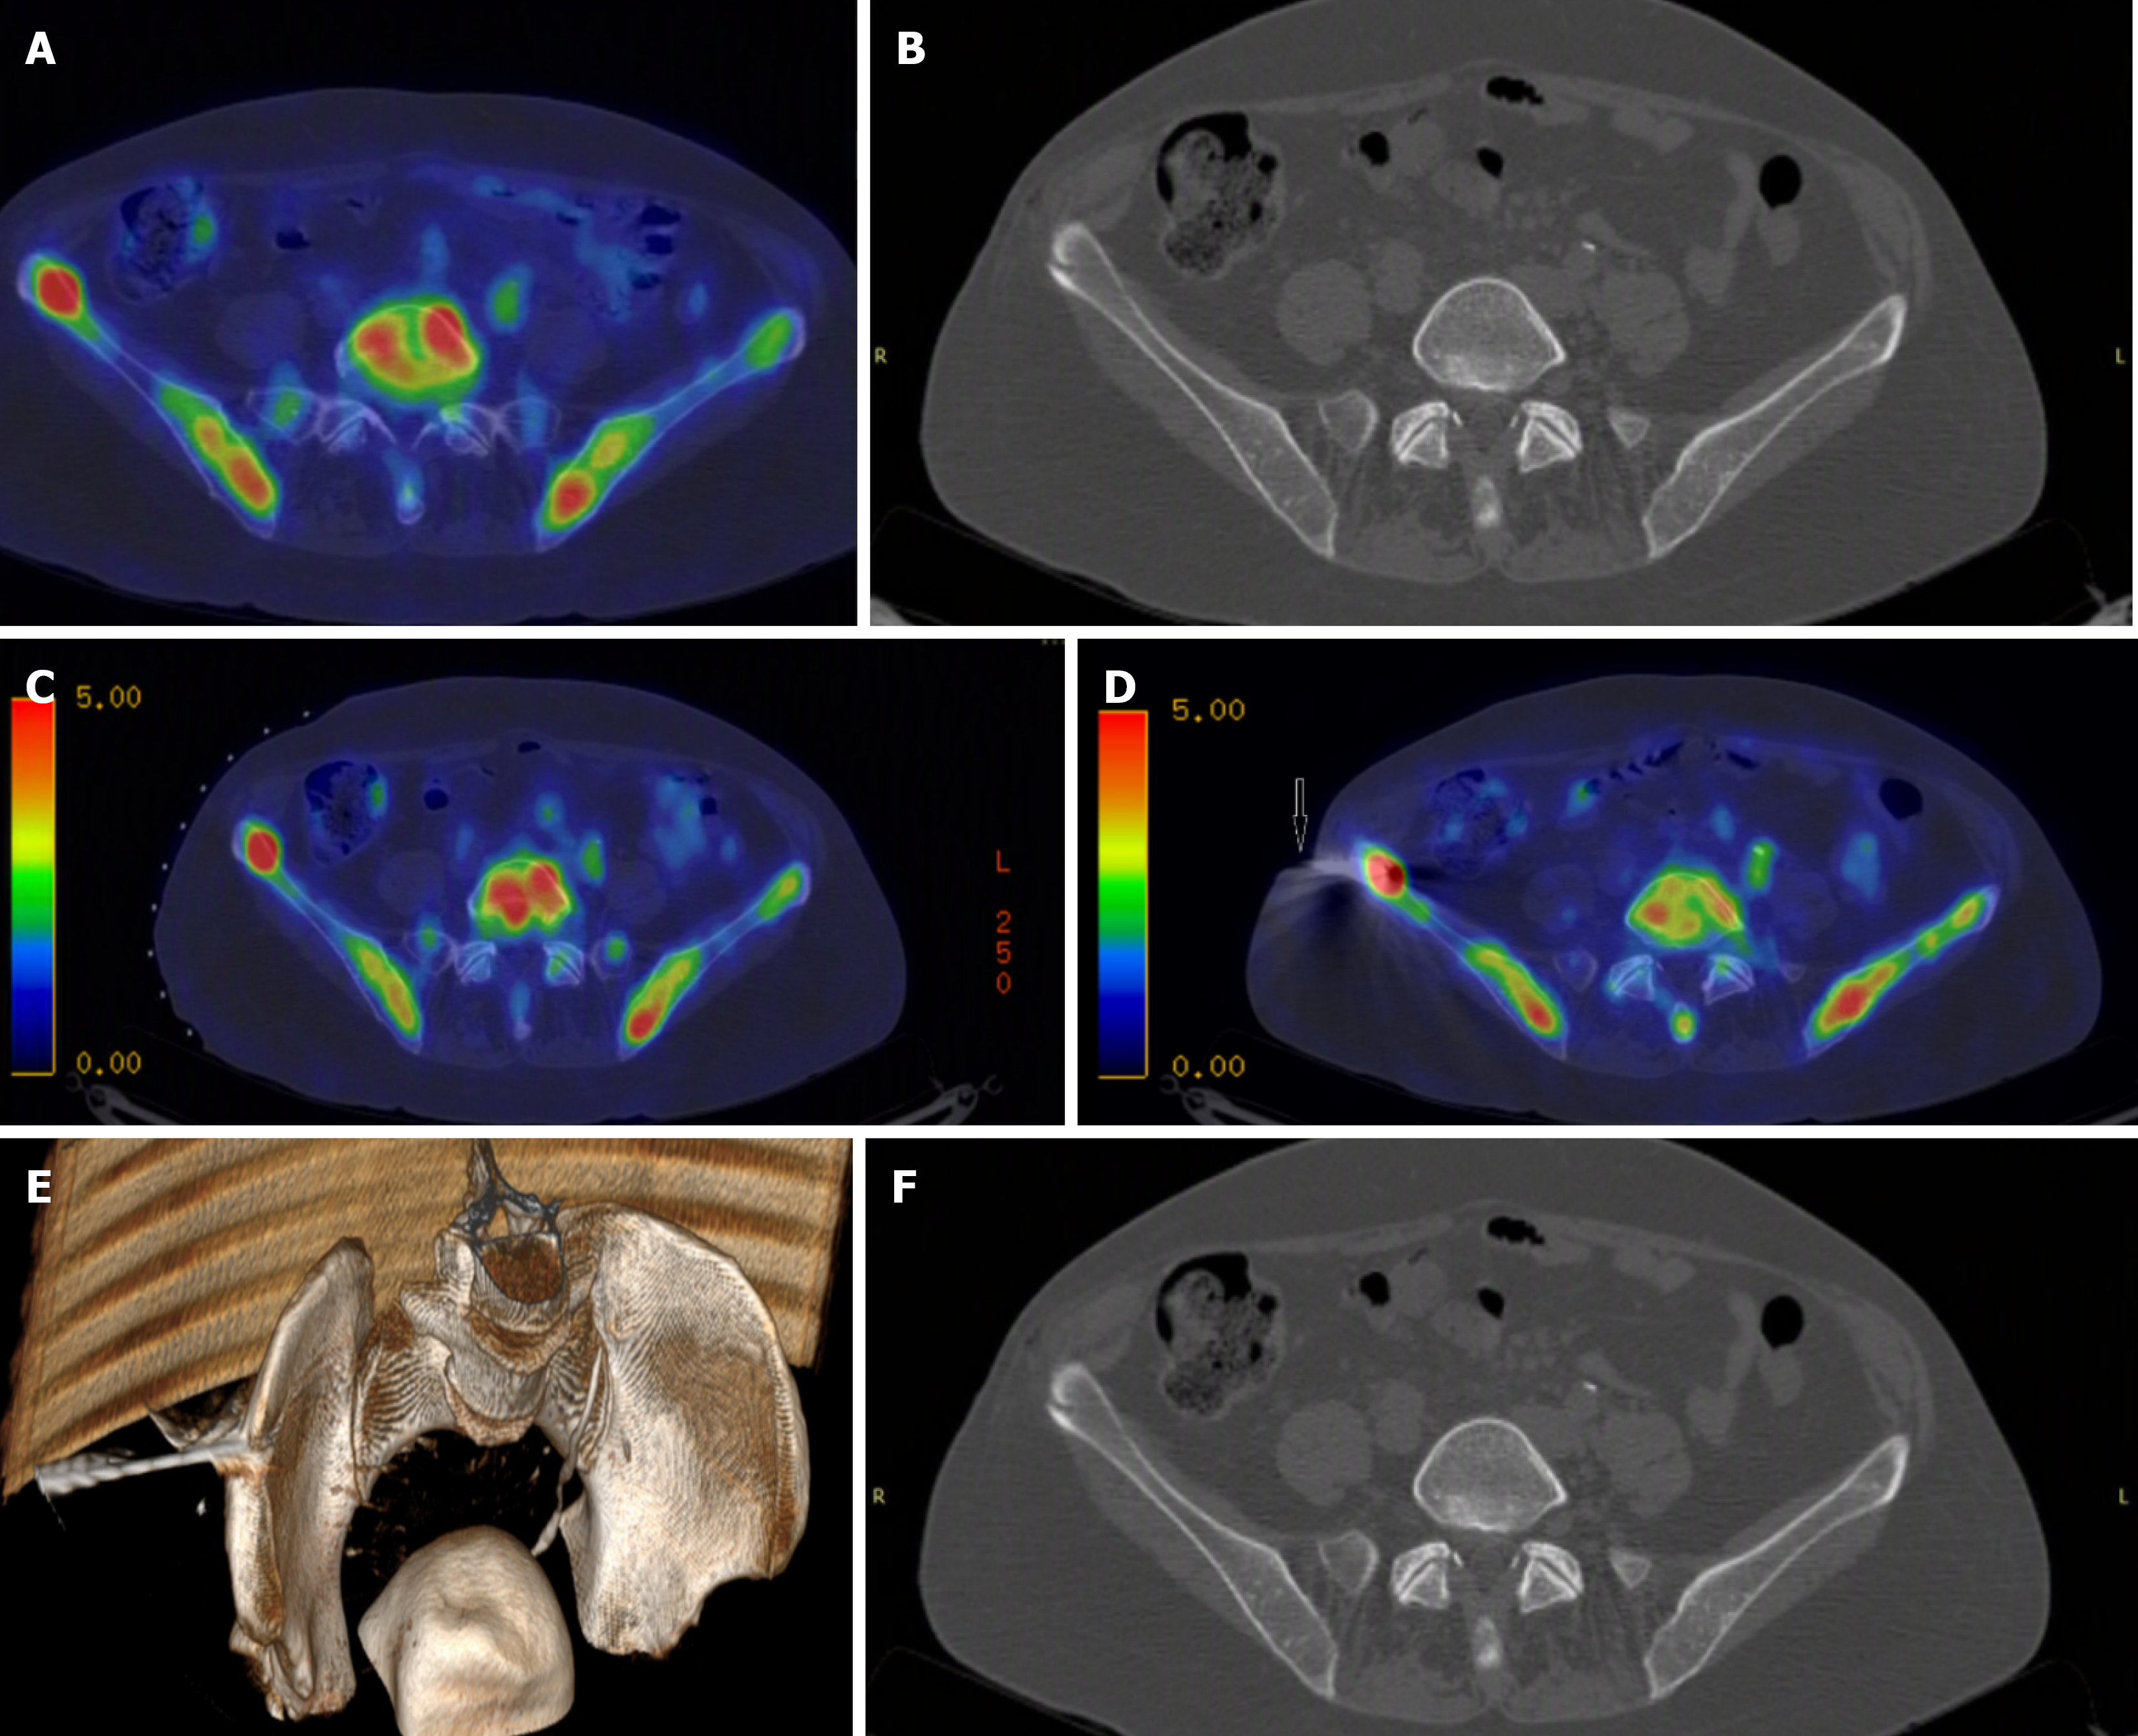
Figure 8 Positron emission tomography/computed tomography-guided needle biopsy of a metabolically active bone lesion.
A: Identification of the lesion, visible only on positron emission tomography/computed tomography (PET-CT); B: The lesion is not visible on conventional computed tomography; C: PET-CT scan with pins on the horizontal line for guidance; D: Intralesional needle biopsy under PET-CT guidance; E: Intralesional PET-CT-guided needle biopsy; F: Control scan, confirming the absence of local complications.
- Citation: Stuparu Adam AM, Osama A, Stere A, Cochior D, Pogărăşteanu ME, Moldovan CA, Tudorache IS, Adam R, Moldovan AD. Diagnostic performance of computed tomography-guided percutaneous bone biopsy in musculoskeletal oncology: A single-center cohort study. World J Radiol 2026; 18(10): 125901
- URL: https://www.wjgnet.com/1949-8470/full/v18/i10/125901.htm
- DOI: https://dx.doi.org/10.4329/wjr.125901