Copyright
©The Author(s) 2025.
World J Radiol. Sep 28, 2025; 17(9): 112983
Published online Sep 28, 2025. doi: 10.4329/wjr.v17.i9.112983
Published online Sep 28, 2025. doi: 10.4329/wjr.v17.i9.112983
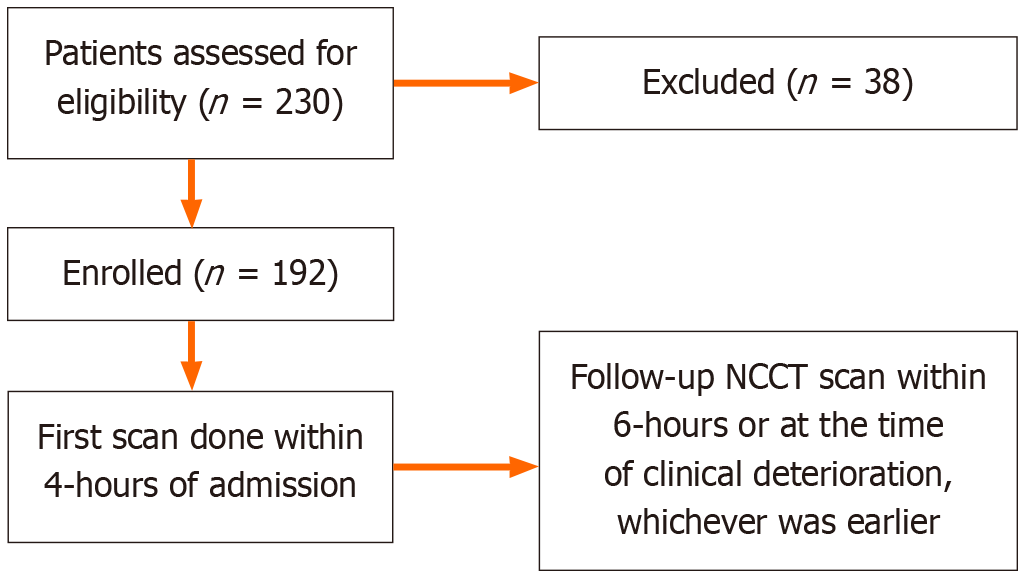
Figure 1 Flowchart depicting patient enrolment.
NCCT: Non-contrast computed tomography.
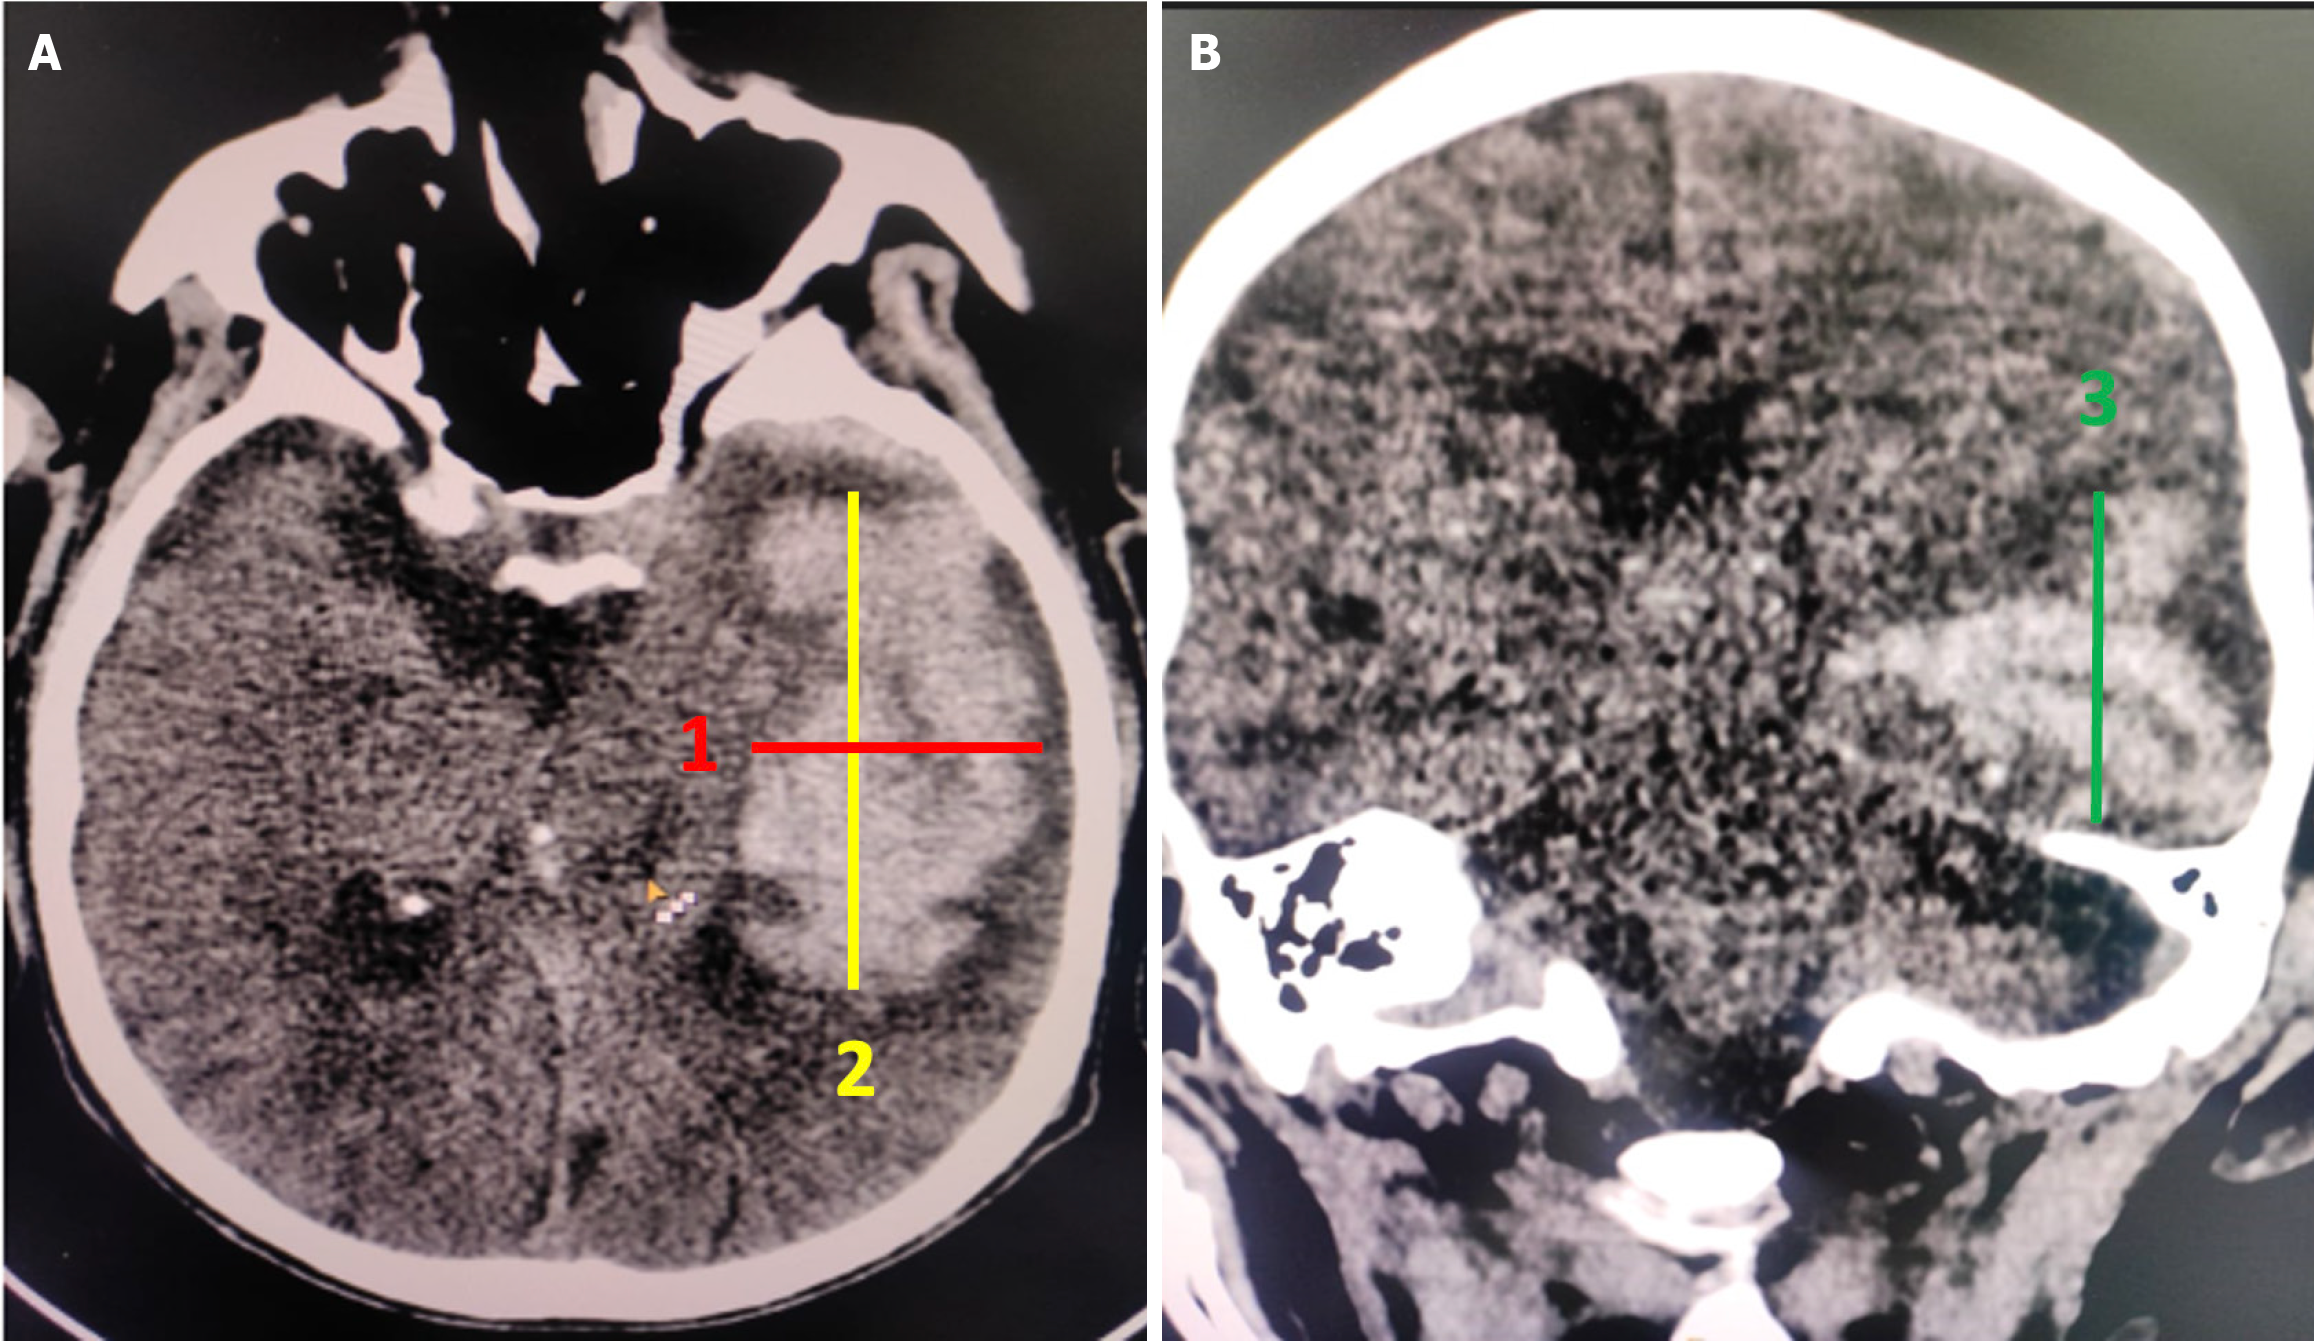
Figure 2 Calculation of volume of intracerebral hematoma on non-contrast computed tomography scan of brain using ABC/2.
A: Maximum width (red line) and maximum length (yellow line) of hematoma in cm; B: Longest cranio-caudal measurement of hematoma on the coronal section. Multiplying the three dimensions and dividing it by 2 yields the final volume in milliliters.
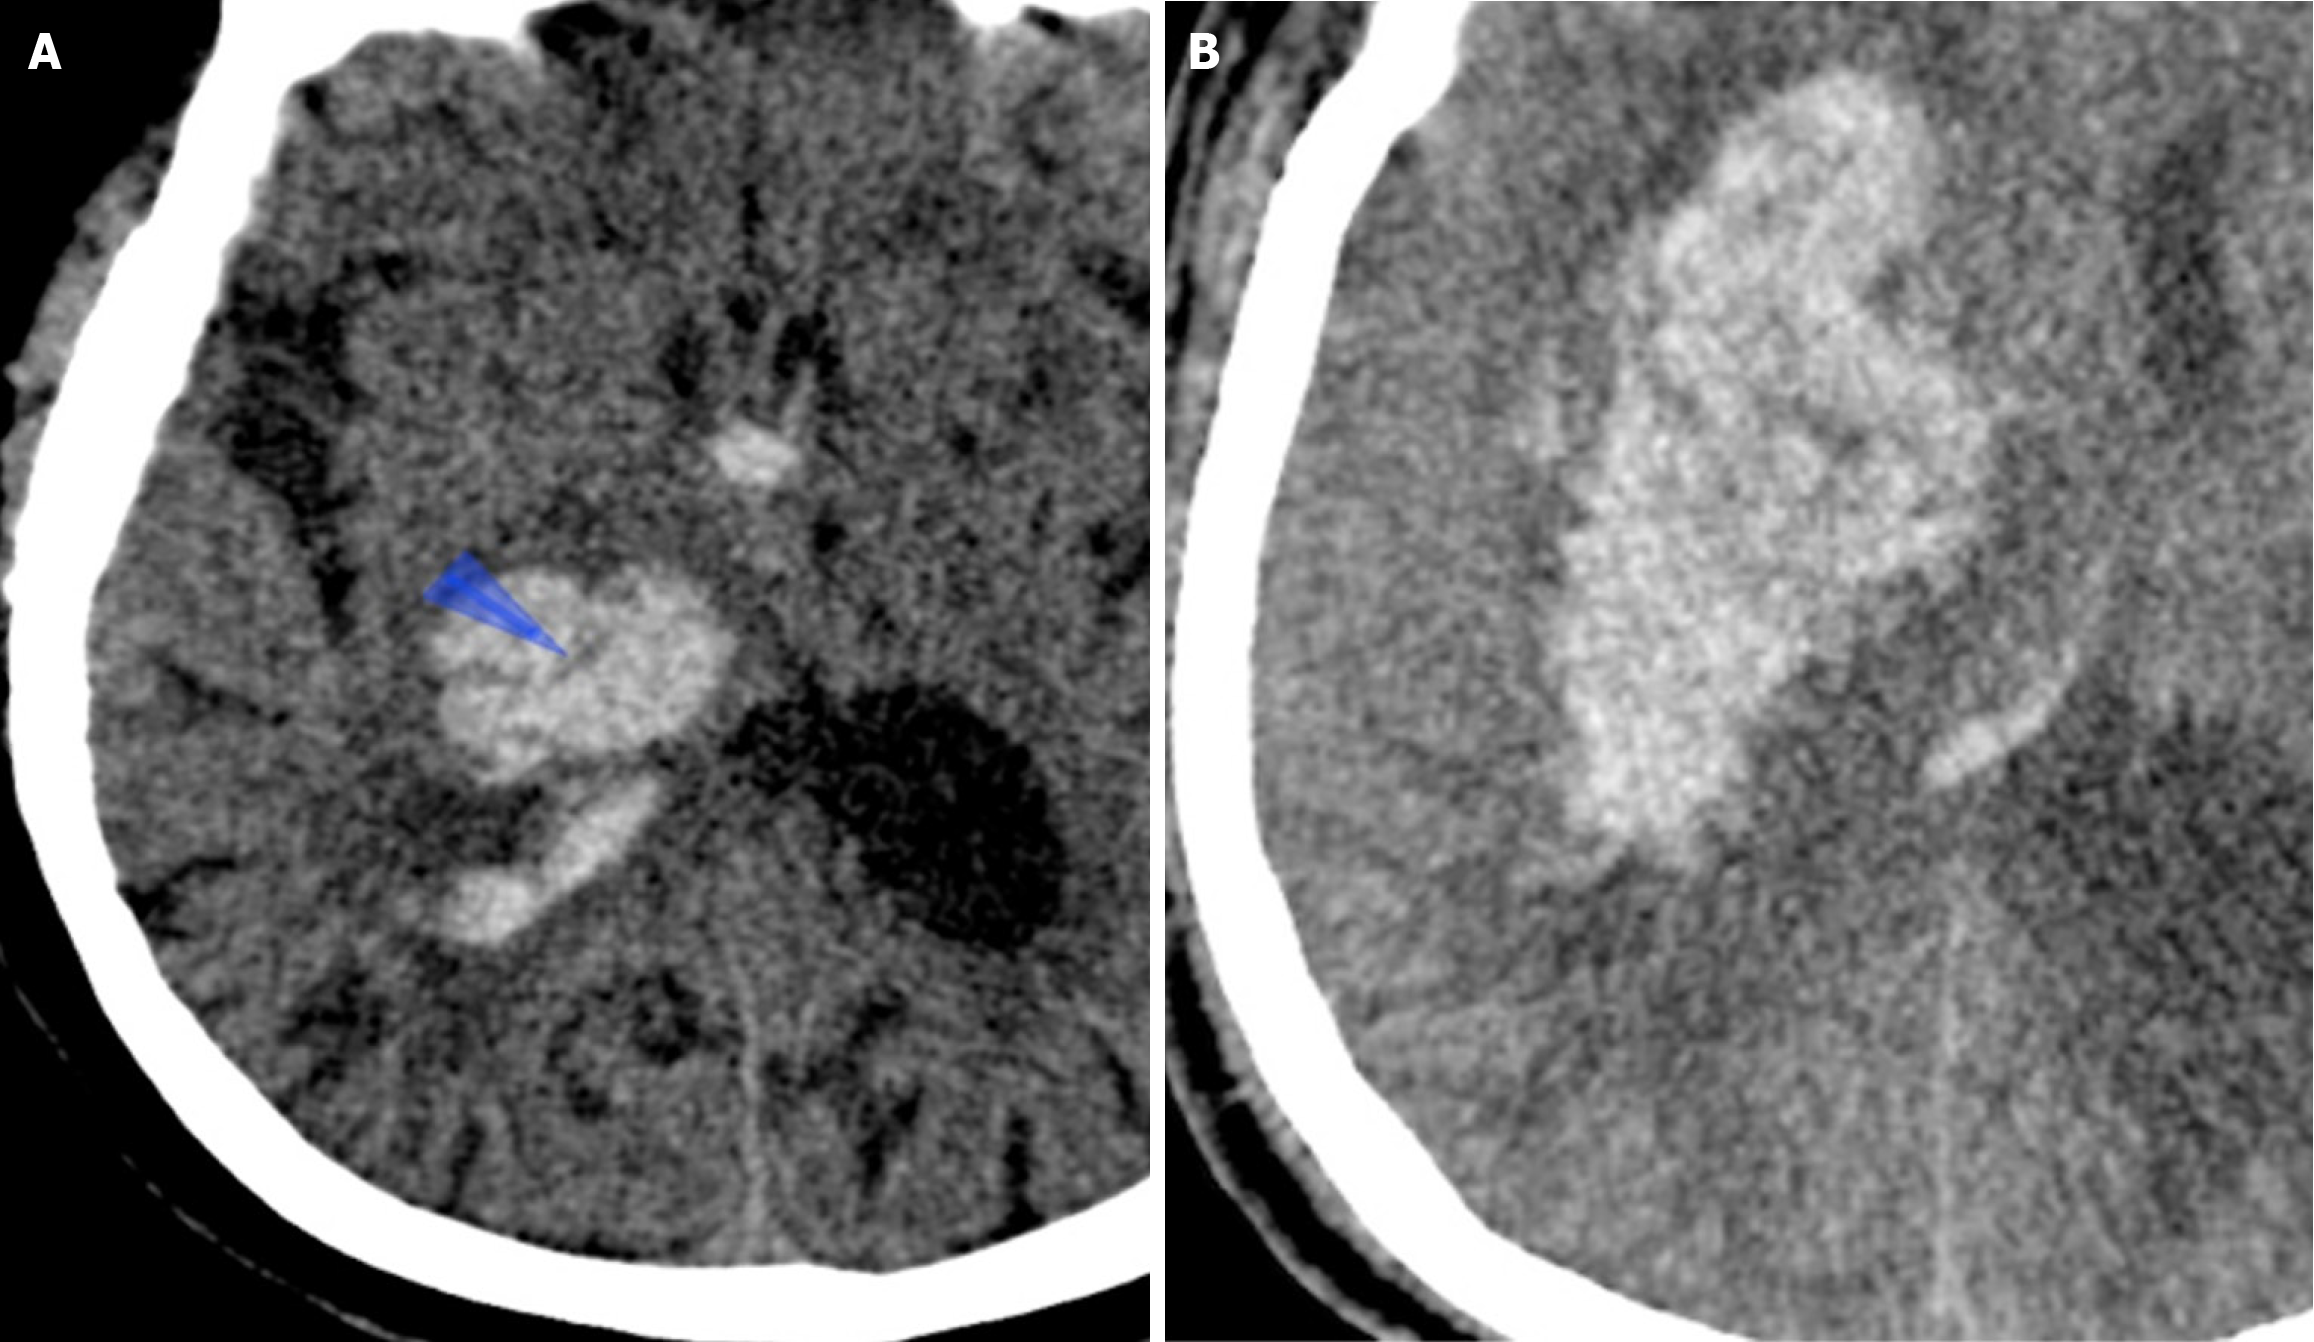
Figure 3 Swirl sign in a 59-year-old man who presented with sudden onset of left-sided weakness.
A: Axial non-contrast computed tomography (NCCT) image performed 1.5 hours after hospital admission showed a right basal ganglia bleed with a swirl sign and intraventricular hemorrhage (blue arrowhead); B: Follow-up NCCT 6-hours later showed a significant hematoma expansion.
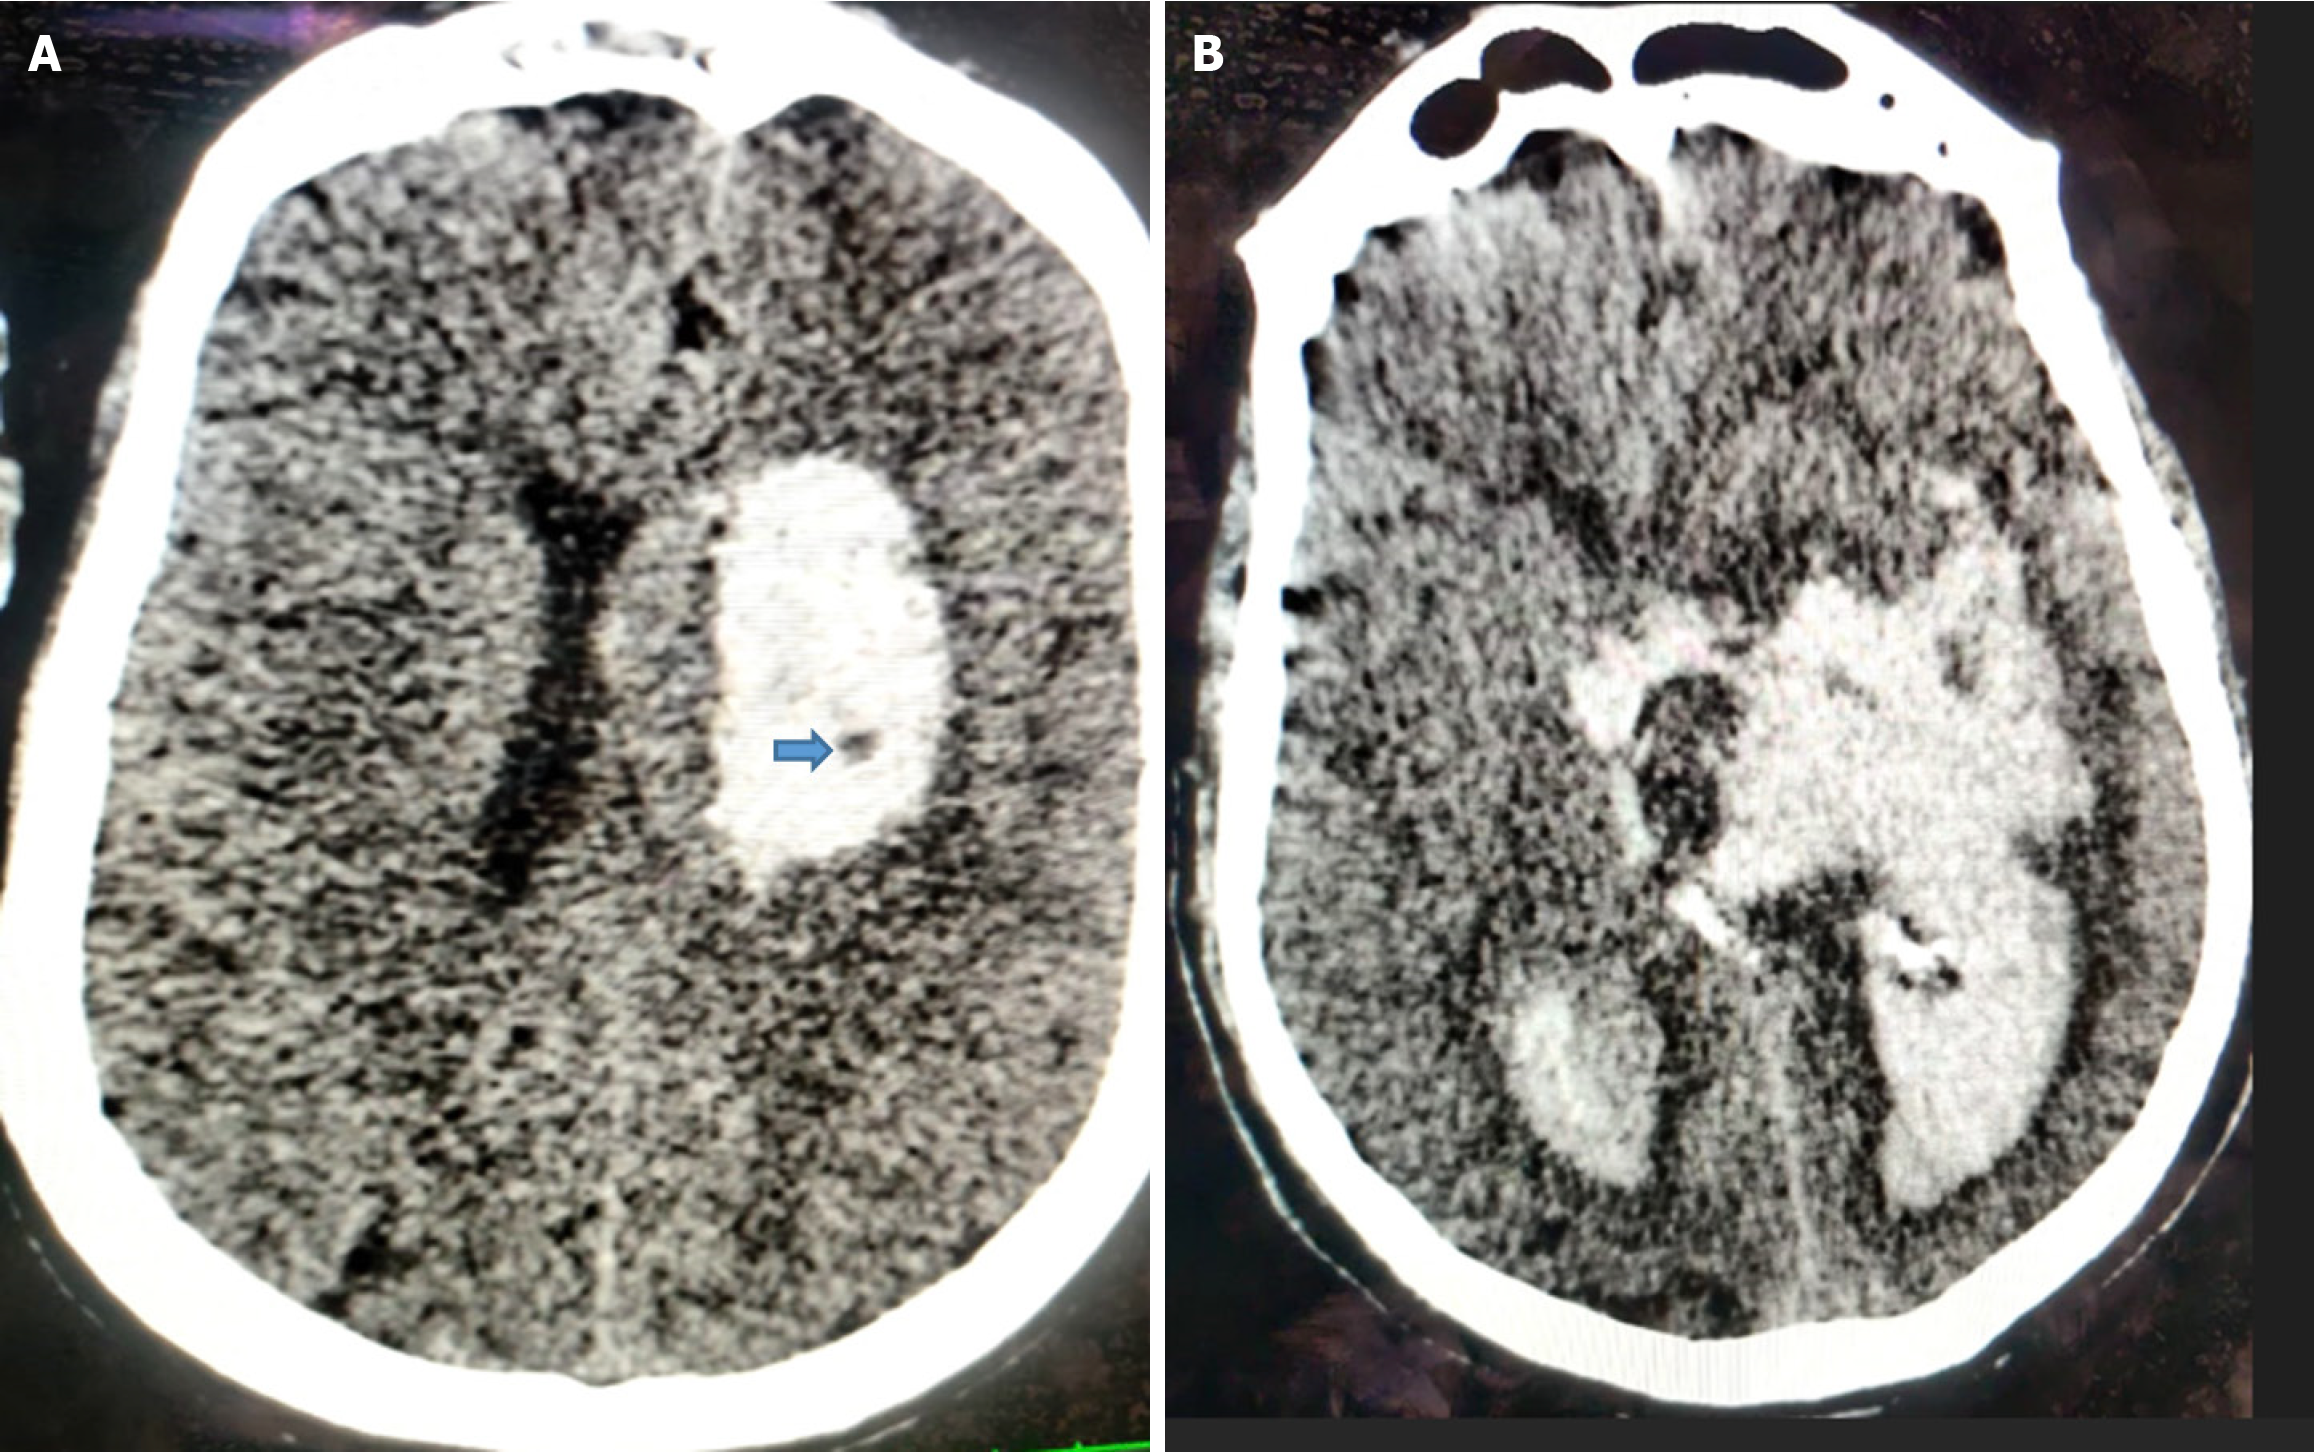
Figure 4 Black hole sign in 68-year-old woman who presented with sudden onset of aphasia and right-sided weakness.
A: Axial non-contrast computed tomography (NCCT) image performed 3-hours after hospital admission showed left basal ganglia hematoma with a black hole sign (blue arrow); B: Follow-up NCCT 6-hours later showed a significant hematoma expansion with intra-ventricular extension.
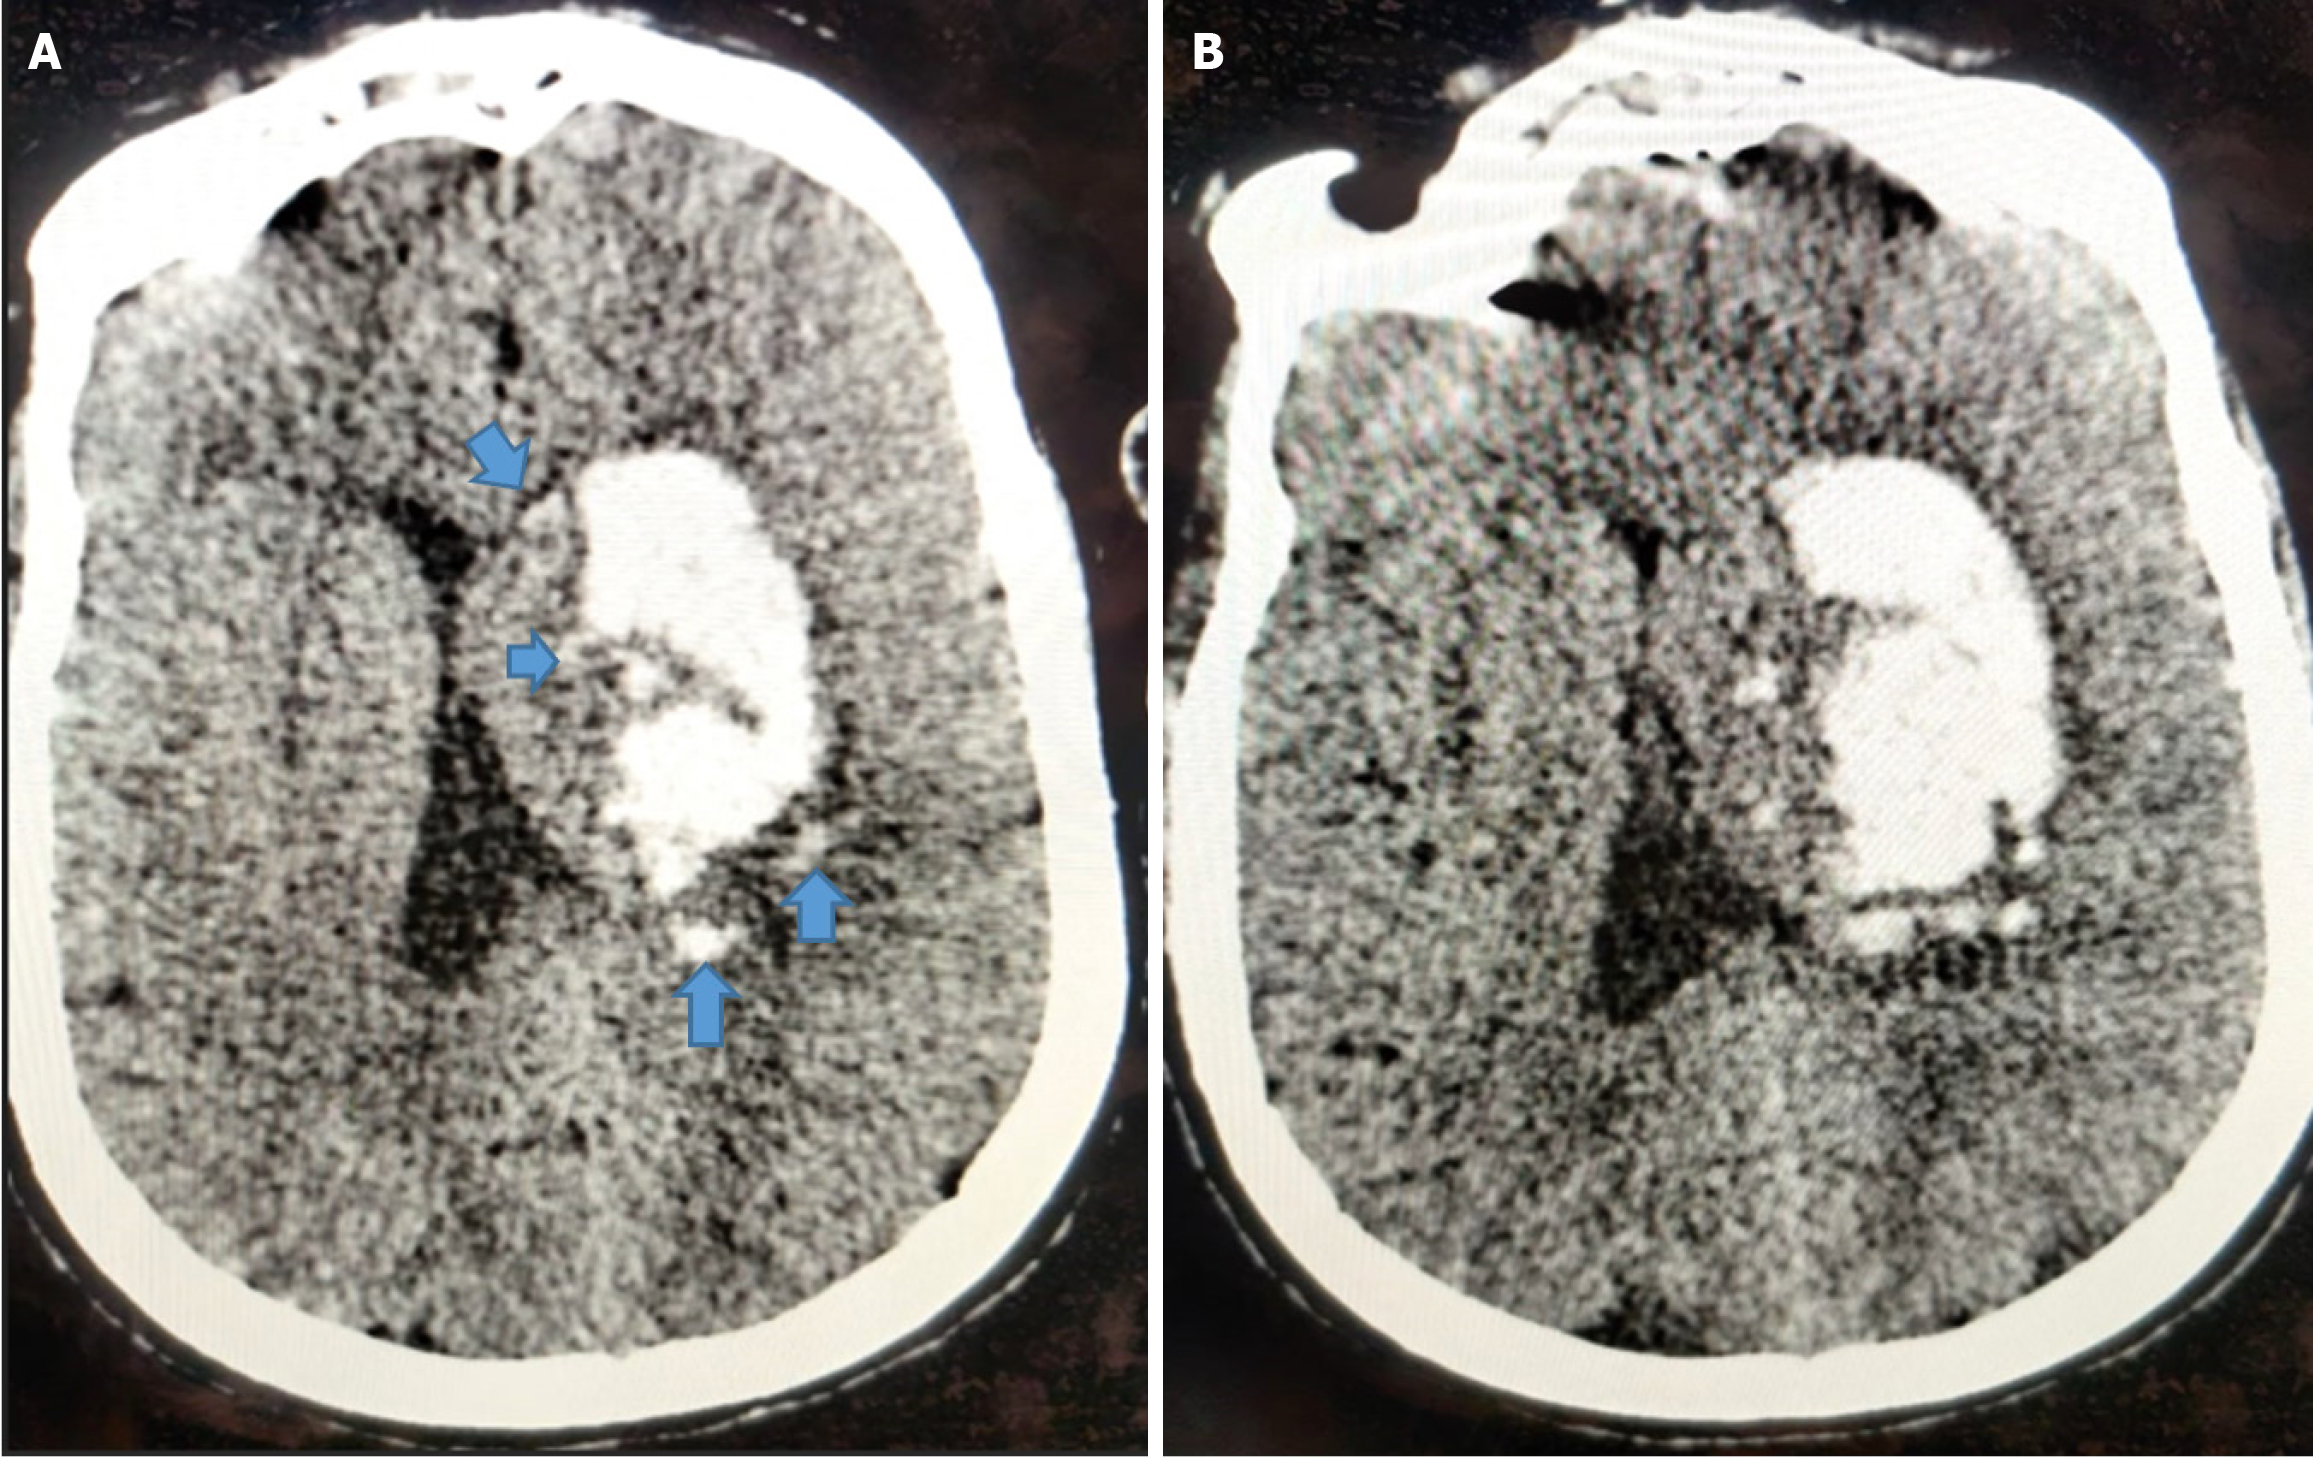
Figure 5 Island sign in a 66-year-old man who presented with sudden onset of right-sided weakness.
A: Non-contrast computed tomography (CT) image done 3-hours after symptom onset reveals acute hematoma in left basal ganglia hematoma with an island sign (blue arrows); B: Follow-up CT scan performed 3-hours after first CT demonstrated significant hematoma growth.
- Citation: Parry AH, Fatima SA, Wani M, Jehangir M, Farooq O, Wagay MI, Ashraf O, Hakeem AA. Predicting hematoma growth in spontaneous intracerebral hemorrhage: A simplified non-contrast computed tomography based five-point grading approach. World J Radiol 2025; 17(9): 112983
- URL: https://www.wjgnet.com/1949-8470/full/v17/i9/112983.htm
- DOI: https://dx.doi.org/10.4329/wjr.v17.i9.112983


