Copyright
©The Author(s) 2025.
World J Radiol. Jul 28, 2025; 17(7): 110394
Published online Jul 28, 2025. doi: 10.4329/wjr.v17.i7.110394
Published online Jul 28, 2025. doi: 10.4329/wjr.v17.i7.110394
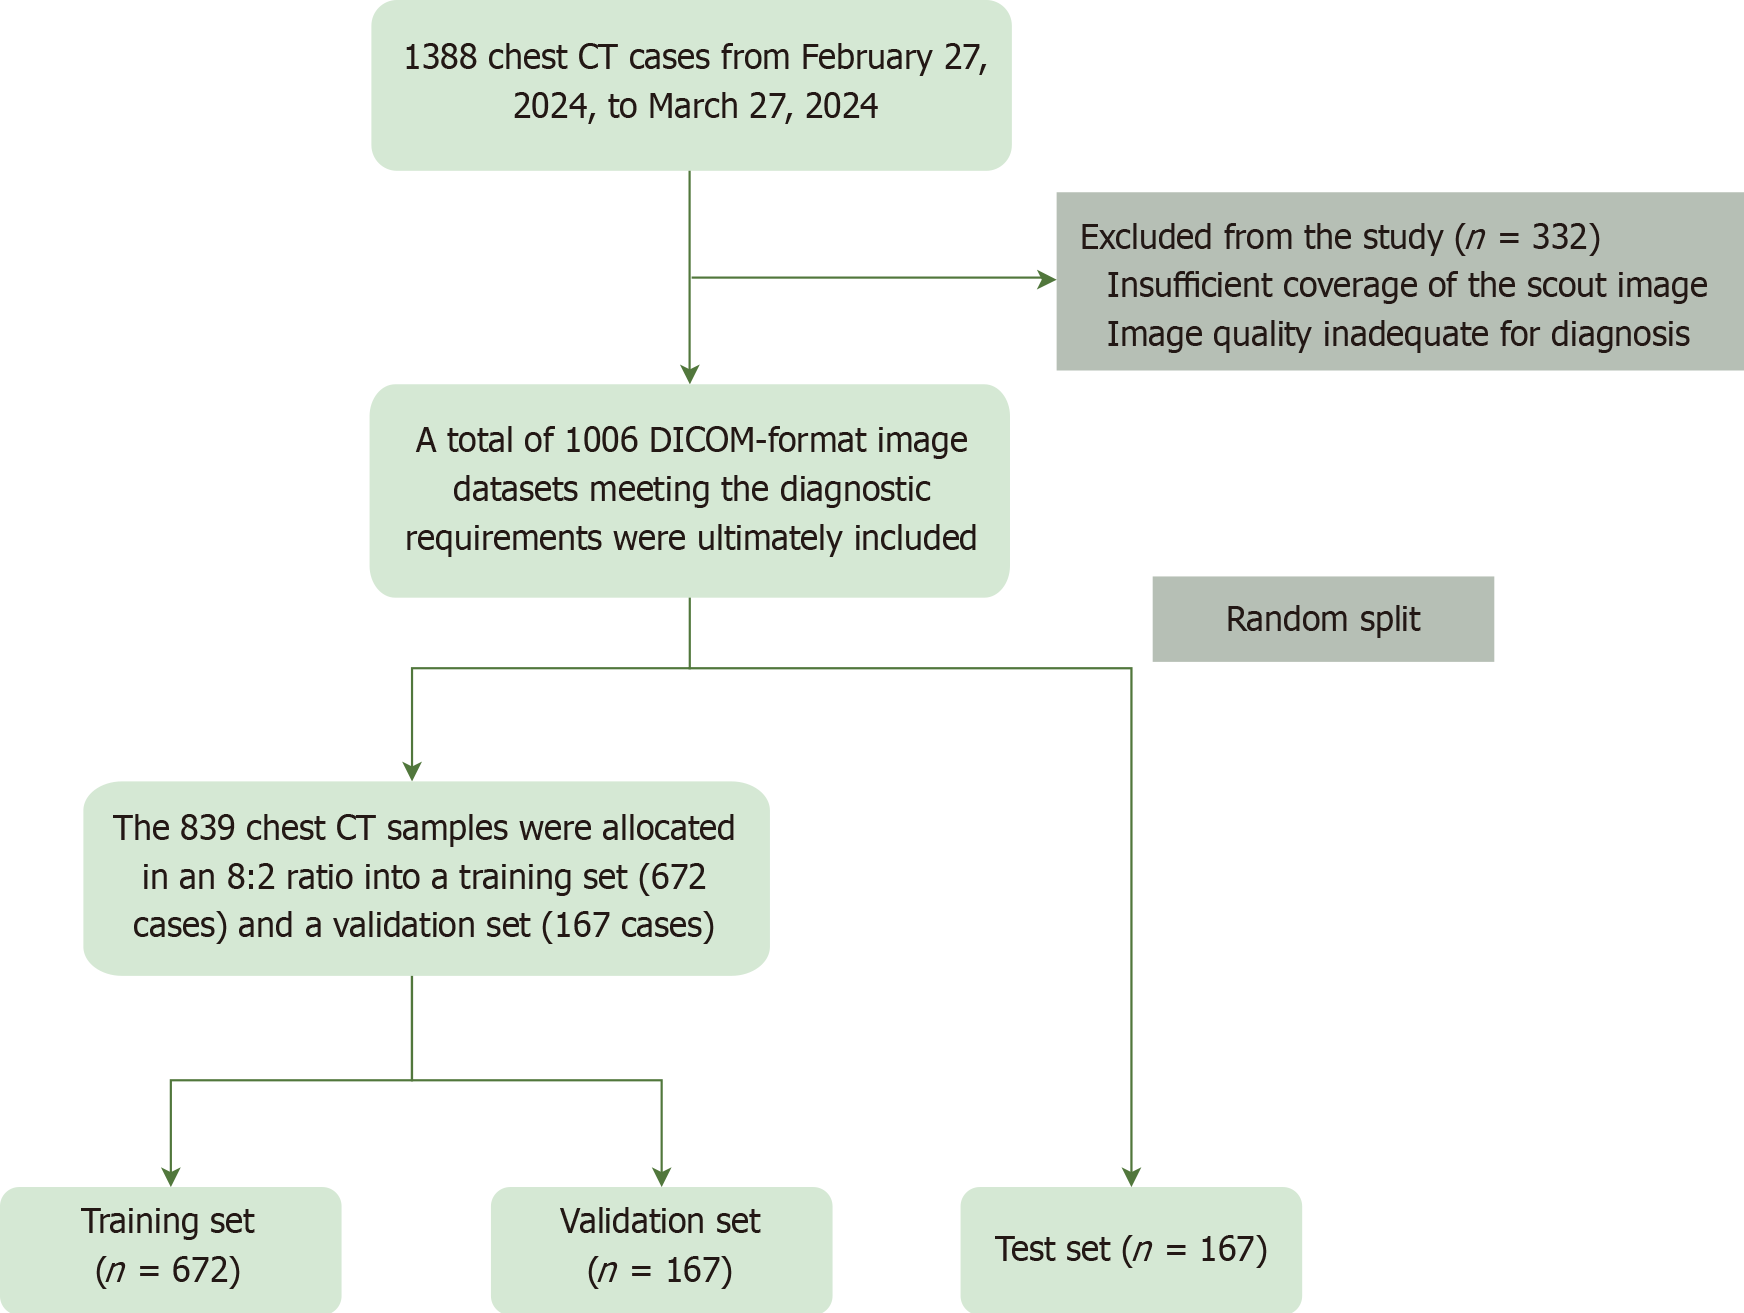
Figure 1 Flowchart of patient imaging data inclusion and dataset splitting process.
CT: Computed tomography; DICOM: Digital imaging and communications in medicine.
Figure 2 Data preprocessing and image augmentation.
A: Rotation angle (degrees: 5.0); B: Horizontal Flip Probability (fliplr: 0.1).
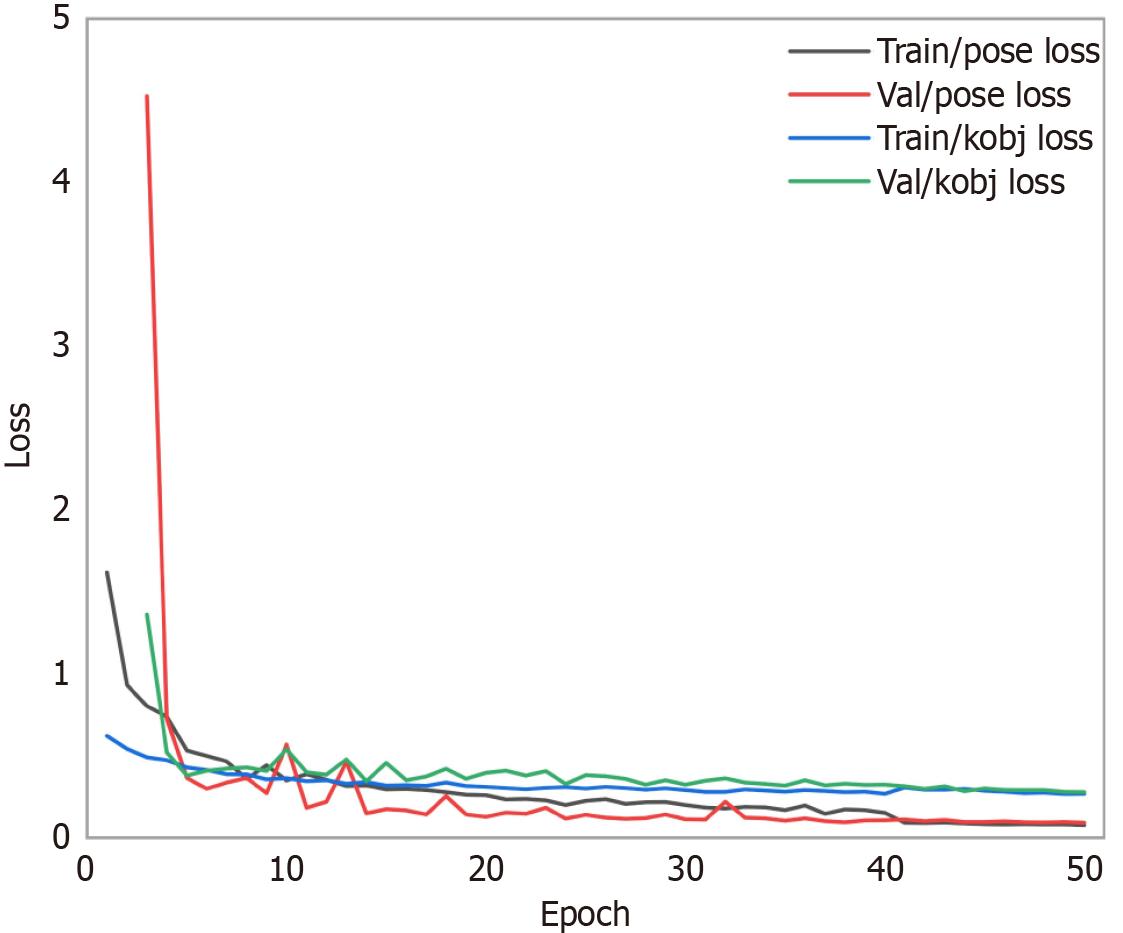
Figure 3
Training and validation loss curves for pose and kobj metrics across epochs.
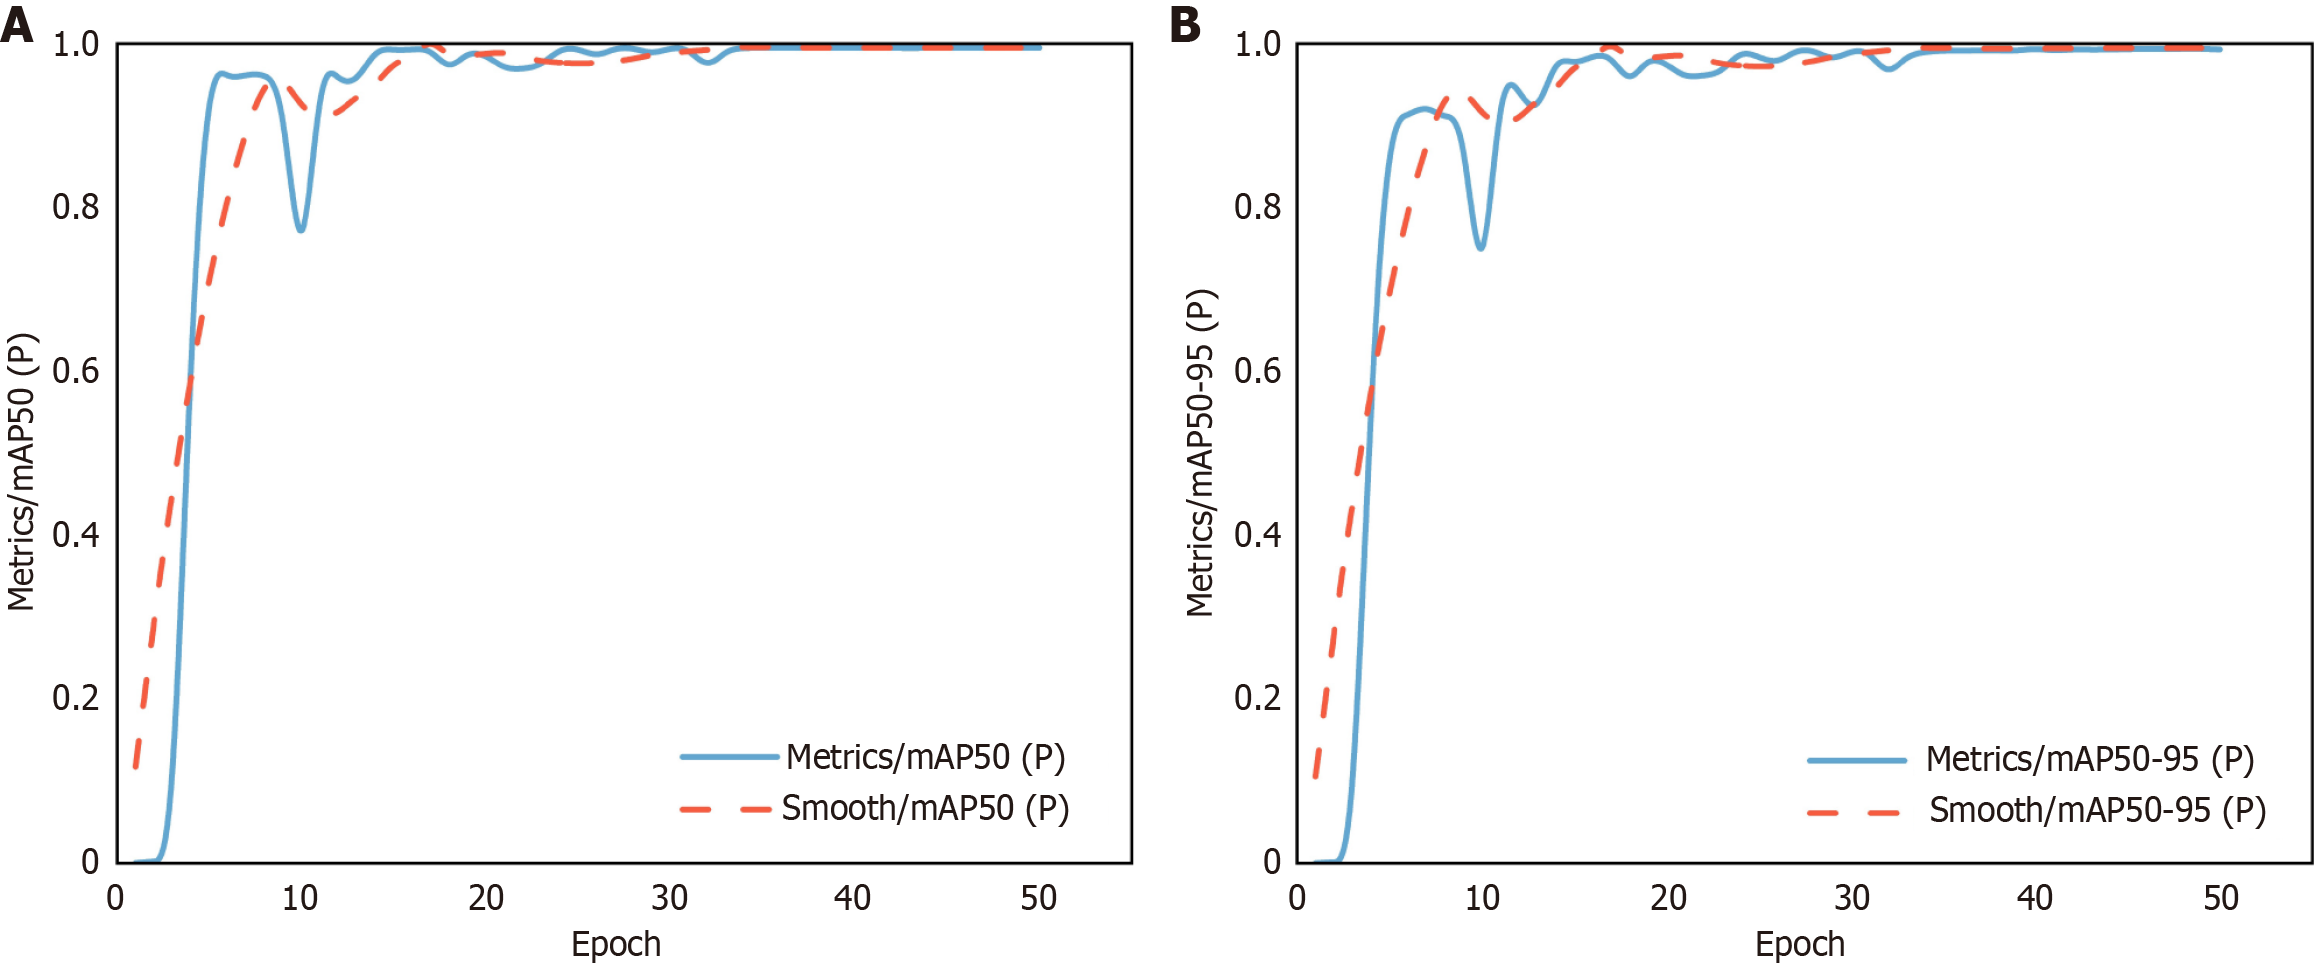
Figure 4 Trend during training.
A: MAP50(P); B: MAP50-95(P).
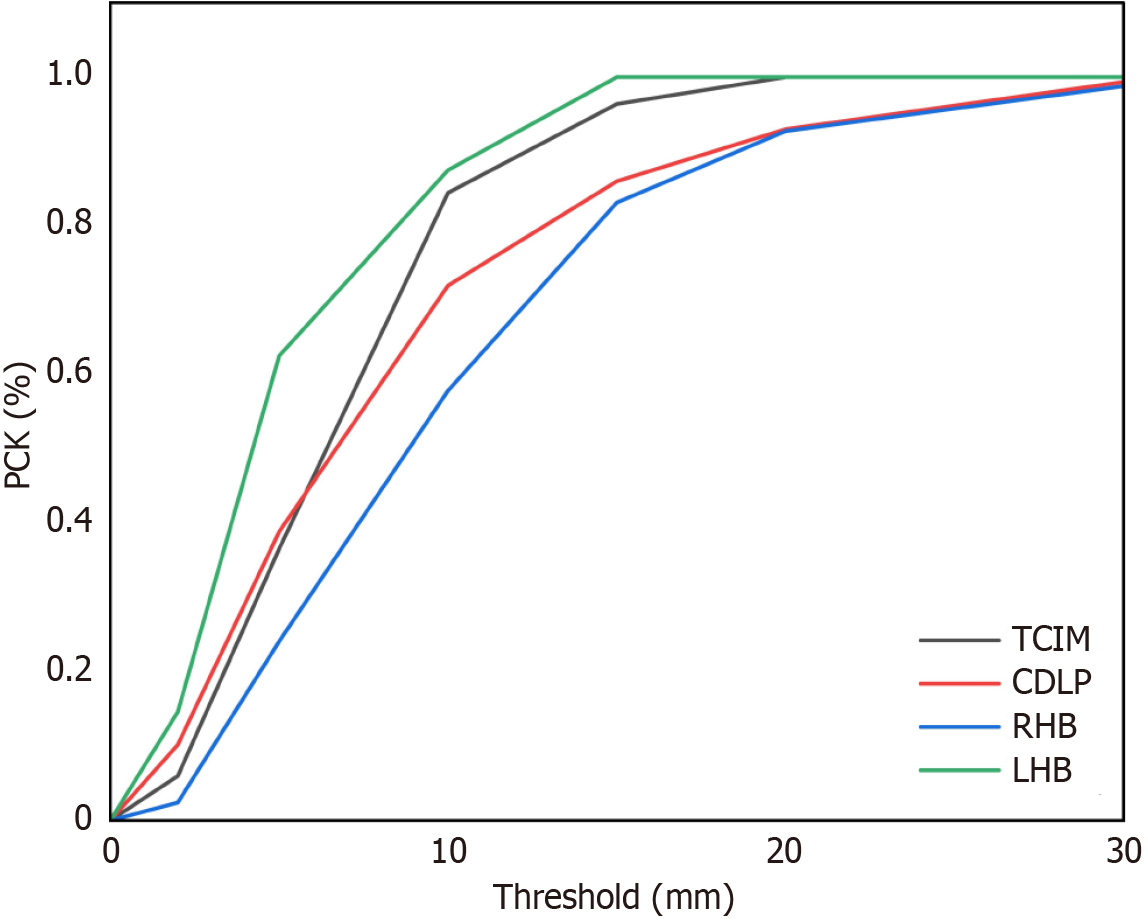
Figure 5 Evaluation of percentage of correct keypoints performance under varying thresholds.
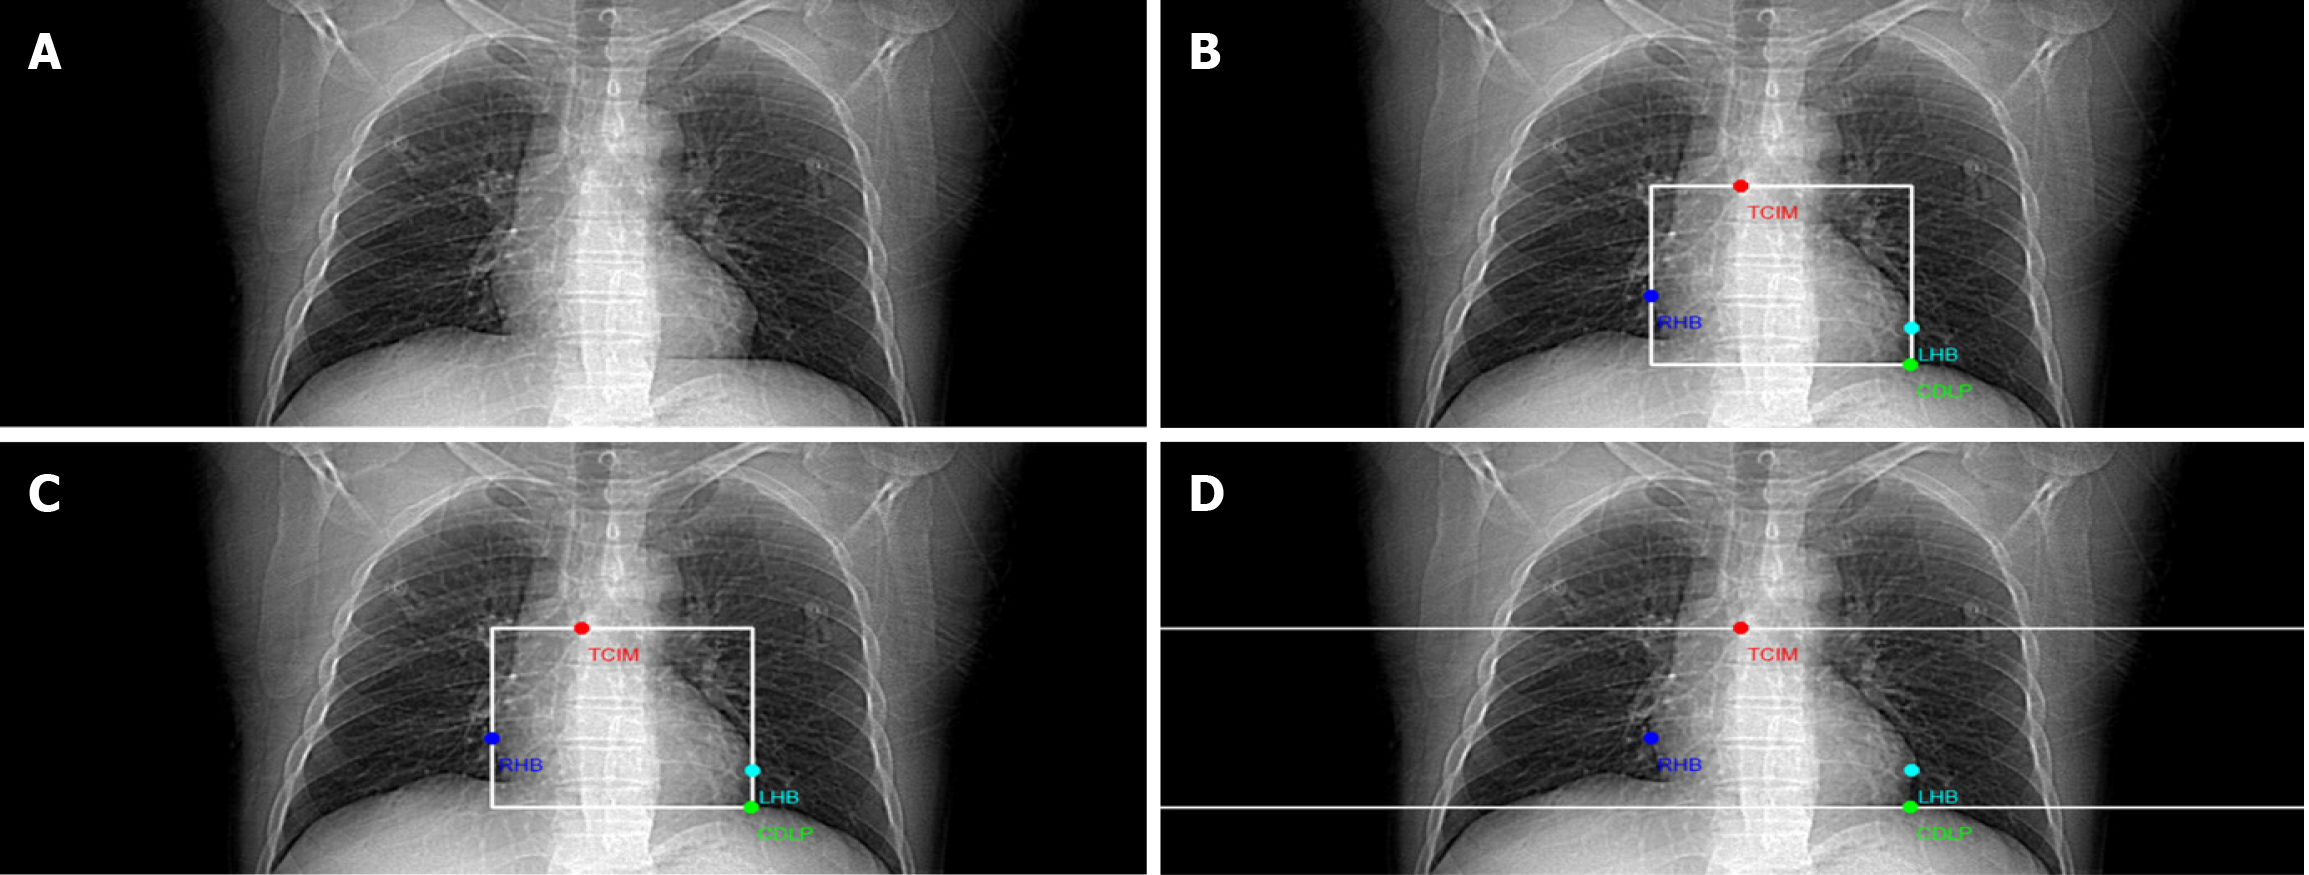
TCIM: Tracheal carina inferior margin; CDLP: Cardiac diaphragmatic lowest point; RHB: Right heart border; LHB: Left heart border.
Figure 6 Scan range for coronary computed tomography angiography.
A: Original image; B: Scan range predicted by the model itself; C: Scan range recommended by the Chinese Medical Association Radiology Society Cardiac-Chest Group; D: Society of Cardiovascular Computed Tomography recommendation. TCIM: Tracheal carina inferior margin; CDLP: Cardiac diaphragmatic lowest point; RHB: Right heart border; LHB: Left heart border.
- Citation: Zhao YH, Fan YH, Wu XY, Qin T, Sun QT, Liang BH. Determining the scanning range of coronary computed tomography angiography based on deep learning. World J Radiol 2025; 17(7): 110394
- URL: https://www.wjgnet.com/1949-8470/full/v17/i7/110394.htm
- DOI: https://dx.doi.org/10.4329/wjr.v17.i7.110394


