©The Author(s) 2024.
World J Radiol. Dec 28, 2024; 16(12): 760-770
Published online Dec 28, 2024. doi: 10.4329/wjr.v16.i12.760
Published online Dec 28, 2024. doi: 10.4329/wjr.v16.i12.760
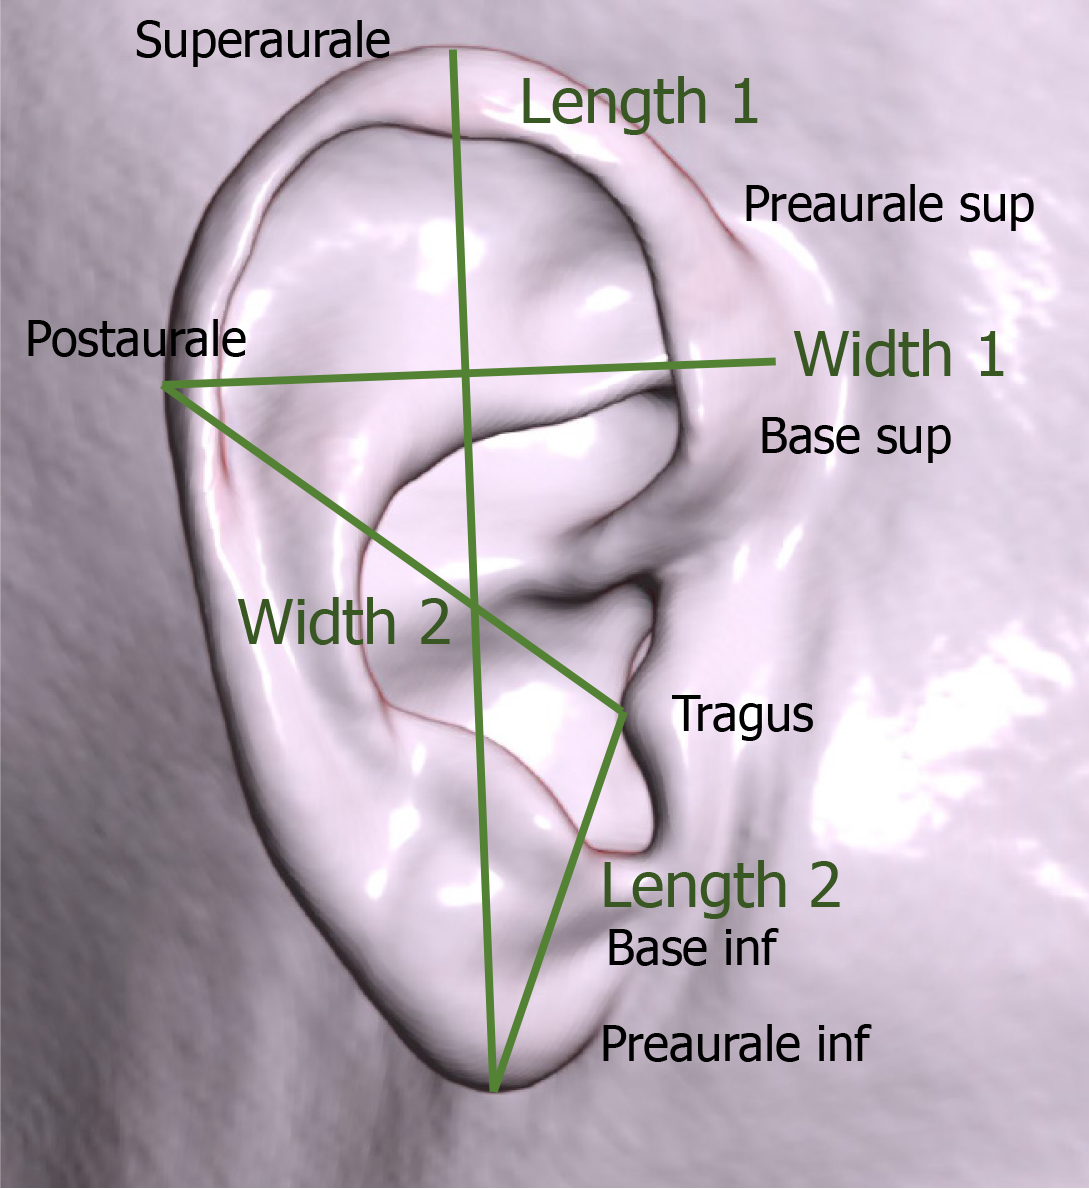
Figure 1 Example of predefined landmarks and resulting measurements visualized in a volume rendering image of the right ear.
For the sake of clarity, the representation of the perimeter was omitted.
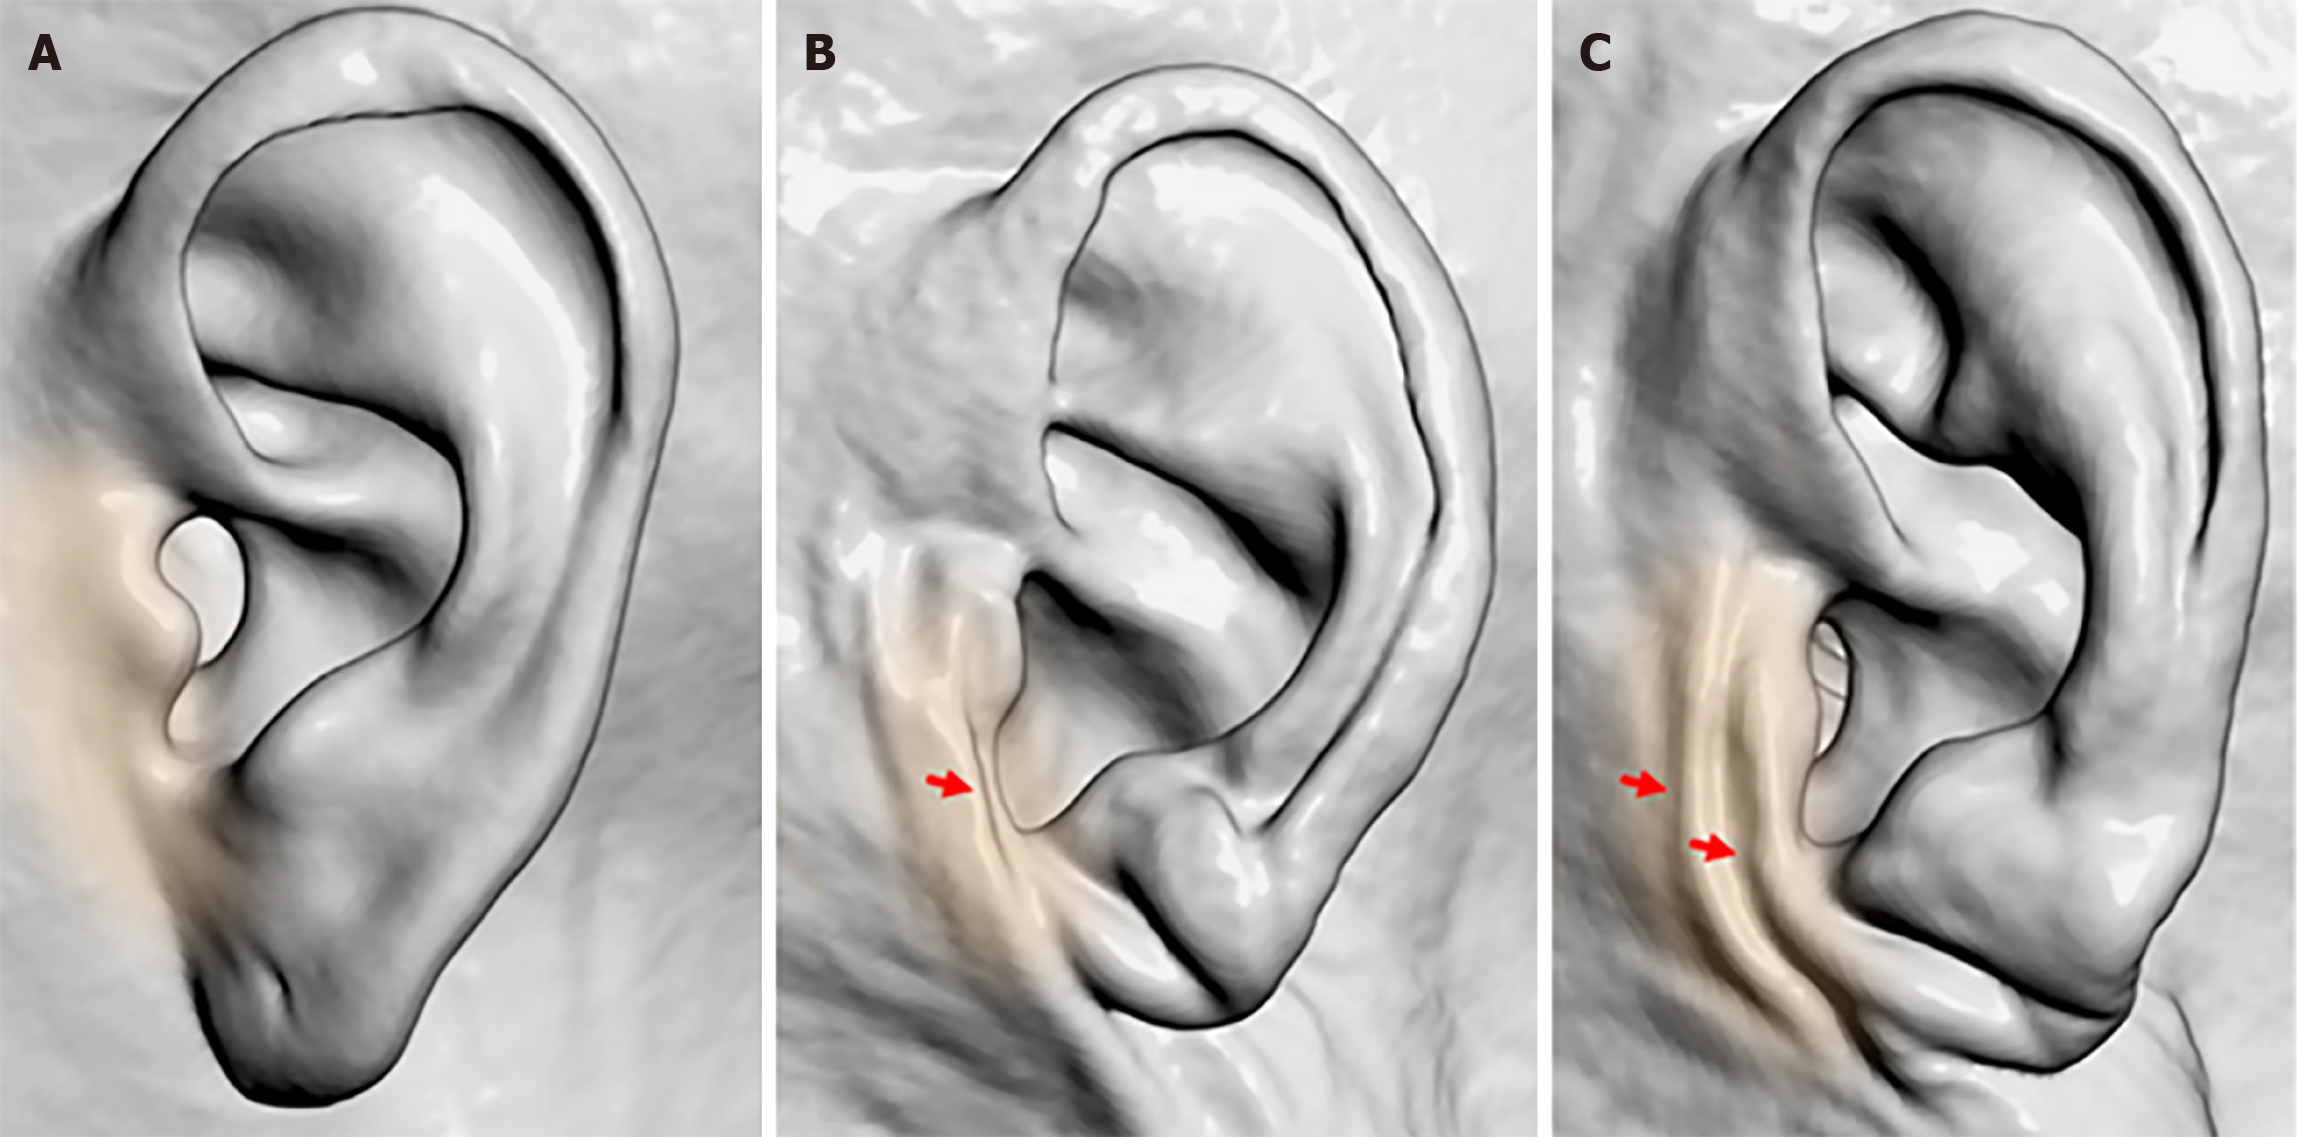
Figure 2 Preauricular assessment (colored area) of the anterior tragal crease utilizing volume rendering technique of the external ear.
A: No vertical line in a 22 years old female; B: One vertical crease in a 68 years old male (red arrow); C: Two vertical creases in a 90 years old male (red arrows).
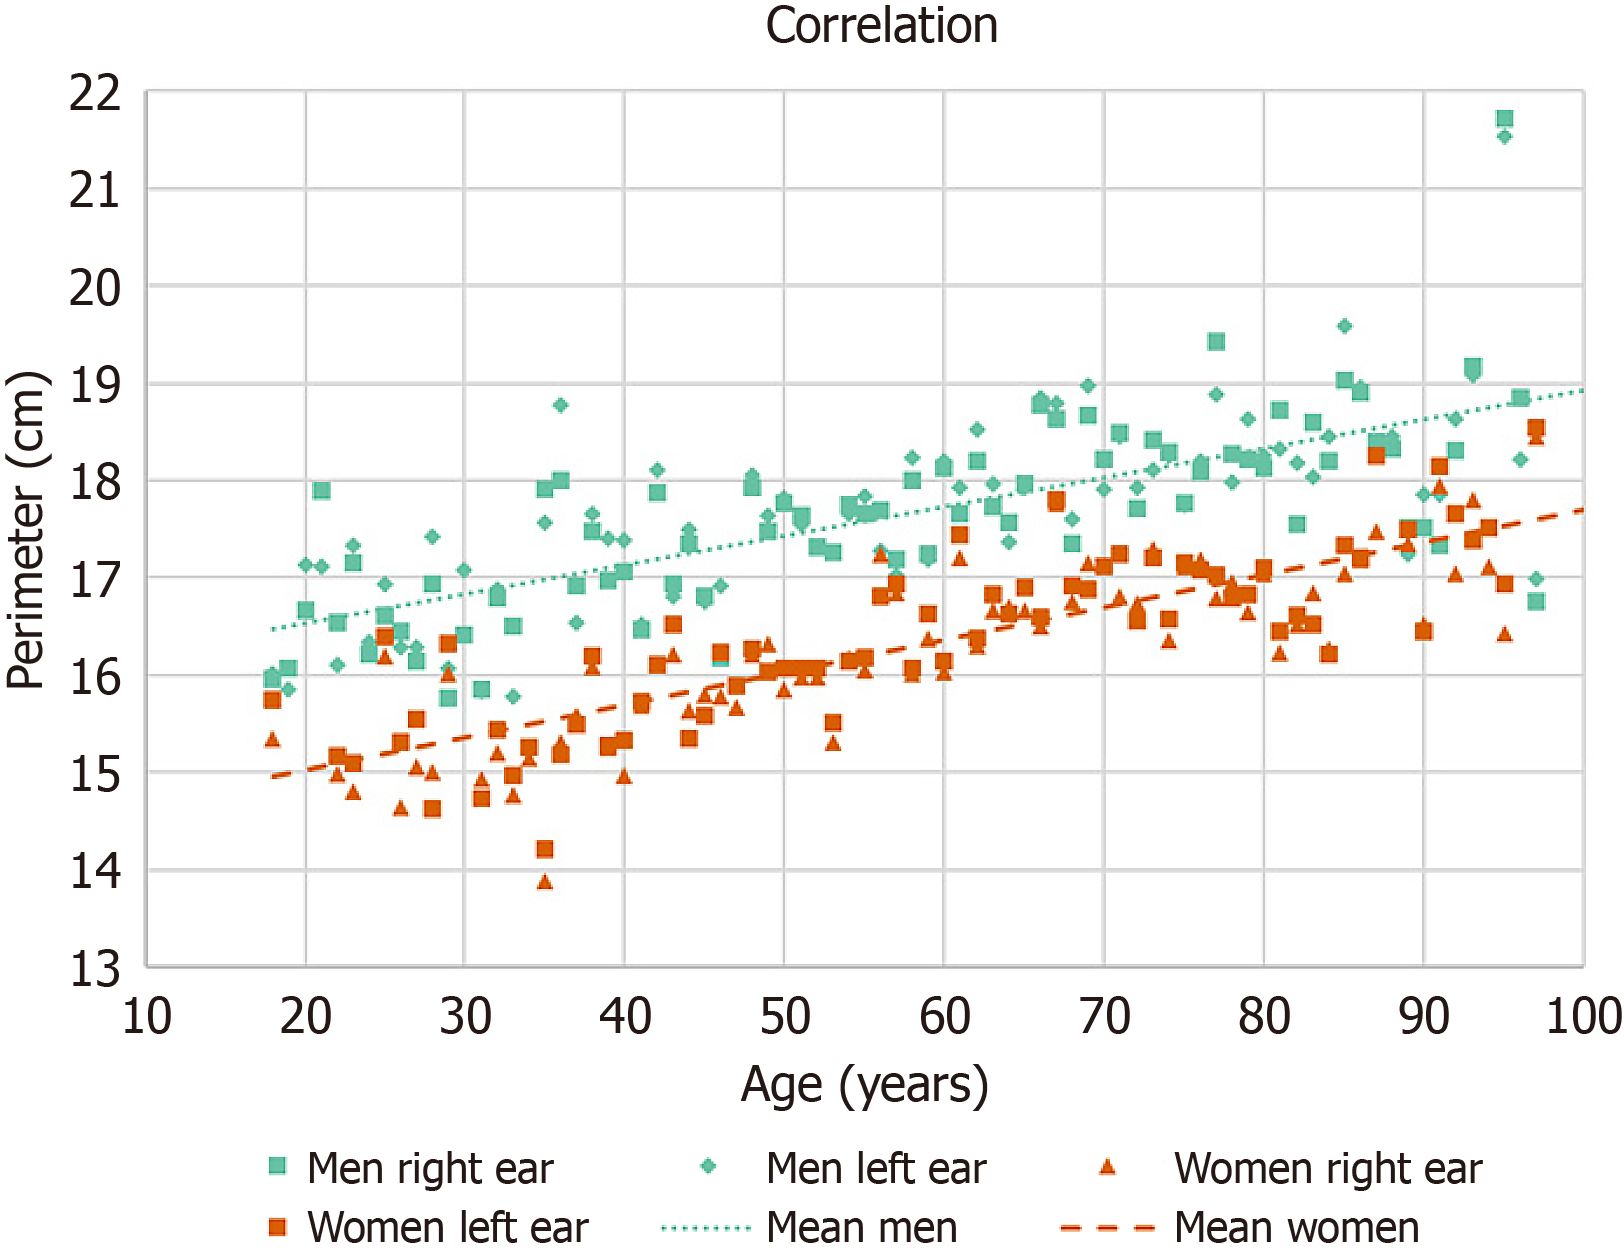
Figure 3
Correlation between auricular perimeter and patient age for both males (n = 329) and females (n = 342).
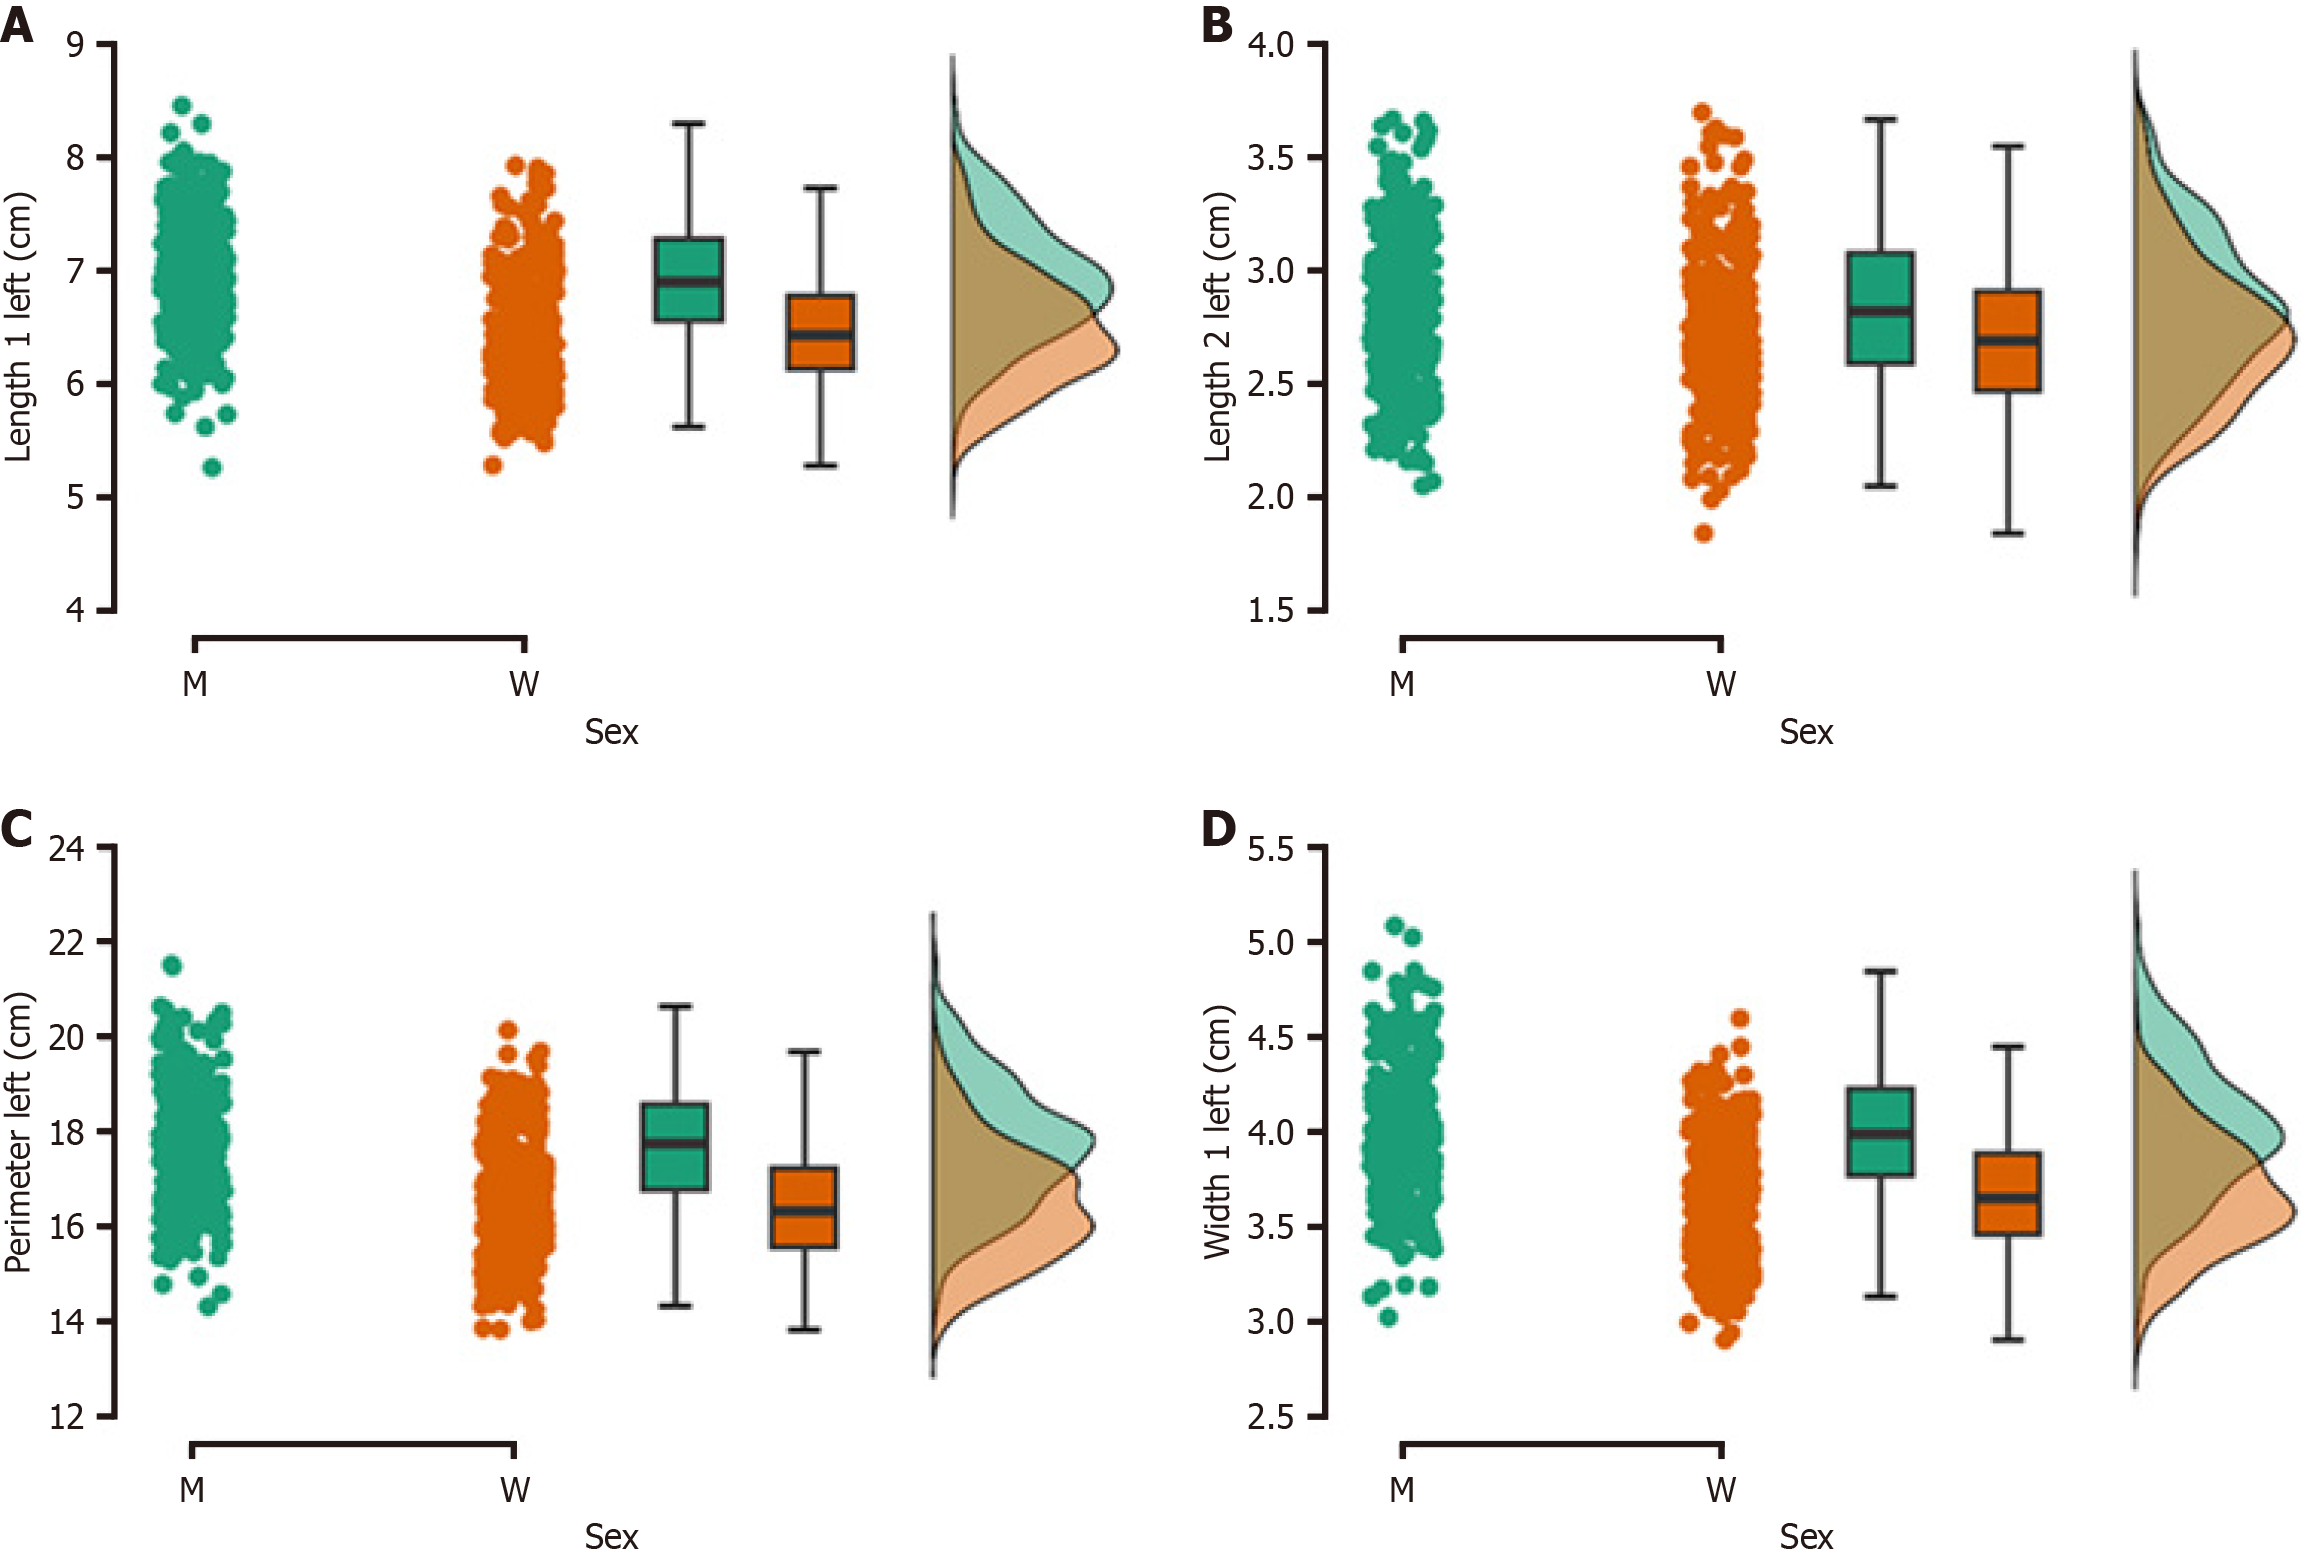
Figure 4 Raincloud plot depicting the significant (P < 0.
001) differences of length 1, length 2, perimeter and width 1 between males (m) and females (w) for the left ear. A: Length 1 left; B: Length 2 left; C: Perimeter left; D: Width 1 left.
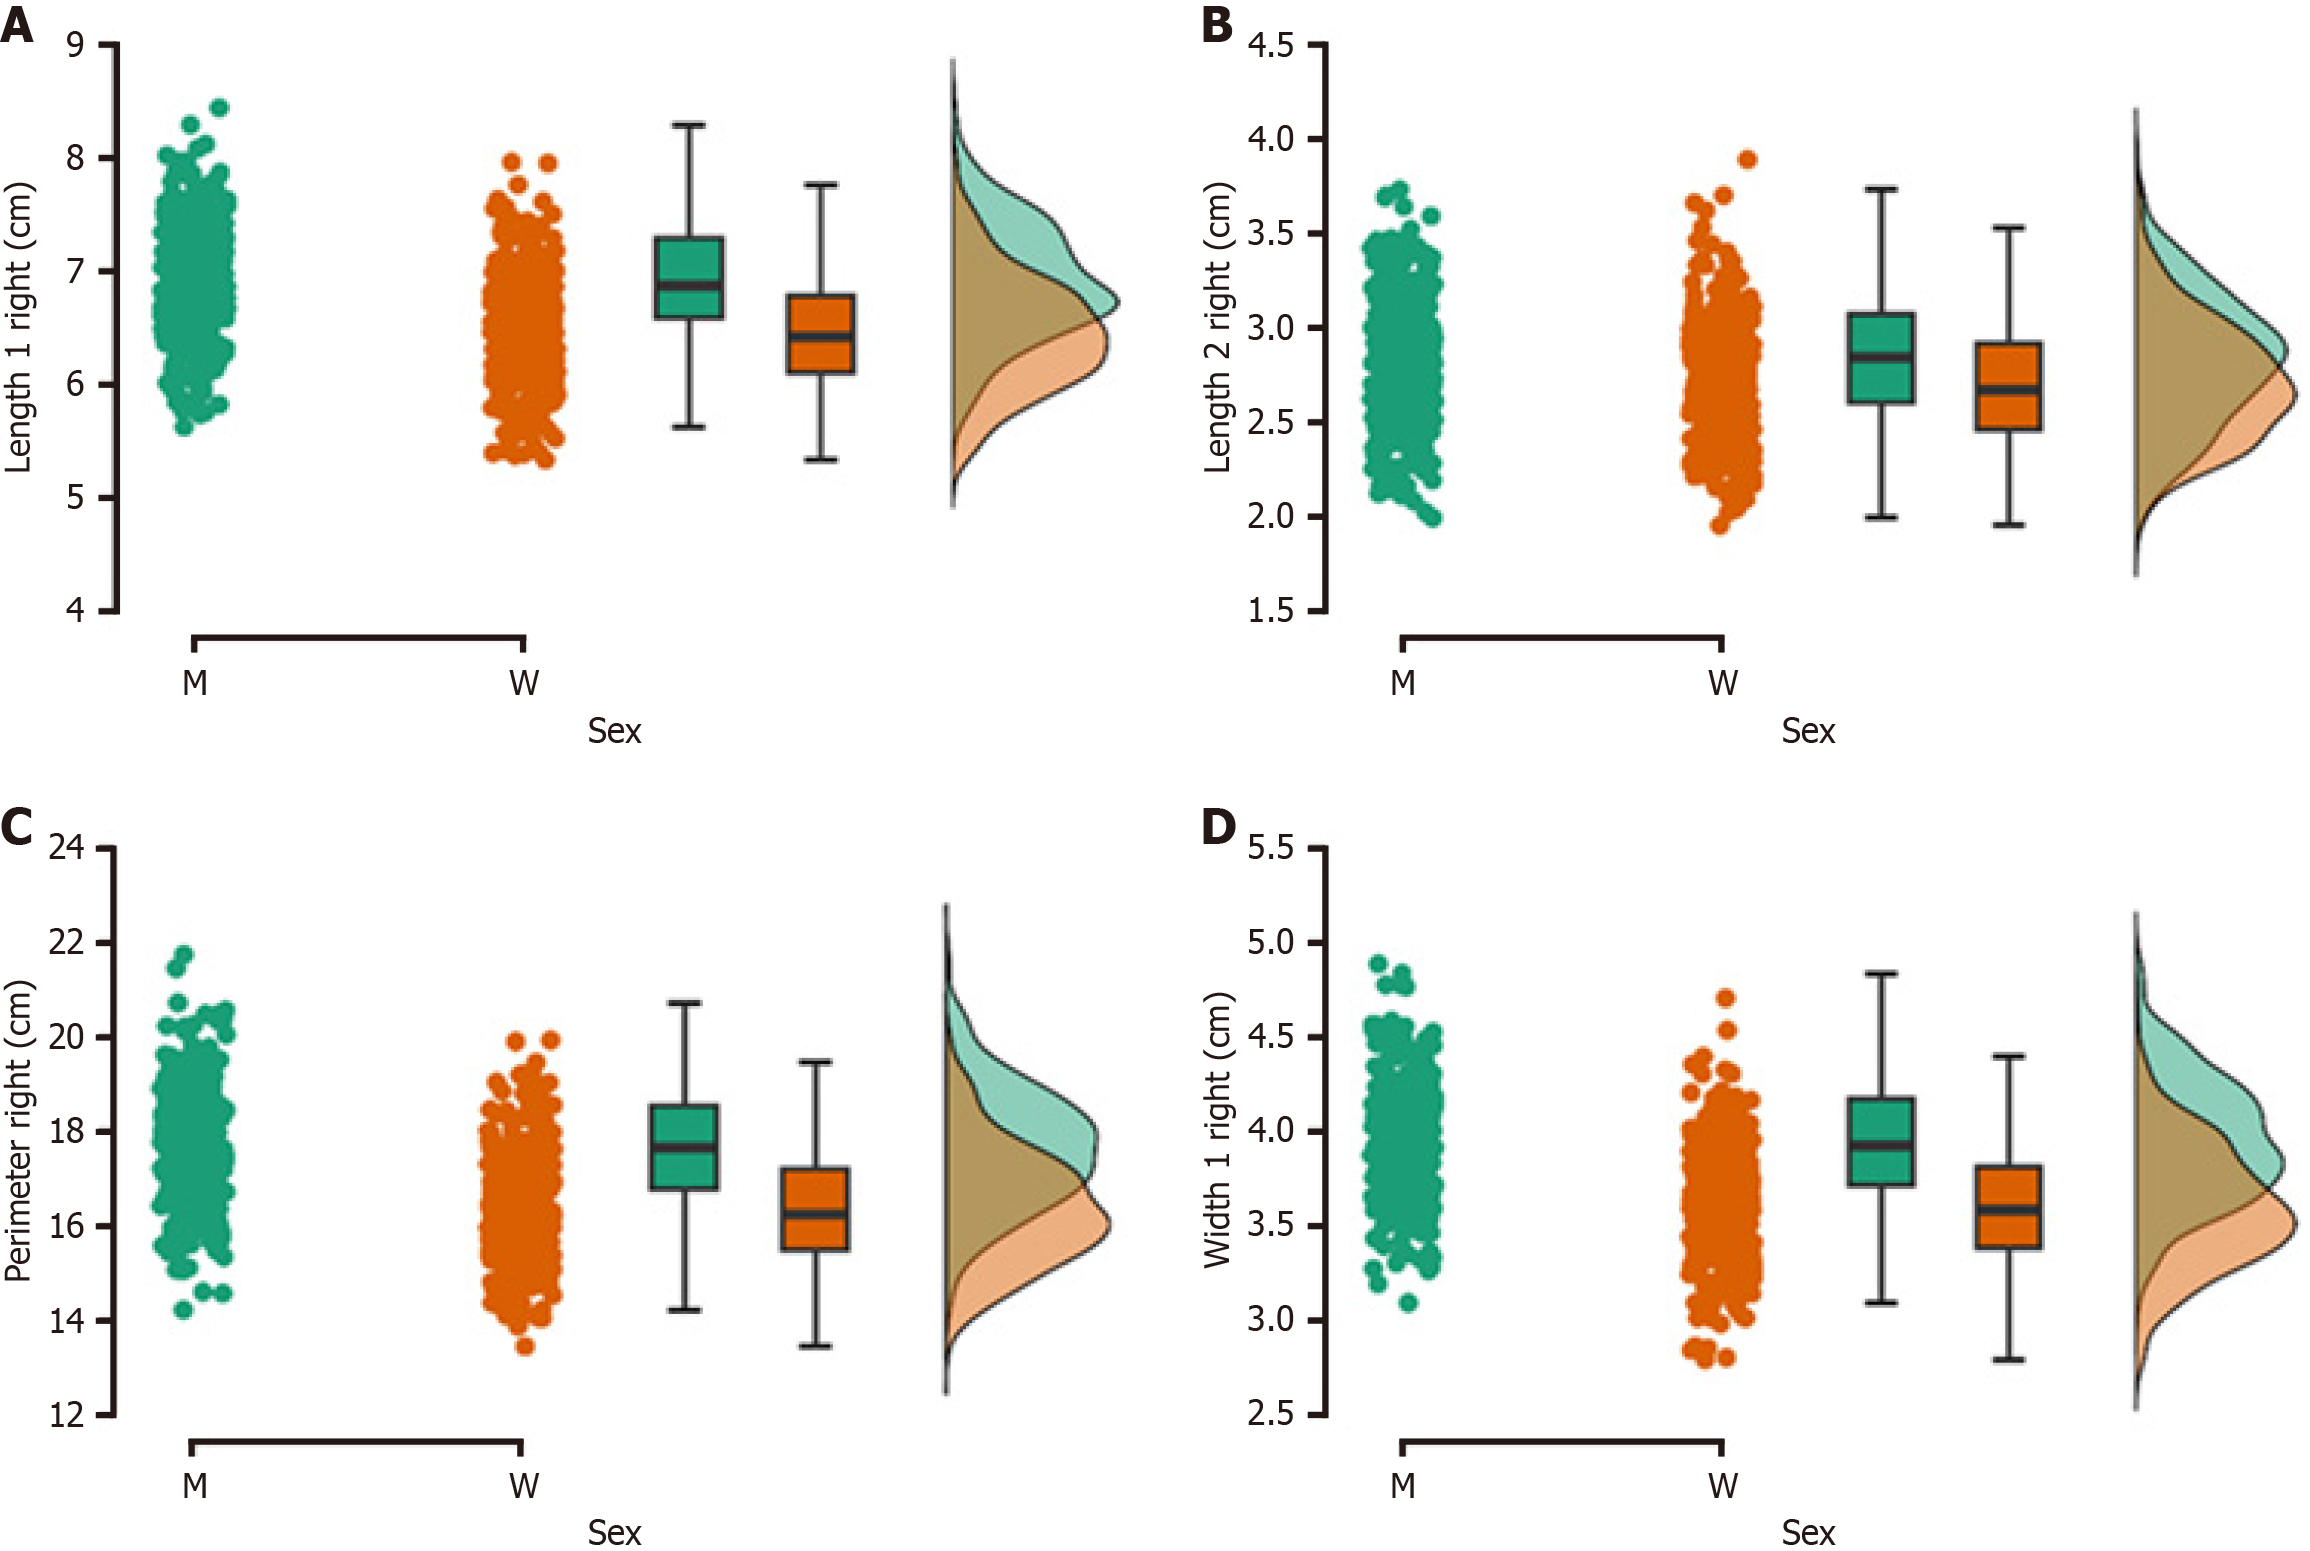
Figure 5 Raincloud plot depicting the significant (P < 0.
001) differences of length 1, length 2, perimeter, and width 1 between males (m) and females (w) for the right ear. A: Length 1 right; B: Length 2 right; C: Perimeter right; D: Width 1 right.
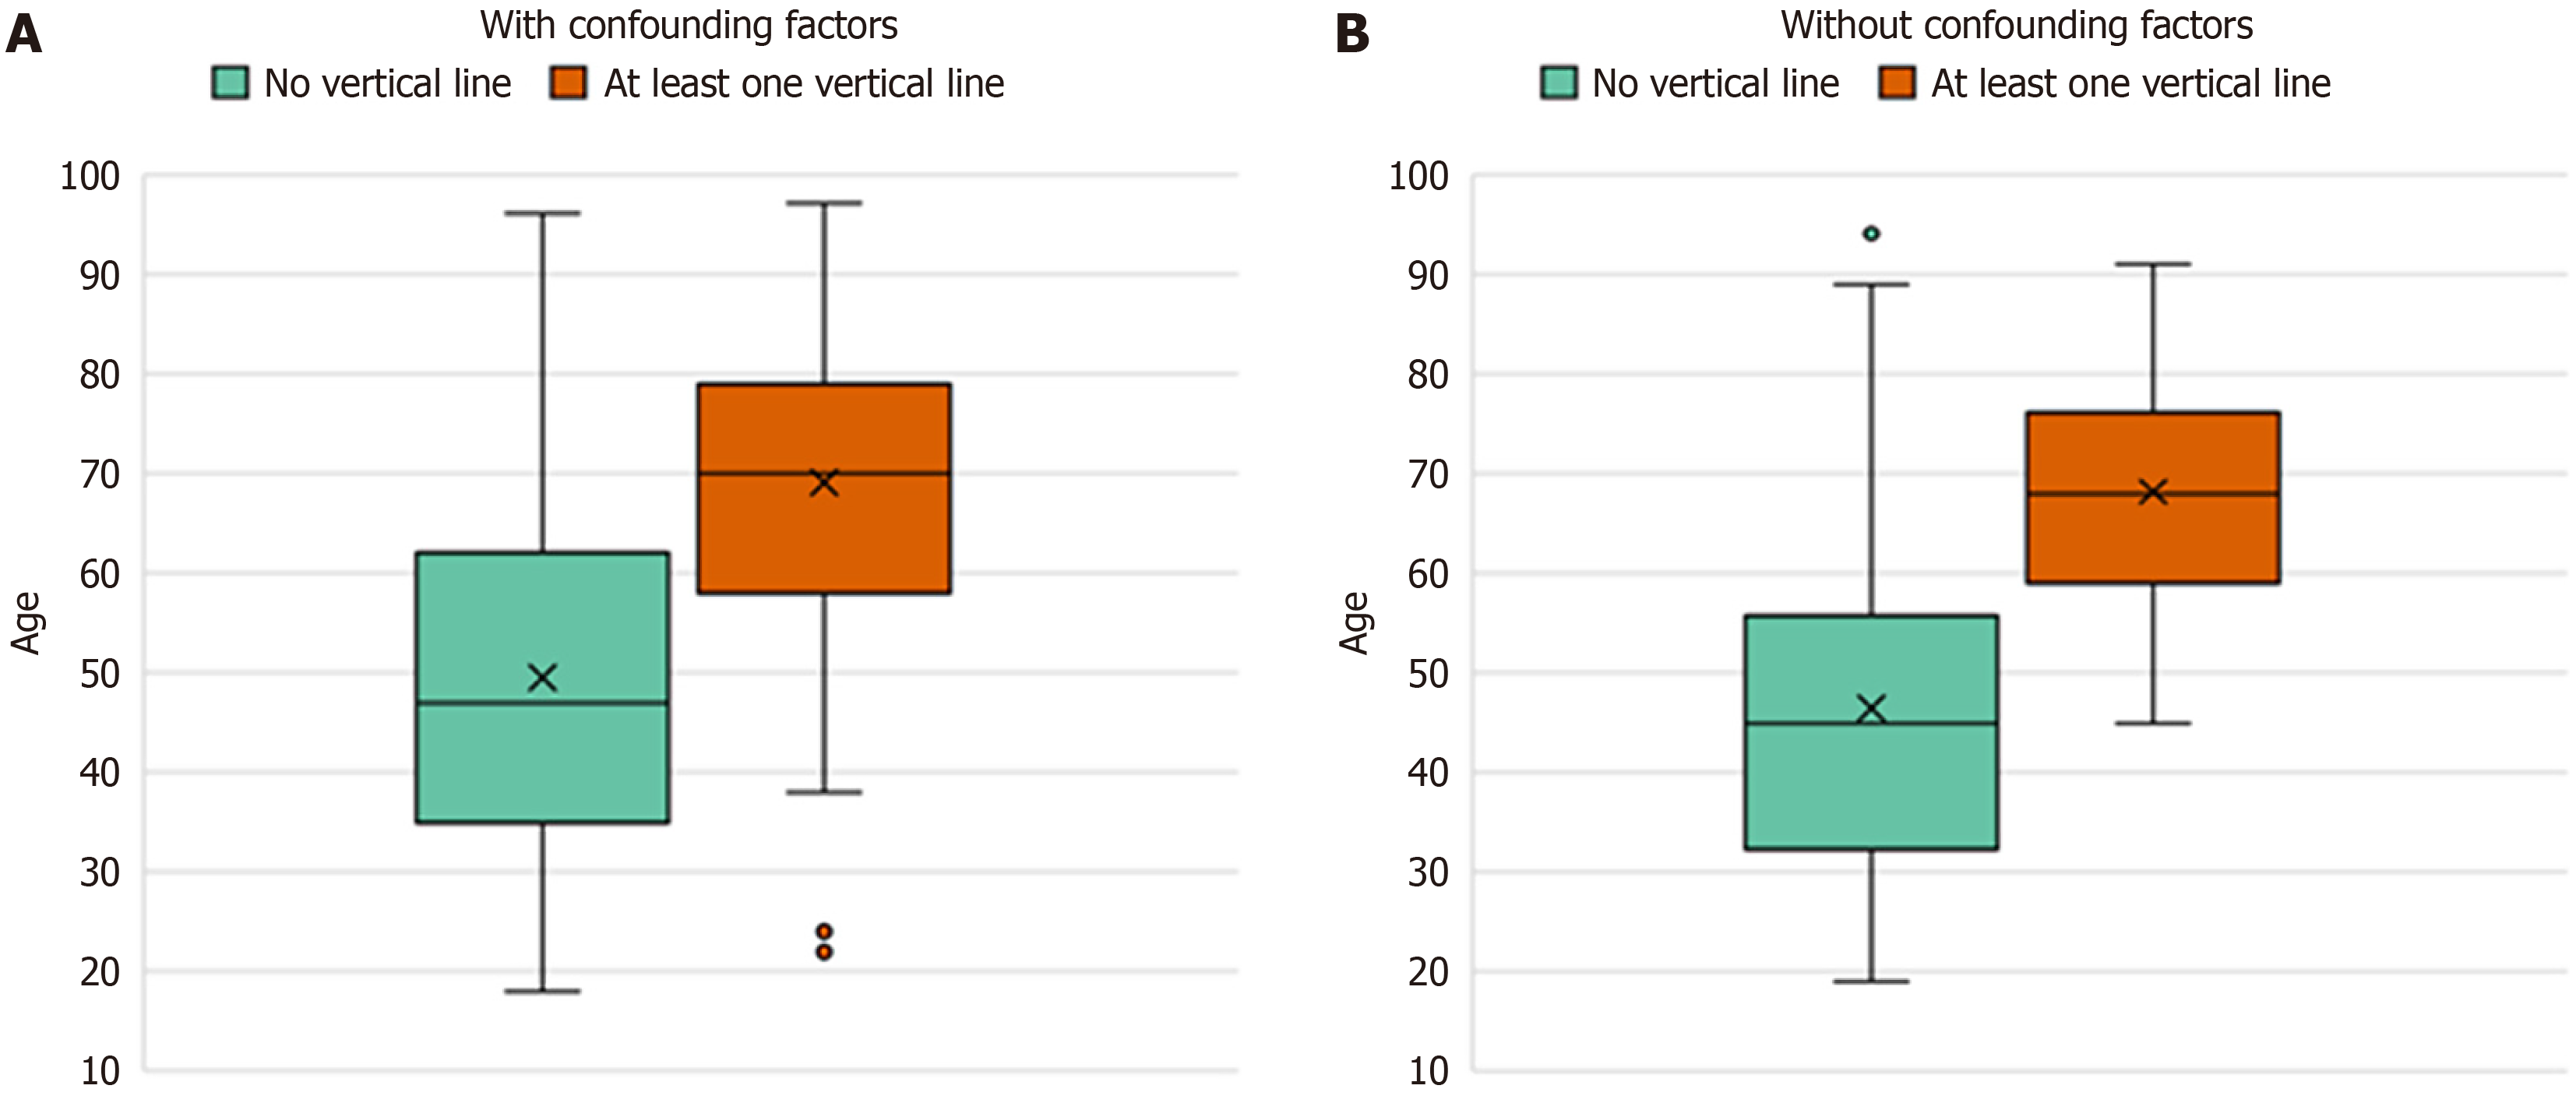
Figure 6 Evaluation of preauricular vertical lines.
A: Without excluding ears with confounding factors (n = 671); B: With confounding factors excluded (n = 159).
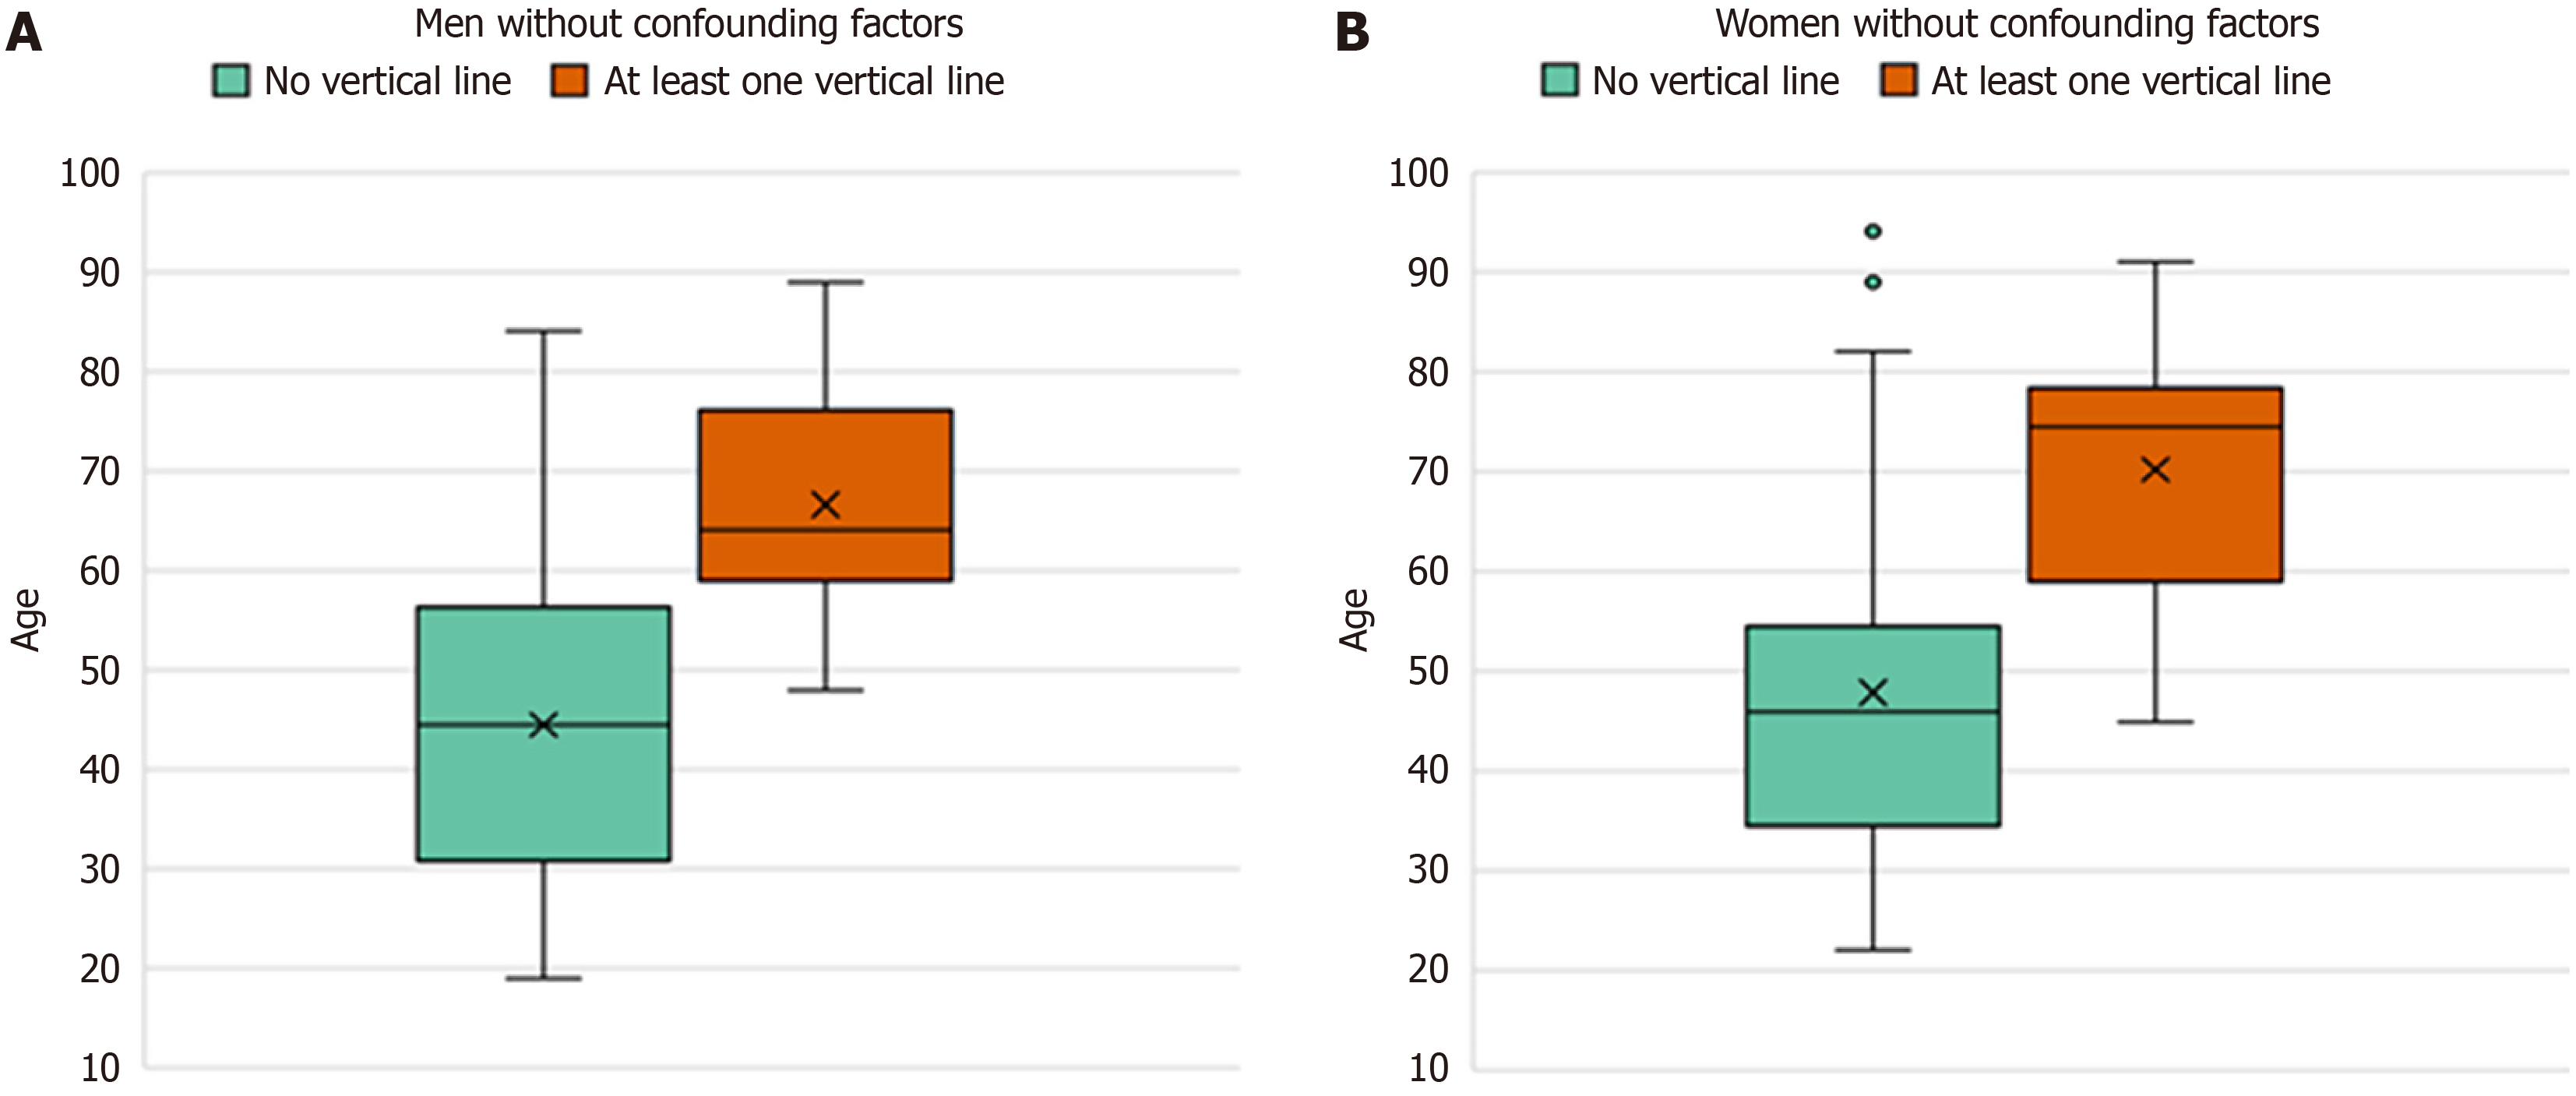
Figure 7 Sex-specific evaluation of the preauricular vertical lines with confounding factors excluded.
A: Men (n = 77); B: Women (n = 82).
- Citation: Schulz B, Thali M, Kubik-Huch R, Niemann T. Auricular dimensions in computed-tomography: Unveiling the relationship between ear dimensions, age, and sex using three-dimensional volume rendering reconstructions. World J Radiol 2024; 16(12): 760-770
- URL: https://www.wjgnet.com/1949-8470/full/v16/i12/760.htm
- DOI: https://dx.doi.org/10.4329/wjr.v16.i12.760


