©The Author(s) 2024.
World J Radiol. Dec 28, 2024; 16(12): 749-759
Published online Dec 28, 2024. doi: 10.4329/wjr.v16.i12.749
Published online Dec 28, 2024. doi: 10.4329/wjr.v16.i12.749
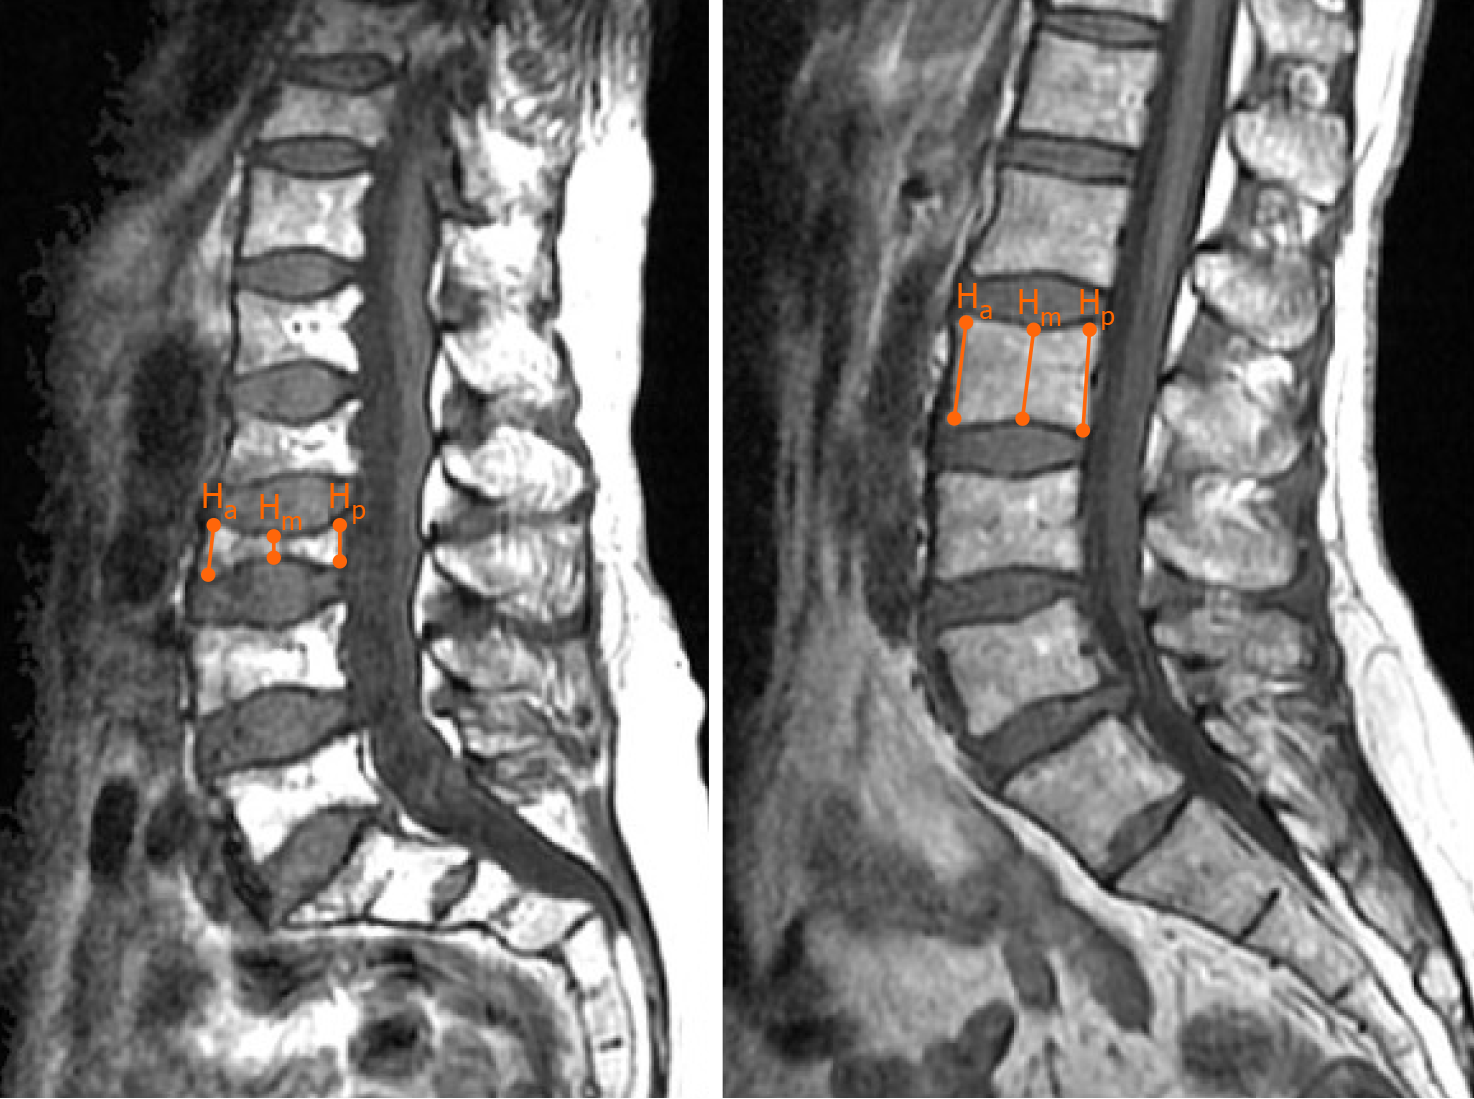
Figure 1 Representative magnetic resonance imaging demonstrating a severe L2 biconcavity deformity (left) and no L2 deformity (right) with anterior, middle, and posterior height measurements.
Ha: Anterior height; Hm: Middle height; Hp: Posterior height.
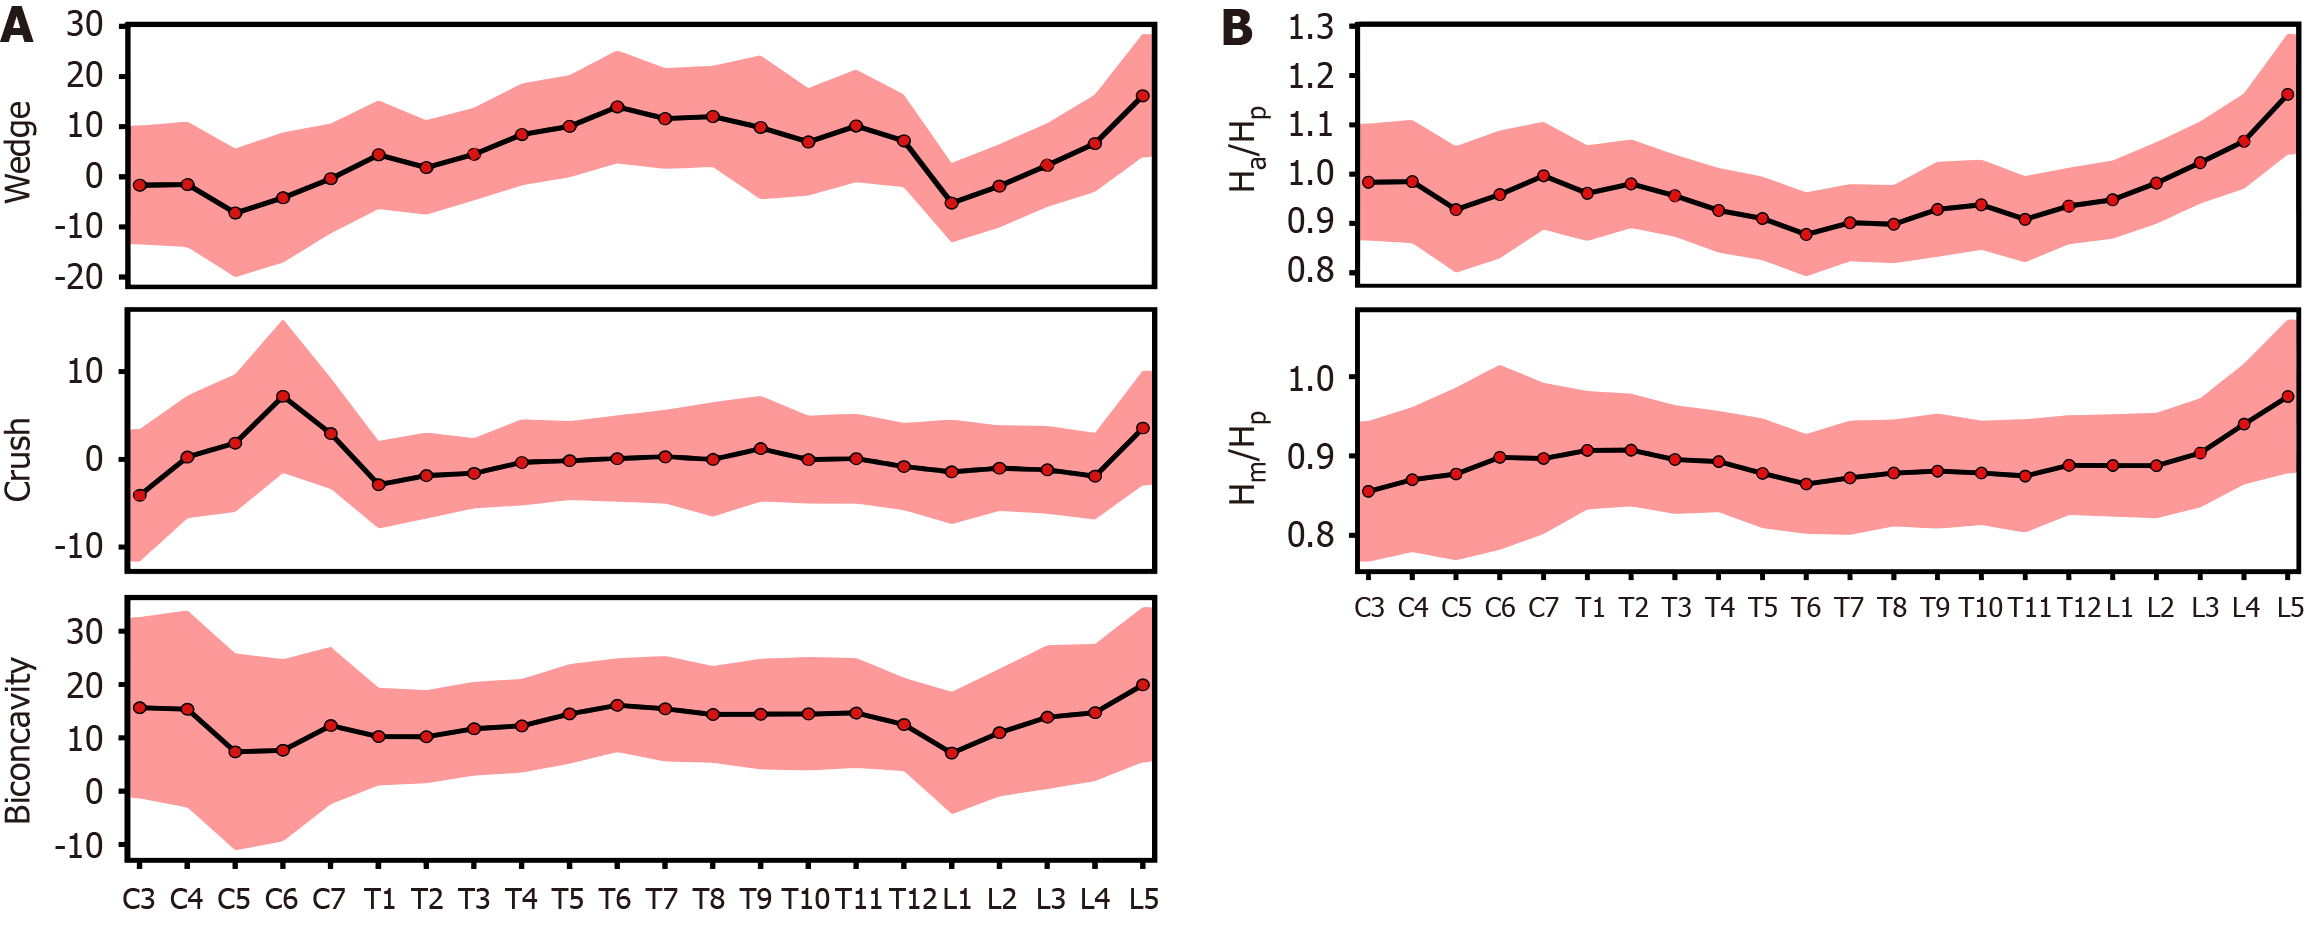
Figure 2 Individual vertebral measurements.
A: Mean wedge, crush, and biconcavity deformities of vertebrae C3-L5; B: Mean anterior height/posterior height and middle height/posterior height ratios of vertebrae C3-L5. Error clouds represent SD. Ha: Anterior height; Hm: Middle height; Hp: Posterior height.
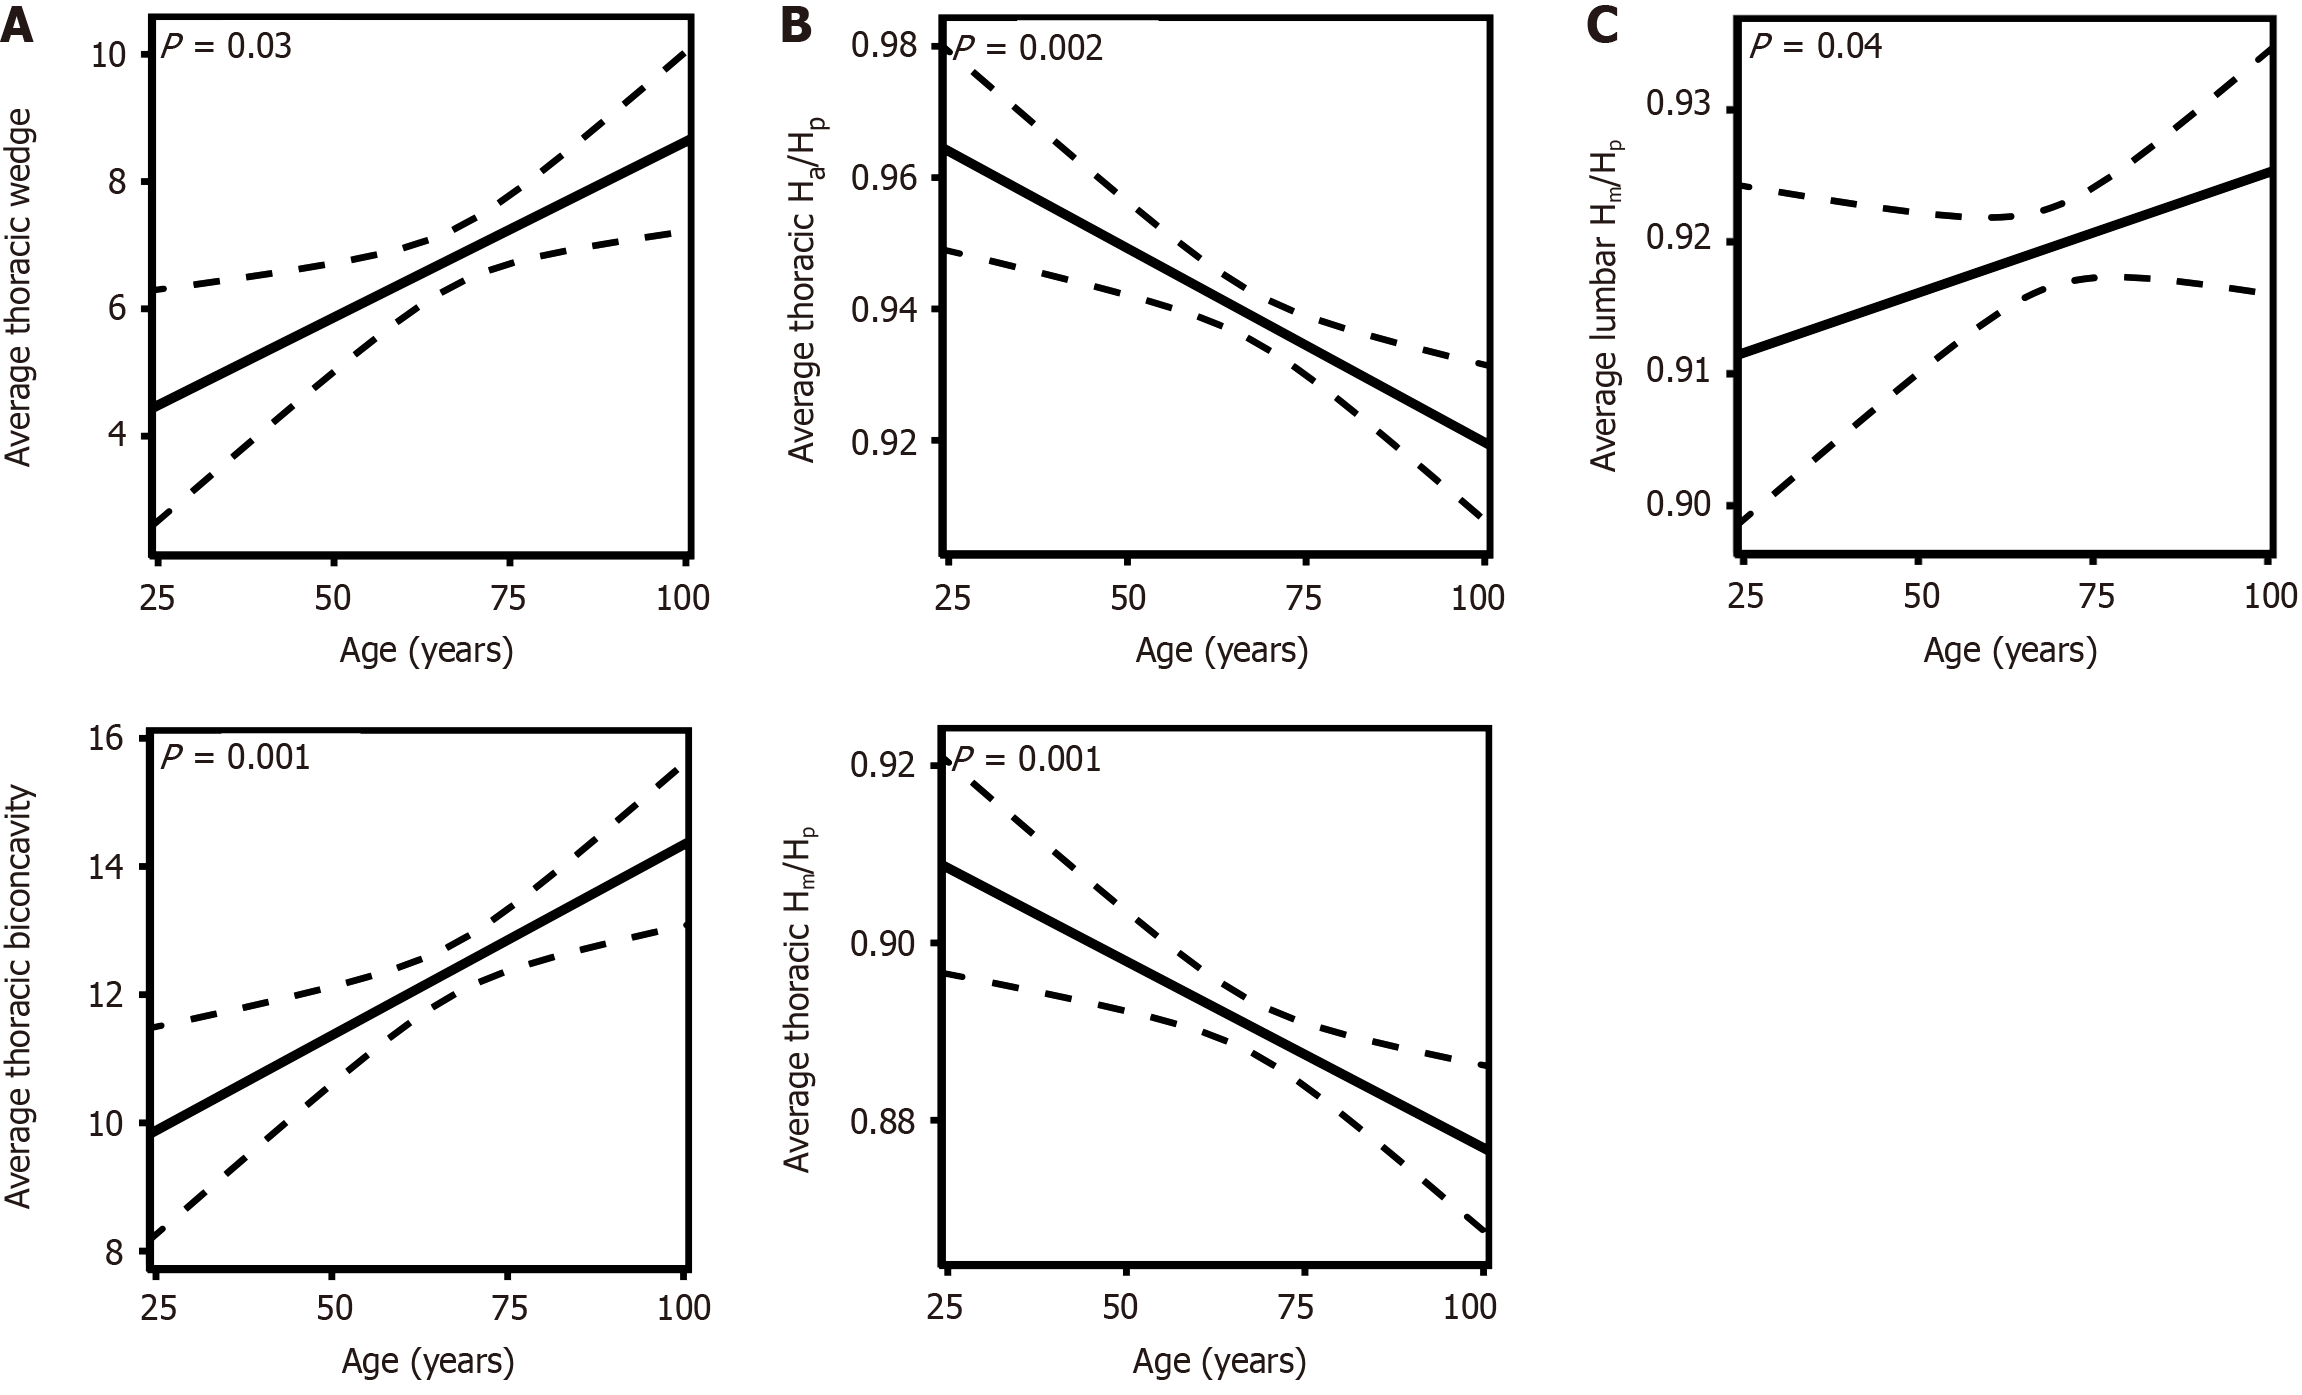
Figure 3 The relationship with age.
A: The relationship between age and average thoracic (T1-T12) wedge (left) and biconcavity (right) deformities; B: The relationship between age and average thoracic (T1-T12) anterior height/posterior height (left) and middle height/posterior height (right); C: The relationship between age and average lumbar (L1-L5) middle height/posterior height. Ha: Anterior height; Hm: Middle height; Hp: Posterior height.
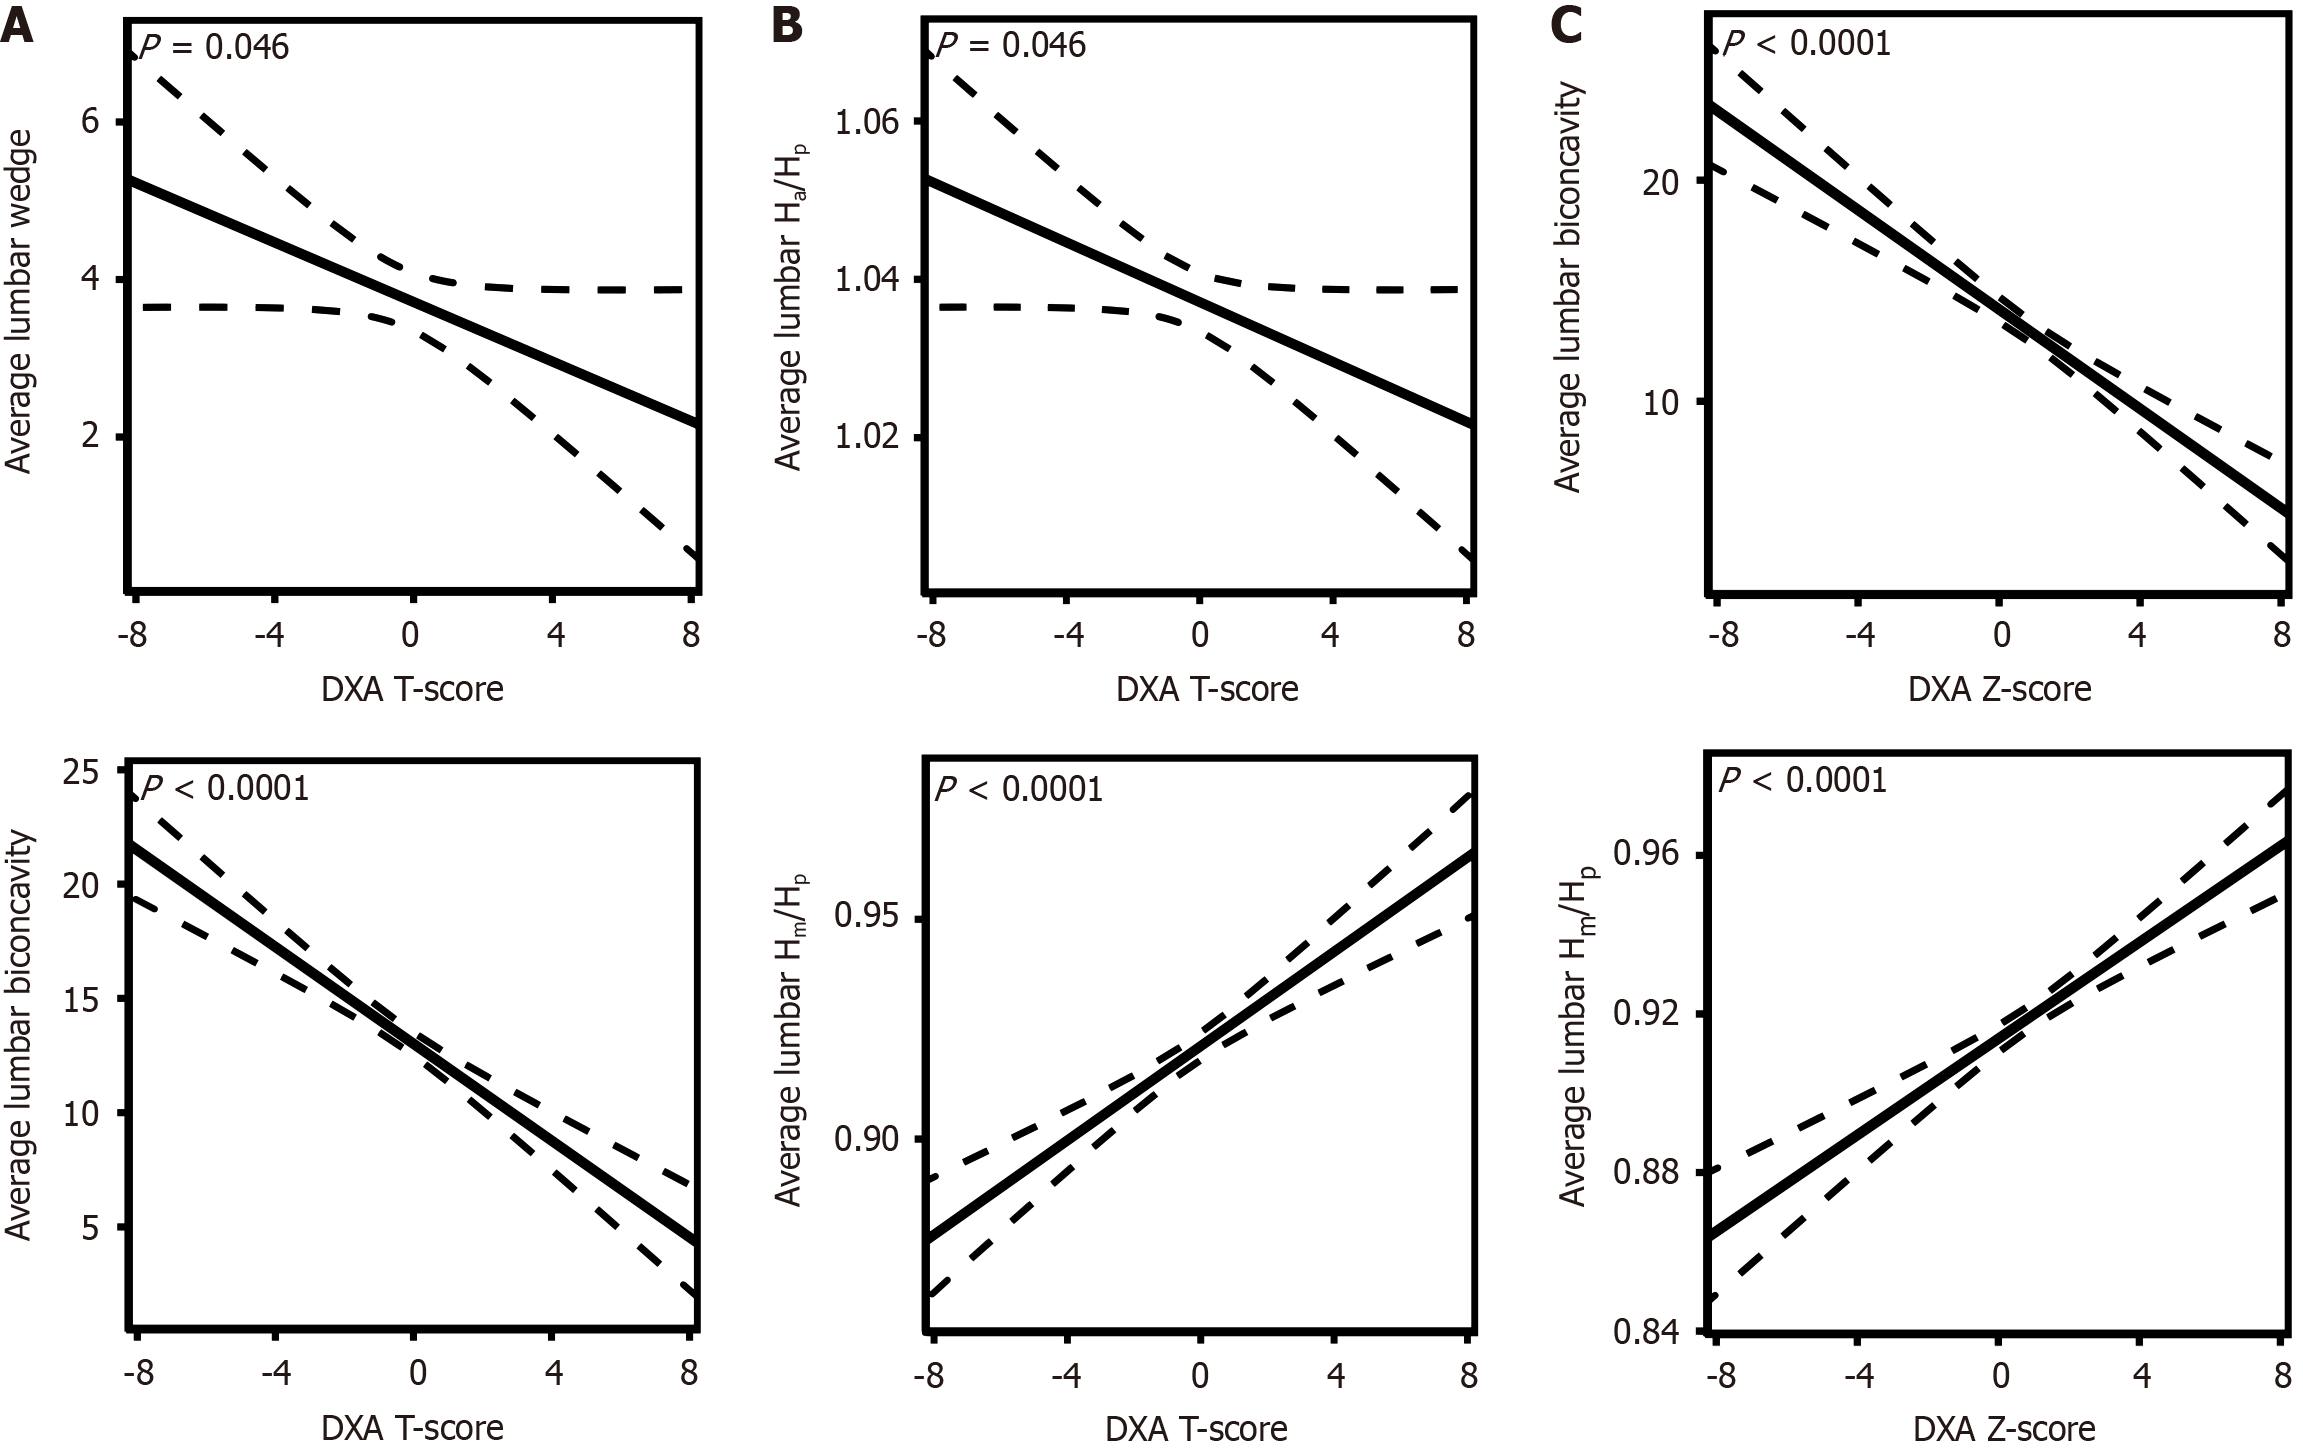
Figure 4 The relationship with dual-energy X-ray absorptiometry scores.
A: The relationship between dual-energy X-ray absorptiometry (DXA) T-scores and average lumbar (L1-L5) wedge (left) and biconcavity (right) deformities; B: The relationship between DXA T-scores and average lumbar (L1-L5) anterior height/posterior height (left) and middle height/posterior height (right); C: The relationship between DXA Z-scores and average lumbar (L1-L5) biconcavity (left) and middle height/posterior height (right). DXA: Dual-energy X-ray absorptiometry; Ha: Anterior height; Hm: Middle height; Hp: Posterior height.
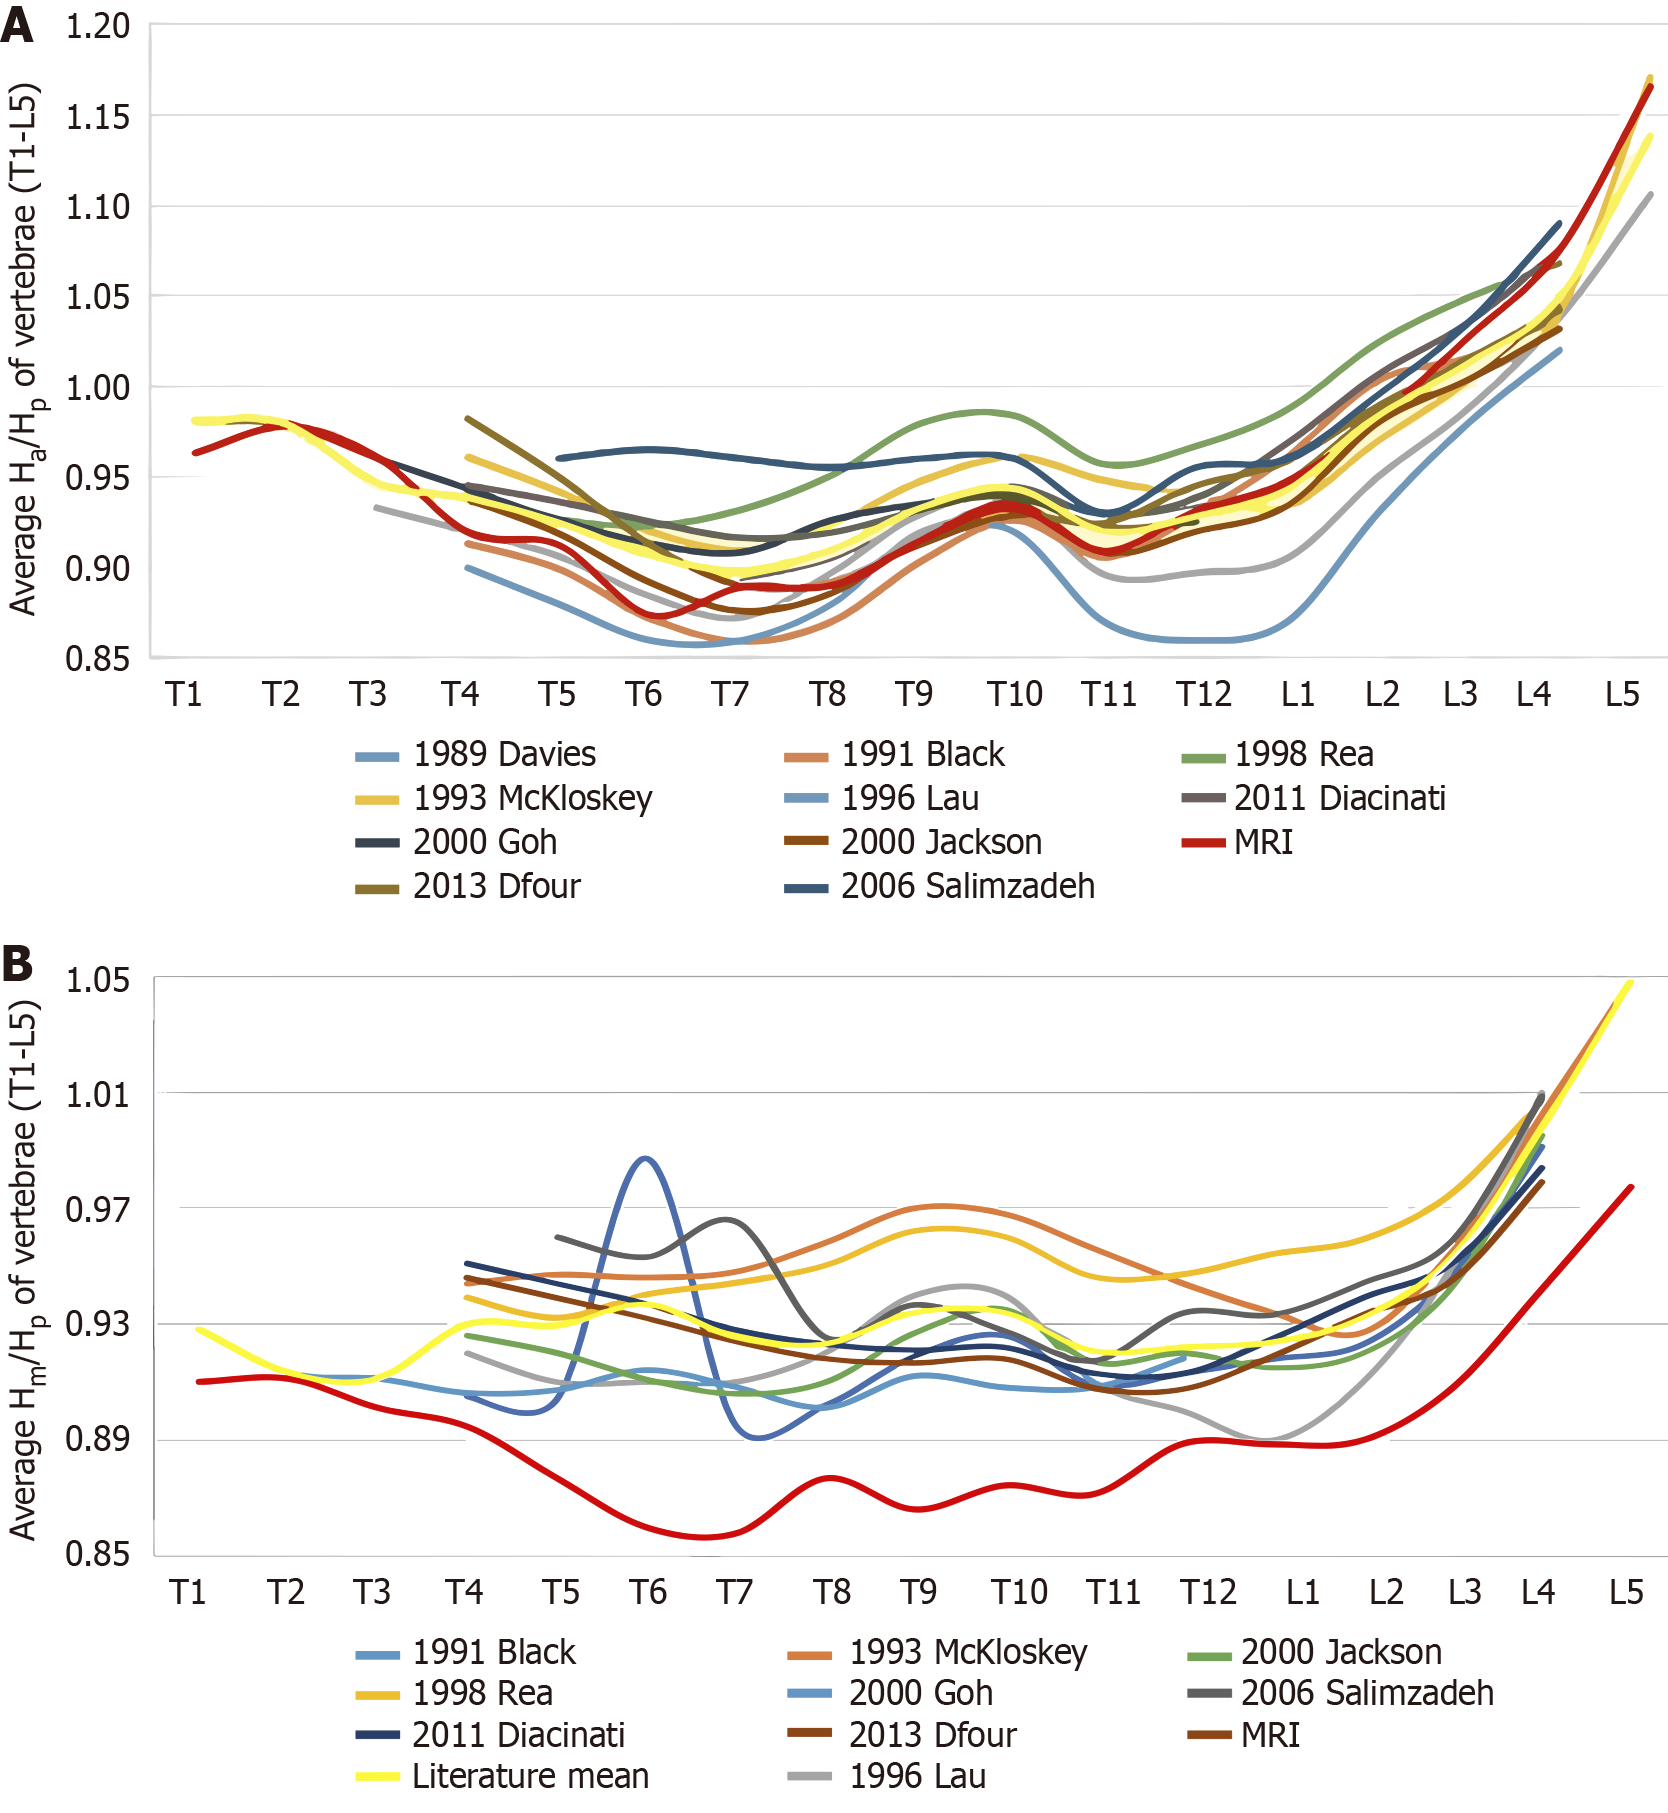
Figure 5 Magnetic resonance imaging cohort compared to two-dimensional existing literature.
A: Distribution of average anterior height/posterior height from prior studies. The magnetic resonance imaging cohort (red) differs from the two-dimensional radiograph-derived literature mean (yellow) by a maximum of 0.3; B: Distribution of average middle height/posterior height from prior studies. The magnetic resonance imaging cohort (red) differs from the two-dimensional radiograph-derived literature mean (yellow) by a maximum of 1.2. Ha: Anterior height; Hm: Middle height; Hp: Posterior height.
- Citation: Sorci OR, Madi R, Kim SM, Batzdorf AS, Alecxih A, Hornyak JN, Patel S, Rajapakse CS. Normative vertebral deformity measurements in a clinically relevant population using magnetic resonance imaging. World J Radiol 2024; 16(12): 749-759
- URL: https://www.wjgnet.com/1949-8470/full/v16/i12/749.htm
- DOI: https://dx.doi.org/10.4329/wjr.v16.i12.749


